. 2019 Jun;21(6):687-699.
doi: 10.1038/s41556-019-0333-2. Epub 2019 Jun 3.

Establishment of porcine and human expanded potential stem cells

Affiliations

Establishment of porcine and human expanded potential stem cells

Xuefei Gao et al. Nat Cell Biol. 2019 Jun.

Abstract

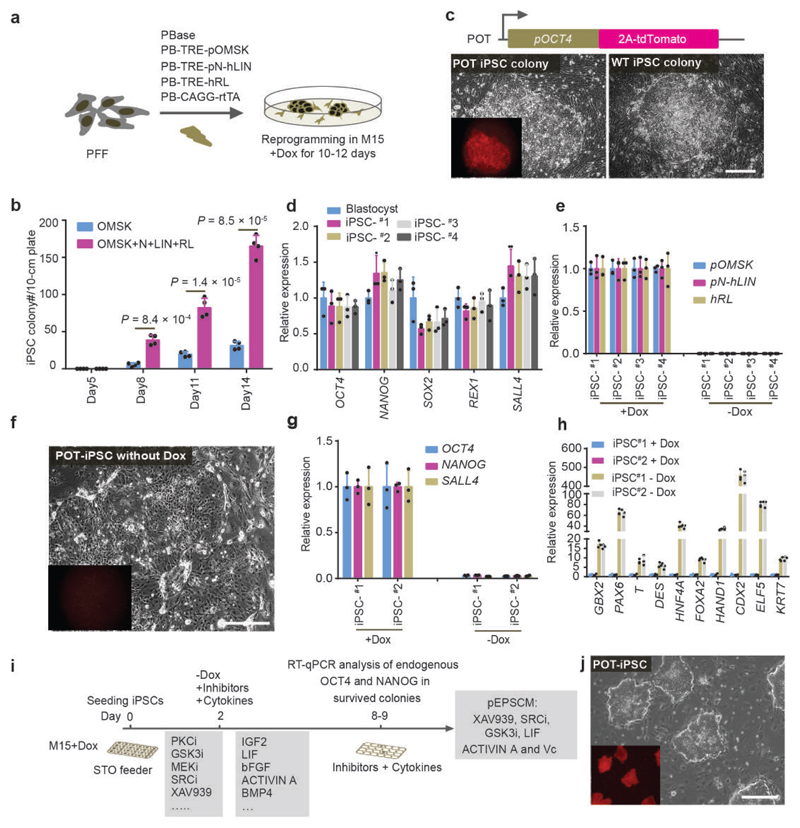
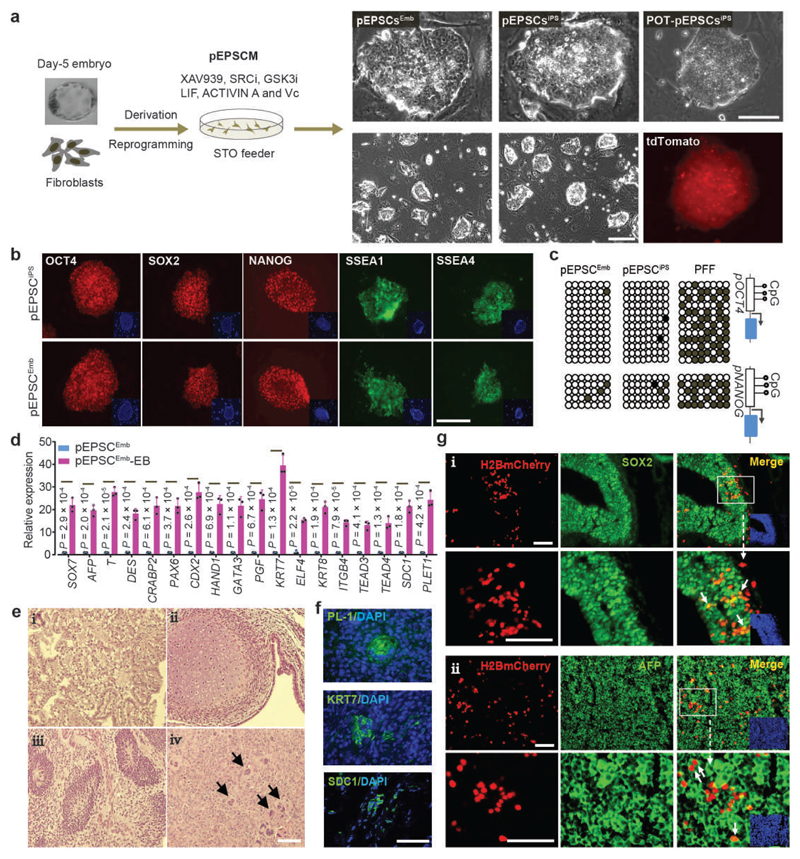
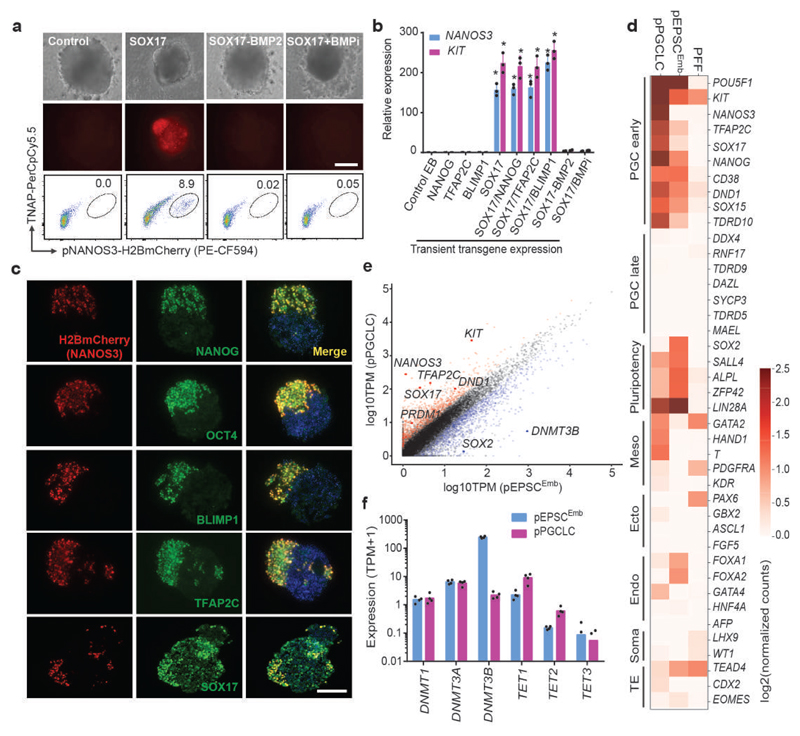
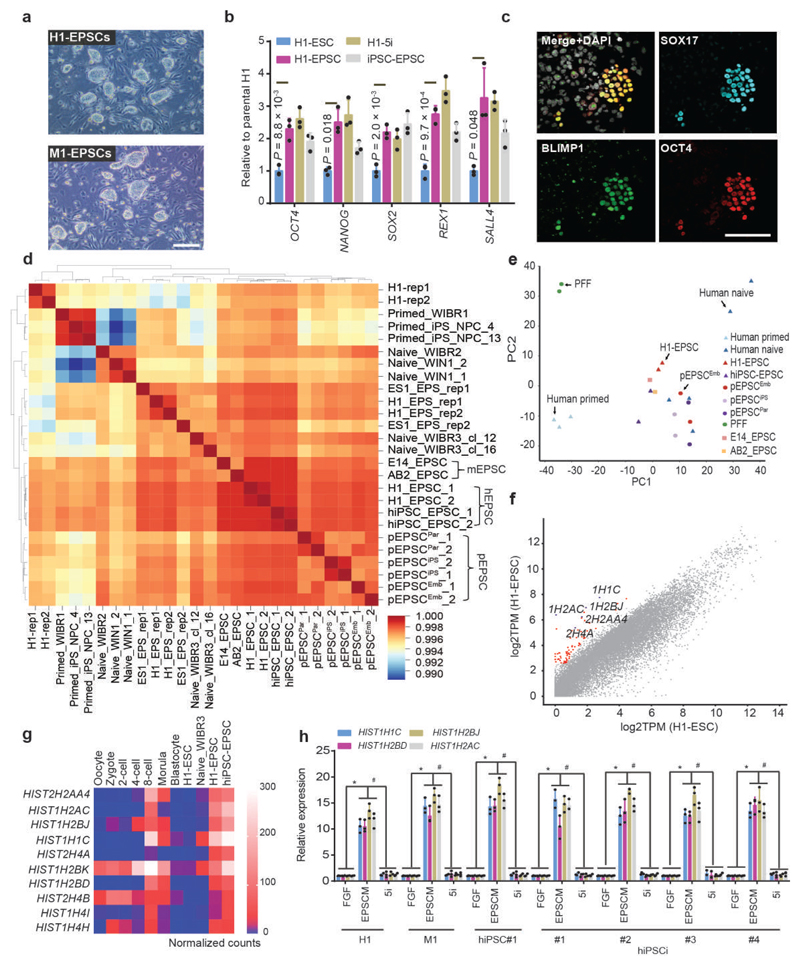
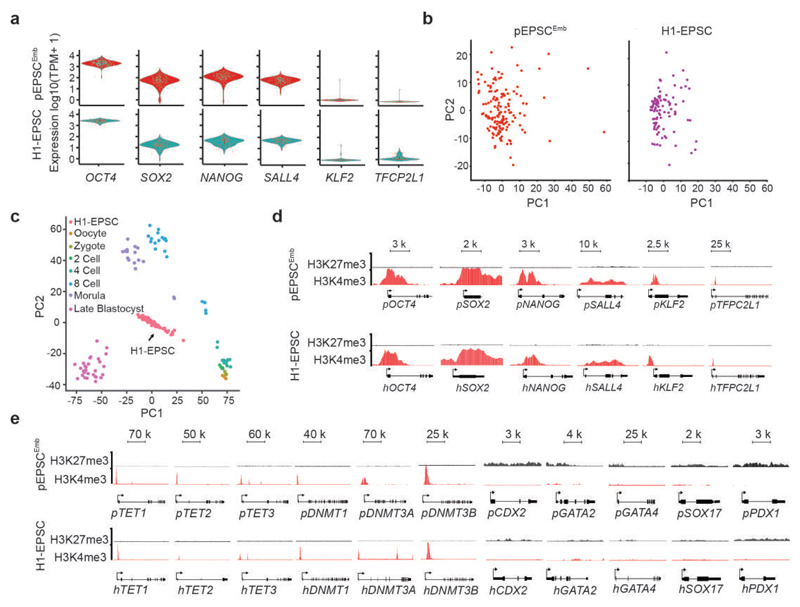
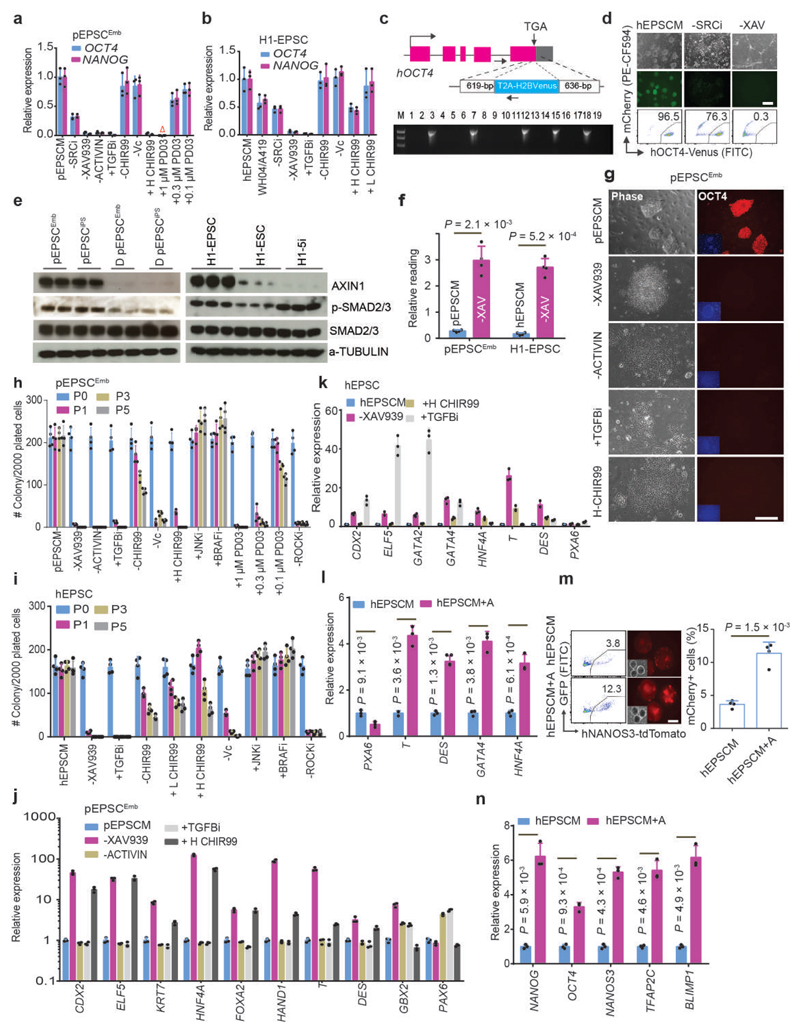
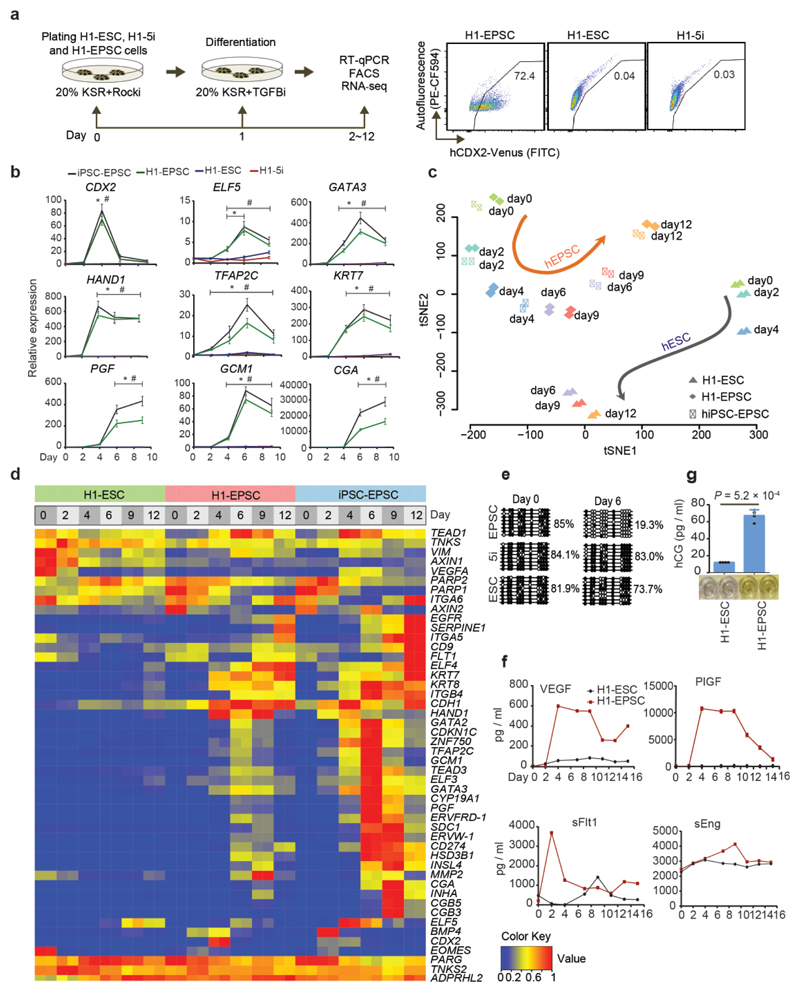
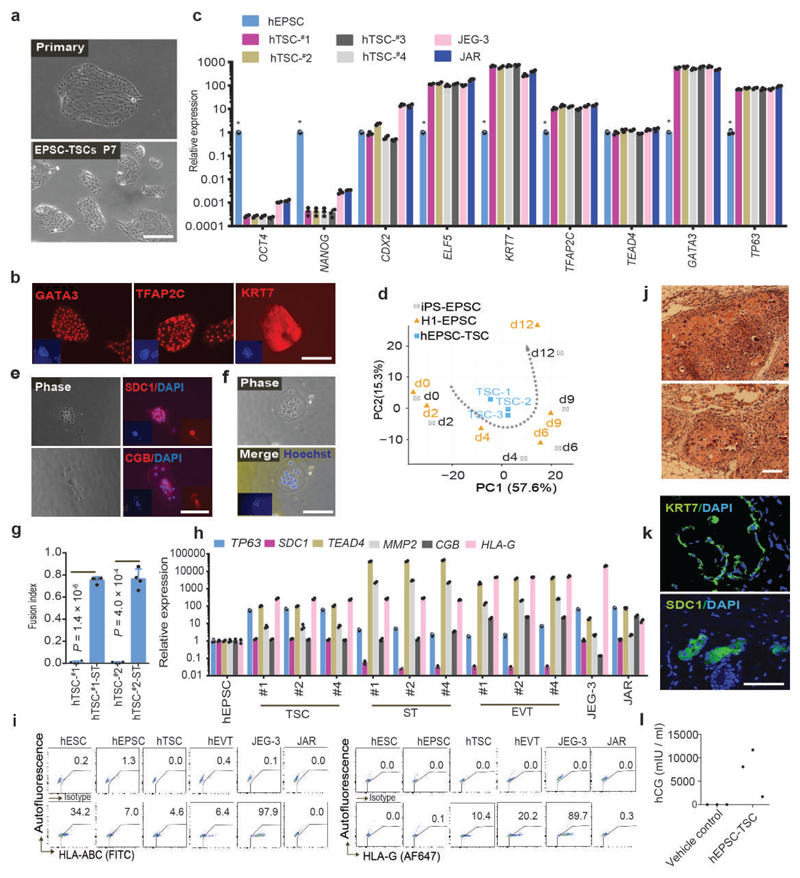
We recently derived mouse expanded potential stem cells (EPSCs) from individual blastomeres by inhibiting the critical molecular pathways that predispose their differentiation. EPSCs had enriched molecular signatures of blastomeres and possessed developmental potency for all embryonic and extra-embryonic cell lineages. Here, we report the derivation of porcine EPSCs, which express key pluripotency genes, are genetically stable, permit genome editing, differentiate to derivatives of the three germ layers in chimeras and produce primordial germ cell-like cells in vitro. Under similar conditions, human embryonic stem cells and induced pluripotent stem cells can be converted, or somatic cells directly reprogrammed, to EPSCs that display the molecular and functional attributes reminiscent of porcine EPSCs. Importantly, trophoblast stem-cell-like cells can be generated from both human and porcine EPSCs. Our pathway-inhibition paradigm thus opens an avenue for generating mammalian pluripotent stem cells, and EPSCs present a unique cellular platform for translational research in biotechnology and regenerative medicine.


Figures

Figure 1
Figure 1. Identification of culture conditions for porcine EPSCs.
a. Doxycycline (Dox)-inducible expression of Yamanaka factors OCT4, MYC, SOX2 and KLF4, together with LIN28, NANOG, LRH1 and RARG in porcine PFFs. Stable genomic integration of cDNAs in PFFs was achieved by piggyBac transposition. pOMSK: Porcine OCT4, MYC, SOX2 and KLF4; pN+hLIN: porcine NANOG and human LIN28; hRL: human RARG and LRH1. The reprogrammed colonies were single-cell passaged in the presence of Dox in M15 (15% fetal calf serum). b. Co-expression of LIN28, NANOG, LRH1 and RARG substantially increased the number of reprogrammed colonies from 250,000 PFFs (n = 4 independent experiments). c. Reprogramming of the porcine OCT4-tdTomato knock-in reporter (POT) TAIHU and wide type (WT) German Landrace PFFs to iPSCs. d. The iPSCs lines expressed key pluripotency genes in RT-qPCR analysis. The iPSC lines #1 and #2, and iPSC #3 and #4 were from WT German Landrace and POT PFFs, respectively. e. RT-qPCR analysis of the exogenous reprogramming factors in iPSCs either in the presence of Dox or 5 days after its removal. f. POT iPSCs became Td-tomato negative 5 days after Dox removal. g. RT-qPCR analysis of the expression of endogenous pluripotency genes in iPSCs cultured with or without Dox. h. Expression of lineage genes in porcine iPSCs 5-6 days after DOX removal. Gene expression was measured by RT-qPCR. Relative expression levels are shown with normalization to GAPDH. Experiments were performed 3 times. i. Diagram depicting the screen strategy for identifying culture conditions for porcine pluripotent stem cells using the Dox-dependent iPSC. Small molecule inhibitors and cytokines were selected for various combinations. Cell survival, cell morphology, and expression of endogenous OCT4 and NANOG were employed as the read-outs. j. Images of OCT4-Tdtomato reporter (POT) iPSCs in pEPSCM without Dox. In all RT-qPCR analysis, n=3 independent experiments. All graphs represent the mean ± s.d. P values were computed using a two-tailed t-test. For c, f and j, the experiments were repeated independently three times with similar results. Source data are provided in Supplementary Table 1. Scale bars, 100 μm.
Figure 2
Figure 2. Derivation of porcine EPSCs.
a. Left: Schematic diagram of establishment of the pig (Sus Scrofa) EPSCEmb lines from German Landrace day-5 in vivo derived blastocysts on STO feeder cells in pEPSCM, and of pEPSCiPS lines by reprogramming German Landrace PFFs and China TAIHU OCT4-Tdtomato knock-in reporter (POT) PFFs. Right panels: images of established EPSC lines, and a fluorescence image of Td-tomato expression in POT-pEPSCiPS. Three EPSCEmb lines (Male: K3 and K5; Female K1) and two pEPSCiPS lines (#10, #11) were extensively tested in this study. These EPSC lines behaved similarly in gene expression and differentiation. b. Immunostaining detection of pluripotency factors and markers, SSEA-1 and SSEA-4, in pEPSCEmb and pEPSCiPS. c. Bisulphite sequencing analysis of CpG sites in the OCT4 and NANOG promoter regions in PFFs, pEPSCiPS and pEPSCEmb. d. Gene expression in embryoid bodies (EBs, day 7) of pEPSCsEmb. Expression of genes of embryonic and extra-embryonic cell lineages were assessed by RT-qPCR. Relative expression levels were normalized against GAPDH. n=3 independent experiments. Data are mean ± s.d. P values were calculated using a two-tailed t-test. Statistical source data are provided in Supplementary table 10. e. Tissue composition of pEPSCEmb teratoma sections (H&E staining): Examples of glandular epithelium derived from endoderm (i), cartilage derived from mesoderm (ii), immature neural tissue derived from ectoderm, which forms neuroepithelial structures (iii), and large multinucleated cells reminiscent of trophoblasts (arrows in iv). f. PL-1, KRT7 and SDC1 positive cells in pEPSCEmb teratoma sections as revealed by immunostaining. g. Detection of pEPSC descendants in the brain (H2BmCherry+SOX2+) and the liver (H2BmCherry+AFP+) in chimera #16. H2B-mCherry and SOX2 are nuclear localised whereas AFP is a cytoplasmic protein. Boxed areas are shown in higher magnification. Arrows indicate representative cells that were donor cell descendants (mCherry+). DAPI stained nuclei. Additional chimera analyses are presented in Extended Data Fig. 3e-3f. For a-b and e-g, the experiments were repeated independently three times with similar results. Scale bars, 100 μm.
Figure 3
Figure 3. In vitro generation of PGC-like cells from pEPSCsEmb.
a. Induction of pPGCLC by transiently expressing SOX17 in NANOS3-H2BmCherry reporter pEPSCs. The presence of H2BmCherry+TNAP+ cells in embryoid bodies (EBs) was analysed by FACS. The experiments were repeated independently three times with similar results. b. RT-qPCR analysis of PGC genes in day 3 EBs following pPGCLC induction. Relative expression levels werenormalized against GAPDH. n=3 independent experiments. Data are mean ± s.d. P values were calculated using a two-tailed t-test. Statistical source data are provided in Supplementary table 10. c. Immunofluorescence analysis of PGC factors in the sections of EBs at day 3-4 following pPGCLC induction. The H2BmCherry+ cells co-expressed NANOG, OCT4, BLIMP1, TFAP2C and SOX17. DAPI stained nuclei. Experiments were performed three times. d. RNAseq analysis (Heat map) of sorted H2BmCherry+ of pPGCLC induction shows expression of genes associated with PGCs, pluripotency or somatic lineages (mesoderm, endoderm, and gonadal somatic cells). e. Pair-wise gene expression comparison between pEPSCsEmb and pPGCLCs. Key up-regulated (red) and down-regulated (blue) genes are highlighted. f. Bar plot shows expression of genes related to DNA methylation in pPGCLCs and the parental pEPSCsEmb. Data were from RNAseq of sorted H2BmCherry+ of pPGCLC induction. Scale bars, 100 μm.
Figure 4
Figure 4. Establishment of human EPSCs.
a. Images of the established H1-EPSCs or M1-EPSCs (passage 25). The experiments were repeated independently three times with similar results. b. Expression of pluripotency genes in H1-ESCs, H1-naïve ESCs (5i), H1-EPSCs and iPSC-EPSCs. Data are mean ± s.d. (n = 3). P values were computed for two-tailed t-test. c. EBs of H1-EPSCs to PGCLCs immunostained for SOX17, BLIMP1 and OCT4. Scale bar: 100 μm. d. Hierarchical clustering of gene expression (bulk RNAseq) of EPSCs, and other human pluripotent stem cells. Correlation matrix was clustered using Spearman correlation and complete linkage. Data sets are: pEPSCPar: porcine parthenogenetic EPSCs. E14 and AB2-EPSCs: mouse EPSCs (ref. 1); Human primed ESCs (WIBR1, iPS_NPC_4 and iPS_NPC_13) and naïve ESCs (WIBR2, WIBR3_cl_12, WIBR3_cl_16, WIN1_1 and WIN1_2) (Ref. and 35); Human primed H1 ES cell (H1-rep1 and H1-rep2) and extended pluripotent stem (EPS) cells (H1_EPS_rep1, H1_EPS_rep2, ES1_EPS_rep1 and ES1_EPS_rep2) (ref. 36). e. Principal component analysis (PCA) of bulk RNA-seq data of EPSCs, human primed and naïve ESCs, and PFFs. Human naïve (n=5), human primed (n=3), H1-EPSC (n=2), hiPSC-EPSC (n=2), pEPSCEmb (n=2), pEPSCiPS (n=2), pEPSCPar (n=2), PFF (n=2), E14_EPSC (n=2) and AB2_EPSC (n=1). n= biologically independent experiments. f. Pair-wise comparison of gene expression between H1-ESCs and H1-EPSCs, showing the highly expressed genes (>8 folds) in hEPSCs (total 76, red dots) and representative histone genes (blue dots). g. Heatmap showing expression of selected histone genes in human ESCs, EPSCs and preimplantation embryos. RNAseq data of human ESCs were from ref. , whereas embryo cell data were from ref. . h. RT-qPCR analysis of four histone 1 cluster genes in seven human ESC or iPSC lines cultured under three conditions. hiPSC lines were from the HIPSC project (http://www.hipsci.org): #1, HPSI1113i-bima_1; #2, HPSI1113i-qolg_3; #3, HPSI1113i-oaaz_2; #4, HPSI1113i-uofv_1. Relative expression levels are shown with normalization to GAPDH. n = 3 independent experiments. Data are mean ± s.d. *P <0.01 compared with the FGF condition cultured cells. #P <0.01 compared with 5i condition cultured cells. Experiments were performed three times. Statistical source data and precise P values are provided in Supplementary table 10.
Figure 5
Figure 5. Molecular features of porcine and human EPSC.
a. Violin plots show the distribution and the probability density the scRNAseq expression of pluripotency genes in pEPSCsEmb (top panel, n=150) and human H1-EPSCs (lower panel, n=96). n represents the number of cells in each plot. b. PCA of global gene expression pattern (by scRNAseq) of pEPSCsEmb (left panel, n=150) and H1-EPSCs (right panel, n=96). n represents the number of cells in each plot. c. PCA and comparison of gene expression assessed by scRNAseq of human H1-EPSCs and human preimplantation embryos (ref. 39). H1-EPSCs (n=96), oocyte (n=3), zygote (n=3), 2 cell (n=6), 4 cell (n=12), 8 cell (n=20), morulae (n=16), Late blastocyst (n=30). d. ChIP-seq analysis of H3K27me3 and H3K4me3 marks at pluripotency gene loci in pEPSCsEmb and human H1-EPSCs. e. Histone modifications (H3K4me3 and H3K27me3) at the loci for genes encoding enzymes involved in DNA methylation and demethylation and for cell lineage genes. For d and e, experiments were performed three times with similar results.
Figure 6
Figure 6. The requirement of individual components in EPSCM.
a-b. Gene expression in pEPSCsEmb (a) and H1-EPSCs (b) analysed by RT-qPCR. “-SRCi, -XAV939, -ACTIVIN, -Vc, -CHIR99”: removing individually; “+TGFBi, +H-CHIR99, +PD03”: adding SB431542, 3.0 μM CHIR99021, or MEK1/2 inhibitor PD0325901, respectively. “WH04/A419”: replacing A419259 with another SRC inhibitor, “WH-4-23. +L-CHIR99”: 0.2 μM in hEPSCM. Porcine and human EPSC media contain 0.2 μM and 1.0 μM CHIR99021, respectively. Red triangle: no cell survived. c. Targeting the H2B-Venus cassette to the OCT4 last coding exon in H1-EPSCs with the stop codon TGA being deleted. Five of 19 colonies genotyped were correctly targeted. d. The effects of removing WH-4-023 (-SRCi) or XAV939 (-XAV) for 7 days assessed by Venus+ reporter by fluorescence microscopy and flow cytometry. e. Western blot analysis of AXIN1 and phosphorylation of SMAD2/3 in EPSCs. EPSCs had higher levels of AXIN1 and pSMAD2/3 (for TGFβ signalling) than the differentiated (D) EPSCEmb or primed H1-ESCs. f. TOPflash analysis for canonical Wnt signalling activity in EPSCs. Removing XAV939 (pEPSCM-X and hEPSCM-X) for 5 days increased TOPflash activity. g. Bright-field and immunofluorescence images showing pEPSCsEmb cultured with the indicated changes in medium component. Cells were stained for OCT4 and DAPI. h-i. Quantitation of AP+ colonies formed from 2,000 pEPSCsEmb (h) or H1-EPSCs (i) cultured on STO feeders with different medium components. The colonies were scored for 5 consecutive passages. -ROCKi: passaging EPSCs without the ROCK inhibitor Y27632. j-k. RT-qPCR analysis of the expression of lineage genes in pEPSCsEmb (j) or hEPSCs (k) following removal of XAV939 or ACTIVIN A, inhibition of TGFβ signalling by SB431542, or treatment with 3.0 μM CHIR99021. l. The effects of supplementing 5.0 ng/ml ACTIVIN A on gene expression in EBs generated from H1-EPSCs. m-n. Effects of 5.0ng/ml ACTIVIN A on PGCLC (Tdtomato+) production from the NANOS3-Tdtomato reporter EPSCs assessed by FACS (m) and RT-qPCR (n). Relative expression levels were normalized to GAPDH. All graphs represent the mean ± s.d. For a-b, j-l and n, n = 3 independent experiments. For f, h-i and m, n = 4 independent experiments. For d-e and g, the experiments were repeated independently three times with similar results. P values were computed by two-tailed t-test. Statistical source data are presented in Supplementary table 10. Scale bars: 100 μm.
Figure 7
Figure 7. Trophoblast differentiation potential of hEPSCs.
a. Left panel: differentiation of hEPSCs to trophoblasts under TGFβ inhibition. Right panel: flow cytometry analysis of trophoblast differentiation of CDX2-H2B-Venus reporter EPSCs, collected 4 days after TGFβ inhibition. The CDX2-H2B-Venus reporter EPSCs were also cultured in conventional FGF-containing hESCs medium or 5i-naïve medium and differentiated under TGFβ inhibition and examined by flow cytometry. The experiments were repeated independently three times with similar results. b. The dynamic changes in the expression of trophoblast genes during hEPSC differentiation (sampled at 2-day intervals for 12days) were assayed by RT-qPCR. Relative expression levels were normalized against GAPDH. n = 3 independent experiments. Data are mean ± s.d. *P <0.01 compared with H1-ESC cells. #P <0.01 compared with H1-5i cells. The precise P values are presented in Supplementary table 10. c. tSNE analysis of RNA-seq data of the differentiating human ESCs (n = 2) and iPSC-EPSCs (n = 4) treated with TGFβ inhibitor SB431542. RNAs were sampled from cells at Day 0-12 of differentiation. The of H1-EPSCs and hiPSC-EPSCs showed different trajectory of differentiation from H1-ESCs. d. Heatmap shows changes in the expression of trophoblast-specific genes in differentiating H1-ESCs (green), H1-EPSCs (red) and iPSC-EPSCs (blue) collected at several time points of culture for RNAseq analysis. e. DNA demethylation at the promoter region of the ELF5 locus in differentiating H1-EPSCs and other cell types following 6 days of SB431542 treatment. Cells from H1-ESCs, H1-naïve ESCs (5i) showed no discernible DNA demethylation at the ELF5 promoter. f. Secreted hormones from trophoblasts derived from H1-EPSCs induced by TGFβ inhibition (SB431542). VEGF, PLGF, sFlt-1and sEng were measured in the conditioned media for culturing the differentiating EPSCs or ESCs for 16 days following a 48-h SB431542 treatment. g. hCG produced by trophoblasts from SB431542-treated EPSCs or ESCs at day 10 of differentiation, measured by ELISA. n = 4 independent experiments. Data are mean ± s.d. P values were calculated using a two-tailed t-test. Statistical source data are presented in Supplementary table 10.
Figure 8
Figure 8. Derivation of trophoblast stem cell-like cells from hEPSCs.
a. Phase-contrast images of primary TSC colonies formed from individual hEPSCs (left) and of TSCs at passage 7 (right). b. Expression of trophoblast markers GATA3, TFAP2C and KRT7 in EPSC-TSCs detected by immunostaining. Nuclei were stained with DAPI. Similar results were obtained with four independent EPSC-TSC lines. c. RT-qPCR analysis of pluripotency and TSC genes in four EPSC-derived TSC lines and their parental hEPSCs. JEG3 and JAR are trophoblast cell lines. n = 3 independent experiments. Data are mean ± s.d.. *p < 0.01 compared to TSCs. The precise P values are presented in Supplementary table 10. d. PCA of gene expression of hTSCs (n = 3) and of cells differentiated from human EPSCs (n = 2) under TGFβ inhibition at several time points. hTSCs showed enriched transcriptomic features of day-4 differentiated EPSCs. e. Immunostaining of SDC1 and CGB in hTSC-dervied syncytiotrophoblasts. DAPI stained the nucleus. f. Phase-contrast and Hoechst staining images of multinucleated hTSC-derived syncytiotrophoblasts. g. The fusion index of forming syncytiotrophoblasts from hTSCs calculated as the number of nuclei in syncytia/total number of nuclei. n = 4 independent experiments. Data are mean ± s.d. h. RT-qPCR analysis of trophoblast-specific genes in syncytiotrophoblast (ST) and extravillous trophoblast (EVT) derived from three hTSC lines. Expression levels were normalized against GAPDH. n = 3 independent experiments. Data are mean ± s.d. i. Flow cytometry detection of HLA-ABC and HLA-G in hESCs, hEPSCs, hTSCs, and hTSC-derived EVT cells (protocol of ref. 46). The choriocarcinoma cells JEG-3 and JAR represent the extravillous and villous trophoblast cells, respectively. JEG-3 cells expressed HLA-G, HLA-C and HLA-E, but not JAR cells. j. H&E staining of lesions formed by hTSCs engrafted subcutaneously in NOD-SCID mice. k. Confocal images of immunostaining for SDC1- or KRT7-positive cells in hTSC-derived lesions. DAPI stained the nucleus. l. Serum hCG levels in six NOD-SCID mice 7 days after hTSC engraftment (n = 3) or injection of vehicle only (n = 3). For a-b, e-f and h-l, the experiments were repeated independently three times with similar results. Statistical source data are presented in Supplementary table 10. Scale bars: 100 μm.

Comment in

  • A boost towards totipotency for stem cells.
    Etoc F, Brivanlou A. Etoc F, et al. Nat Cell Biol. 2019 Jun;21(6):671-673. doi: 10.1038/s41556-019-0340-3. Nat Cell Biol. 2019. PMID: 31160707 No abstract available.
  • Stem cells with potential.
    Vogt N. Vogt N. Nat Methods. 2019 Jul;16(7):578. doi: 10.1038/s41592-019-0487-7. Nat Methods. 2019. PMID: 31249416 No abstract available.
  • Modeling the Placenta with Stem Cells.
    Ezashi T, Schust DJ, Schulz LC. Ezashi T, et al. N Engl J Med. 2019 Oct 24;381(17):1681-1683. doi: 10.1056/NEJMcibr1907773. N Engl J Med. 2019. PMID: 31644851 No abstract available.

Similar articles

Cited by

References

    1. Yang J, et al. Establishment of mouse expanded potential stem cells. Nature. 2017;550:393–397. doi: 10.1038/nature24052. - DOI - PMC - PubMed
    1. Evans MJ, Kaufman MH. Establishment in culture of pluripotential cells from mouse embryos. Nature. 1981;292:154–156. - PubMed
    1. Martin GR. Isolation of a pluripotent cell line from early mouse embryos cultured in medium conditioned by teratocarcinoma stem cells. Proceedings of the National Academy of Sciences of the United States of America. 1981;78:7634–7638. - PMC - PubMed
    1. Thomson JA, et al. Embryonic stem cell lines derived from human blastocysts. Science. 1998;282:1145–1147. - PubMed
    1. Ying QL, et al. The ground state of embryonic stem cell self-renewal. Nature. 2008;453:519–523. doi: 10.1038/nature06968. - DOI - PMC - PubMed

Publication types