. 2019 Jul 2;30(1):174-189.e5.
doi: 10.1016/j.cmet.2019.05.005. Epub 2019 May 30.

A PRDM16-Driven Metabolic Signal from Adipocytes Regulates Precursor Cell Fate

Affiliations

A PRDM16-Driven Metabolic Signal from Adipocytes Regulates Precursor Cell Fate

Wenshan Wang et al. Cell Metab. .

Abstract

The precursor cells for metabolically beneficial beige adipocytes can alternatively become fibrogenic and contribute to adipose fibrosis. We found that cold exposure or β3-adrenergic agonist treatment of mice decreased the fibrogenic profile of precursor cells and stimulated beige adipocyte differentiation. This fibrogenic-to-adipogenic transition was impaired in aged animals, correlating with reduced adipocyte expression of the transcription factor PRDM16. Genetic loss of Prdm16 mimicked the effect of aging in promoting fibrosis, whereas increasing PRDM16 in aged mice decreased fibrosis and restored beige adipose development. PRDM16-expressing adipose cells secreted the metabolite β-hydroxybutyrate (BHB), which blocked precursor fibrogenesis and facilitated beige adipogenesis. BHB catabolism in precursor cells, mediated by BDH1, was required for beige fat differentiation in vivo. Finally, dietary BHB supplementation in aged animals reduced adipose fibrosis and promoted beige fat formation. Together, our results demonstrate that adipocytes secrete a metabolite signal that controls beige fat remodeling.

Keywords: BDH1; PRDM16; UCP1; adipose fibrosis; beige fat; beta hydroxybutyrate; brown fat; fibro-adipogenic progenitor.


Conflict of interest statement

Declaration of Interests

The authors declare no competing interests.

Figures
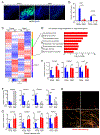
Fig.1
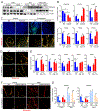
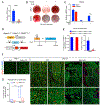
Fig.1. Cold/β3-agonism induces a fibrogenic-to-adipogenic phenotypic shift in adipose stromal cells
(A-E) Young (2-month-old) and aged (12-month-old) mice were acclimated to thermoneutrality and treated with vehicle or CL for 4 days to induce beiging. (A) Immunofluorescence staining for UCP1 (green) in iWAT. Nuclei (DAPI, blue); scale bar, 1 mm. (B) Relative mRNA levels of brown fat marker genes Ucp1 and Cidea. n=4 mice per group. (C) Heat map of gene expression profiles comparing iWAT from young and aged mice, treated with vehicle or CL. (D) Gene ontology (GO) and pathway analysis of a gene cluster downregulated by CL selectively in young vs. aged mice (red cluster, panel C). KG, KEGG Pathway; MF, Molecular Function; BP, Biological Process; CC, Cellular Component. (E) Relative mRNA levels by RT-qPCR of fibrosis marker genes in iWAT. n=4 mice per group. (F) Relative mRNA levels of fibrosis marker genes in stromal vascular cells (SVC) and mature adipocytes from young mice housed at thermoneutrality or exposed to 4°C for 1 week. n=3 mice per group. (G) Relative mRNA levels of fibrosis marker genes in SVC from young and aged mice housed at thermoneutrality and treated with vehicle or CL for 4 days. n=3 mice per group. (H) Picrosirius red staining of collagen fibers in iWAT from young and aged mice treated with vehicle (Ctl) or CL. Scale bar, 50 μM. All data presented as mean ± s.e.m; *p<0.05, ** p<0.01, ***p<0.001 as analyzed by two-tailed Student’s t-test.
Fig.2
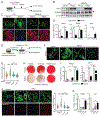
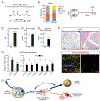
Fig.2. PRDM16 promotes a fibrogenic-to-adipogenic cell fate shift during WAT beiging
(A) Western blot analysis of PRDM16, PPARγ, and α-Actin protein levels in whole iWAT (left) or in isolated adipocytes and stromal-vascular cells (SVC) from iWAT of young and aged mice acclimated to thermoneutrality. (B,C) Wildtype (Wt) and Prdm16+/− mutant mice were housed at thermoneutrality and treated with vehicle (Control) or CL for 4 days. n=3-4 mice per group. (B) Relative mRNA levels of Prdm16 and fibrosis marker genes in iWAT. (C) UCP1 immunofluorescence (top) and Picrosirius red staining of collagen fibers (bottom) in iWAT. Scale bar, 50 μM. (D,E) Thermoneutral-acclimated wildtype (Wt) and adipocyte-selective Prdm16-knockout (AdipoqCrePrdm16-KO) mice were treated with vehicle control or CL for 4 days. n=3-4 mice per group. (D) Picrosirius red staining of collagen fibers in iWAT. Scale bar, 50 μM. (E) Relative mRNA levels of fibrosis marker genes in iWAT. (F,G) young (2-month-old) and aged (12-month-old) wildtype (Ctl) and Fabp4-Prdm16 mice were acclimated to thermoneutrality and treated with CL for 4 days. n=3-5 mice per group. (F) Picrosirius red staining of collagen fibers. Scale bar, 50 μM. (G) Relative mRNA levels of fibrosis marker genes in iWAT. All data presented as mean ± s.e.m; * p<0.05, ** p<0.01, ***p<0.001 as analyzed by two-tailed Student’s t-test.
Fig.3
Fig.3. Adipocyte PRDM16 controls precursor fate through a paracrine pathway
(A-D) iWAT precursor cells were transduced with control (CTL) or PRDM16-expressing retrovirus and treated with either vehicle control (CTL) or DMOG. After 2 days, cells were immunostained for ACTA2 or induced to differentiate into adipocytes for 5 days. (A) Experimental schema. (B) Western blot analysis of HIF1α, PRDM16 and α-Actin protein levels. (C) ACTA2 immunostaining (green) (top panel) and LipidTOX staining (red) of lipid droplets in differentiated adipocytes (bottom panel). Scale bar, 100 μM (top); 200 μM (bottom). (D) Relative mRNA levels of adipocyte genes. n=3 per group. (E-K) iWAT precursor cells were treated with: (1) control medium (DMEM), conditioned medium (CM) from GFP-expressing adipocytes (GFP-CM), or CM from PRDM16-expressing adipocytes (P-CM); and (2) vehicle, DMOG or recombinant TGFβ. After 24 h, cultures were immunostained for ACTA2 or induced to differentiate into adipocytes for 5 days. (E) Experimental schema. (F) ACTA2 immunostaining (green). Scale bar, 100 μm. (G) Violin plots showing relative fluorescent intensity per cell in indicated groups. The white solid boxes represent percentiles (bottom of box = 25th, horizontal line =50th, top of box = 75th). n=50-80 cells per condition. (H) Oil-Red-O staining (red) of adipocyte lipid droplets. (I) Relative mRNA levels of adipocyte markers in cultures from (H). n=3-5 per group. (J) ACTA2 immunostaining (top; green) and LipidTOX staining (bottom; red) of adipocyte lipid droplets in cultures treated with indicated CM and either vehicle or TGFβ. Scale bar, 100 μm. Violin plots showing relative fluorescent intensity per cell (right). (K) Relative mRNA levels of adipocyte marker genes in cultures from (J). n=3-5 per group. All data presented as mean ± sem. Analysis by two-way ANOVA with Tukey correction.
Fig.4
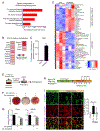
Fig.4. PRDM16-driven FAO is required for the production of paracrine effectors
(A) Gene Set Enrichment Analysis (GSEA) of genes upregulated in PRDM16-expressing vs. control cells. Enriched pathways were defined by a normalized enrichment score > 1.3 and FDR < 0.05. (B) Expression heat map of “fatty acid oxidation (FAO) and ketone body metabolism” genes in PRDM16-expressing vs. control cells. (C) Quantification of FAO. Adipocytes were cultured in medium containing U-13C-palmitate for 6 h prior to metabolite analysis by LC-MS. Relative molar quantity of 13C2-labeled acetyl-CoA in GFP- and PRDM16-expressing adipocytes was calculated by multiplying % molar enrichment of 13C2-labeled acetyl-CoA by relative total acetyl-CoA quantitation. n=3-4 per group. (D) Heat map showing standardized amounts of indicated metabolites in GFP- and PRDM16-expressing adipocytes, across samples (Z score). n=3 per group (E-G) PRDM16-expressing adipocytes (donor) were treated with vehicle or Etomoxir (Eto) for 24 hr prior to collecting conditioned medium (CM). HIF1α-expressing (DMOG-treated) precursors were treated with CM and induced to undergo adipocyte differentiation. To control for effects of Eto carried over in CM, a subset of recipient cells were directly exposed to Eto [Eto(recipient)] by mixing Eto with P-CM prior to treatment. (E) Experimental schema (F) Oil-Red-O staining of cultures after adipogenic induction. (G) Relative mRNA levels of adipocyte genes in cultures from (F). n=4-5 per group. (H,I) AdipoChaser (AdipoqrtTA;TRECre;Rosa26mTmG) mice were pulse labelled by feeding them with doxycyxline (dox) chow (600 mg/kg) for 9 days. During the 3-day washout period, mice were treated with Eto or vehicle for 3 days, followed by treatment with CL and either Eto or vehicle for another 4 days (chase). (I) Immunofluorescence staining of PLIN1 (red) in adipocytes and GFP reporter (green). Quantification of adipogenesis (% GFP (−)/total PLIN1+ cells) (right). All data presented as mean ± s.e.m; * p <0.05, **p<0.01, ***p < 0.001 as analyzed by two-tailed Student’s t-test.
Fig.5
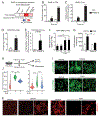
Fig.5. PRDM16 drives the production of β-hydroxybutyrate (BHB), which suppresses fibrogenesis
(A) BHB concentration in control (GFP) and adipocyte conditioned medium in the presence or absence of Eto-treatment, as determined by LC-MS. (B) Absolute quantity of BHB in GFP-CM and P-CM collected at 1h and 6h time points. n=4 per group. (C) Relative quantity of HMG-CoA in GFP- and PRDM16-expressing adipocytes at 1h and 6h time points. AUC, area under the curve. AUC for HMG-CoA was normalized to 13C315N1HMG-CoA internal standard (STD) and total protein in each sample. n = 4 per group. (D) BHB efflux rate in GFP- and PRDM16-expressing adipocytes. n=4 per group. (E) GFP- and PRDM16-expressing adipocytes were incubated with 13C-palmitate. The absolute amount of 13C-labeled BHB in CM was measured at 1h and 6h time points. n=4 per group (F) Relative BHB levels in iWAT from mice housed at thermoneutrality or exposed to 5°C cold for indicated times. n=5 per group. (G) BHB levels in IWAT of wildtype (wt) control and Prdm16+/− mice housed at thermoneutrality or exposed to cold for 8 d. n= 3-6 per group. (H-K) Adipose precursors were treated with: (1) vehicle or BHB (250 μM); and (2) vehicle, DMOG, or TGFβ. After 2 days, cells were either immunostained for ACTA2 or induced to differentiate into adipocytes for 5 days. (H) Experimental schema. (I) Immunofluorescence staining of ACTA2. Scale bar, 100 μM. (J) Violin plots showing relative fluorescent intensity per cell in indicated groups. The white solid boxes represent percentiles (bottom of box = 25th, horizontal line =50th, top of box = 75th). n=50-80 cells per condition. (K) LipidTOX staining of adipocyte lipid droplets. Scale bar, 200 μM.
Fig. 6
Fig. 6. BHB-catabolism regulates adipose precursor differentiation
(A-C) iWAT precursor cells were transduced with scramble (shScr) or Bdh1 shRNA lentivirus and treated with vehicle control (CTL), DMOG alone or DMOG plus BHB. After 2 days, cells were induced to differentiate into adipocytes for 5 days. (A) Relative mRNA levels of Bdh1 in iWAT precursor cells. n=4 per group (B) Oil-Red-O staining (red) of lipid droplets in differentiated adipocytes. (C) Relative mRNA levels of adipogenic genes in differentiated adipocytes. n=4 per group. (D-G) Bdh1 KO (PdgfraCreERT2; Bdh1flox/flox; R26RtdTomato) and sibling/age-matched control (ctrl; PdgfraCreERT2; Bdh1+/+; R26RtdTomato or PdgfraCreERT2; Bdh1flox/+; R26RtdTomato) mice were treated with tamoxifen for 4 days. iWAT was analyzed from mice at day 0 (pulse) and following 2-week cold exposure to induce beiging (day 23). (D) Experimental schema. (E) Flow cytometry analysis showing proportion of PDGFRα+ cells expressing tdTomato in ctrl and Bdh1 KO iWAT (left). Relative mRNA levels of Bdh1 in tdTomato+; PDGFRα+ cells in ctrl and Bdh1 KO iWAT of (right). n=3 mice per group. (F) Immunofluorescence staining of tdTomato (red), and PLIN1 (green) in iWAT. Scale bar, 200 μM. (G) Quantification of adipogenesis (% tdTomato+; PLIN1+/total tdTomato+ cells). n=30 randomly chosen 20X magnification fields from 3 mice per group. All data presented as mean ± s.e.m; * p <0.05, **p<0.01, ***p < 0.001 as analyzed by two-tailed Student’s t-test.
Fig. 7
Fig. 7. Raising BHB levels in aged mice alleviates adipose fibrosis and restores beige adipogenic potential.
(A) Metabolism of the ketone ester (R-1,3-hydroxybutyl R-3-hydroxybutyrate) (KE) in the gut and liver to form BHB. (B) Composition of control (CTL) and 6% KE diet (left) and schema of experiment (right). Aged (12-month-old) mice were fed with CTL or KE diet for 1 month at room temperature and then switched to 4°C cold for 4 days. (C-E) Plasma BHB levels (C), body weight (D), and plasma glucose levels (E) of experimental mice. n=10 for control diet group; n=8 for KE diet group. (F) Hematoxylin & Eosin (H&E) staining (top) and Picrosirius red staining (bottom)of iWAT from mice described above (B). Scale bar, 50 μM. (G) Relative mRNA levels of thermogenic and fibrosis marker genes in iWAT. All data presented as mean ± sem; *p< 0.05, **p<0.01, ***p<0.001 as analyzed by two-tailed Student’s t-test.

Similar articles

Cited by

References

    1. Adijanto J, Du J, Moffat C, Seifert EL, Hurle JB, and Philp NJ (2014). The retinal pigment epithelium utilizes fatty acids for ketogenesis. J Biol Chem 289, 20570–20582. - PMC - PubMed
    1. Auestad N, Korsak RA, Morrow JW, and Edmond J (1991). Fatty acid oxidation and ketogenesis by astrocytes in primary culture. Journal of neurochemistry 56, 1376–1386. - PubMed
    1. Berry DC, Jiang Y, Arpke RW, Close EL, Uchida A, Reading D, Berglund ED, Kyba M, and Graff JM (2017). Cellular Aging Contributes to Failure of Cold-Induced Beige Adipocyte Formation in Old Mice and Humans. Cell Metab 25, 166–181. - PMC - PubMed
    1. Berry DC, Jiang Y, and Graff JM (2016). Mouse strains to study cold-inducible beige progenitors and beige adipocyte formation and function. Nat Commun 7, 10184. - PMC - PubMed
    1. Blazquez C, Sanchez C, Velasco G, and Guzman M (1998). Role of carnitine palmitoyltransferase I in the control of ketogenesis in primary cultures of rat astrocytes. Journal of neurochemistry 71, 1597–1606. - PubMed

Publication types