

Knockdown of spliceosome U2AF1 significantly inhibits the development of human erythroid cells
- PMID: 31144421
- PMCID: PMC6652819
- DOI: 10.1111/jcmm.14370
Knockdown of spliceosome U2AF1 significantly inhibits the development of human erythroid cells
Abstract
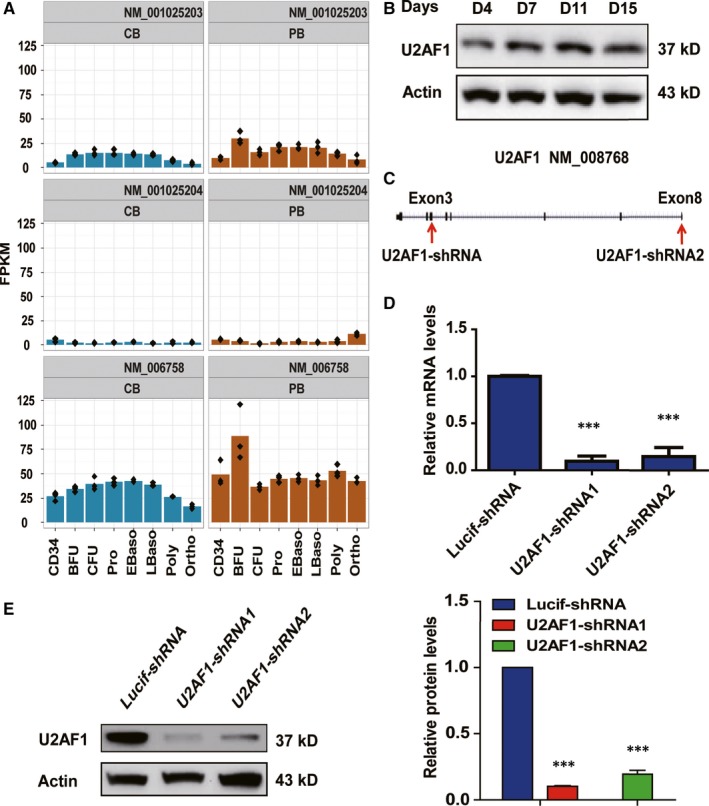
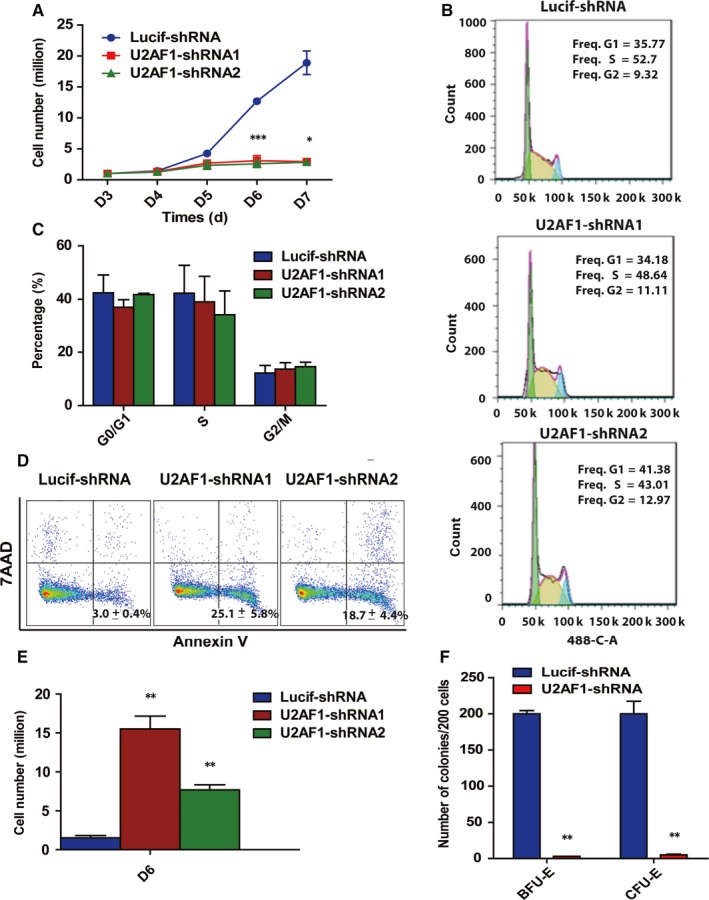
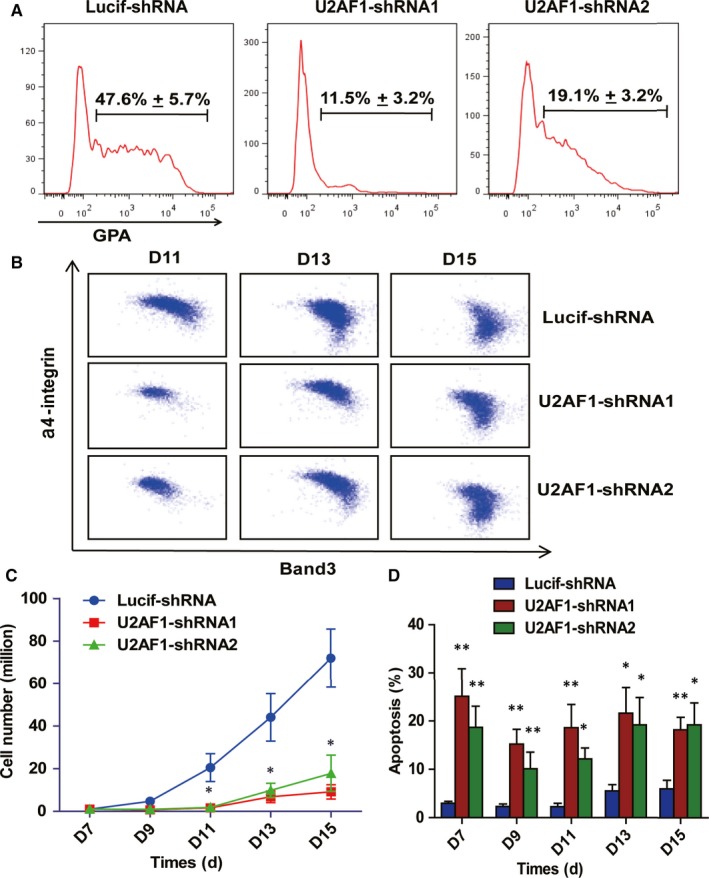
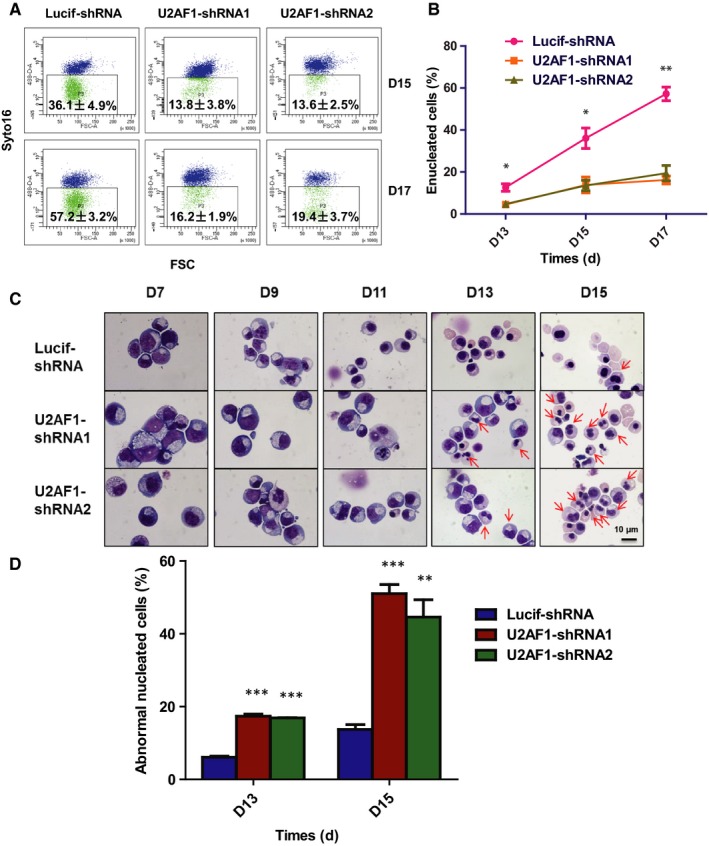
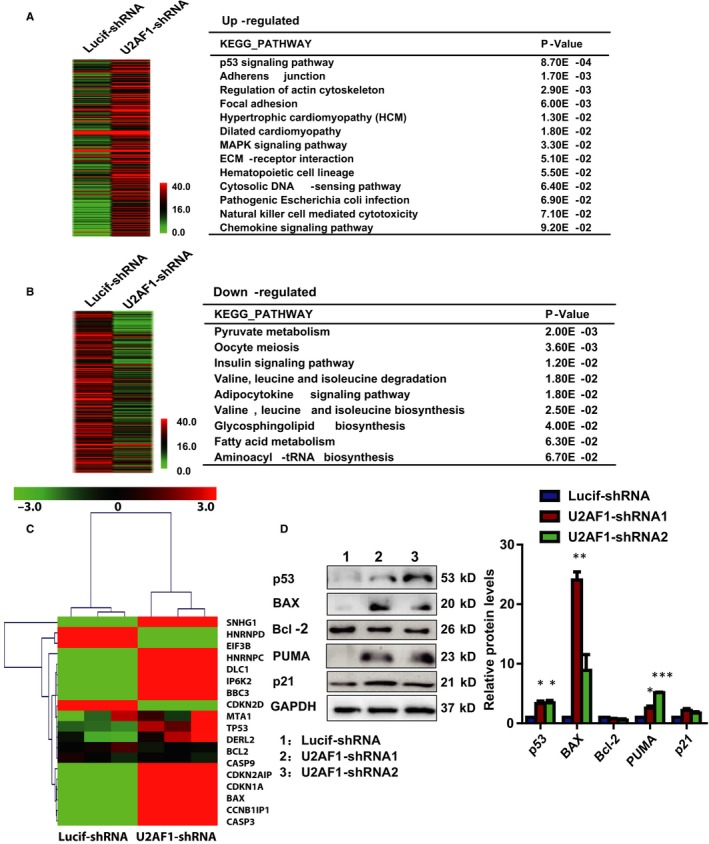
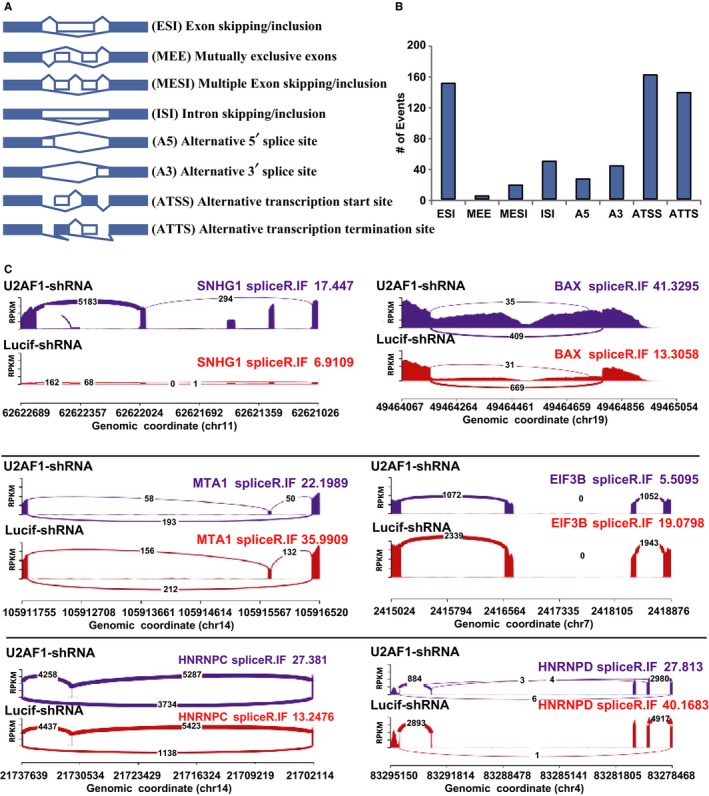
U2AF1 (U2AF35) is the small subunit of the U2 auxiliary factor (U2AF) that constitutes the U2 snRNP (small nuclear ribonucleoproteins) of the spliceosome. Here, we examined the function of U2AF1 in human erythropoiesis. First, we examined the expression of U2AF1 during in vitro human erythropoiesis and showed that U2AF1 was highly expressed in the erythroid progenitor burst-forming-unit erythroid (BFU-E) cell stage. A colony assay revealed that U2AF1 knockdown cells failed to form BFU-E and colony-forming-unit erythroid (CFU-E) colonies. Our results further showed that knockdown of U2AF1 significantly inhibited cell growth and induced apoptosis in erythropoiesis. Additionally, knockdown of U2AF1 also delayed terminal erythroid differentiation. To explore the molecular basis of the impaired function of erythroid development, RNA-seq was performed and the Kyoto Encyclopedia of Genes and Genomes (KEGG) analysis results showed that several biological pathways, including the p53 signalling pathway, MAPK signalling pathway and haematopoietic cell lineage, were involved, with the p53 signalling pathway showing the greatest involvement. Western blot analysis revealed an increase in the protein levels of downstream targets of p53 following U2AF1 knockdown. The data further showed that depletion of U2AF1 altered alternatively spliced apoptosis-associated gene transcripts in CFU-E cells. Our findings elucidate the role of U2AF1 in human erythropoiesis and reveal the underlying mechanisms.
Keywords: U2AF1; erythropoiesis; spliceosome.
© 2019 The Authors. Journal of Cellular and Molecular Medicine published by John Wiley & Sons Ltd and Foundation for Cellular and Molecular Medicine.
Conflict of interest statement
The authors declare no conflict of interest.
Figures
Similar articles
-
SF3B1 deficiency impairs human erythropoiesis via activation of p53 pathway: implications for understanding of ineffective erythropoiesis in MDS.J Hematol Oncol. 2018 Feb 12;11(1):19. doi: 10.1186/s13045-018-0558-8. J Hematol Oncol. 2018. PMID: 29433555 Free PMC article.
-
Signaling pathways implicated in hematopoietic progenitor cell proliferation and differentiation.Exp Biol Med (Maywood). 2007 Jan;232(1):156-63. Exp Biol Med (Maywood). 2007. PMID: 17202596
-
ZFP36L2 is required for self-renewal of early burst-forming unit erythroid progenitors.Nature. 2013 Jul 4;499(7456):92-6. doi: 10.1038/nature12215. Epub 2013 Jun 9. Nature. 2013. PMID: 23748442 Free PMC article.
-
Tracking erythroid progenitor cells in times of need and times of plenty.Exp Hematol. 2016 Aug;44(8):653-63. doi: 10.1016/j.exphem.2015.10.007. Epub 2015 Dec 2. Exp Hematol. 2016. PMID: 26646992 Review.
-
Characterization, regulation, and targeting of erythroid progenitors in normal and disordered human erythropoiesis.Curr Opin Hematol. 2017 May;24(3):159-166. doi: 10.1097/MOH.0000000000000328. Curr Opin Hematol. 2017. PMID: 28099275 Free PMC article. Review.
Cited by
-
U2af1 is a haplo-essential gene required for hematopoietic cancer cell survival in mice.J Clin Invest. 2021 Nov 1;131(21):e141401. doi: 10.1172/JCI141401. J Clin Invest. 2021. PMID: 34546980 Free PMC article.
-
Post-transcriptional regulation of erythropoiesis.Blood Sci. 2023 Apr 26;5(3):150-159. doi: 10.1097/BS9.0000000000000159. eCollection 2023 Jul. Blood Sci. 2023. PMID: 37546708 Free PMC article. Review.
-
U2AF1 and EZH2 mutations are associated with nonimmune hemolytic anemia in myelodysplastic syndromes.Blood Adv. 2023 Jan 10;7(1):1-8. doi: 10.1182/bloodadvances.2022007504. Blood Adv. 2023. PMID: 36129843 Free PMC article.
-
Differential U2AF1 mutation sites, burden and co-mutation genes can predict prognosis in patients with myelodysplastic syndrome.Sci Rep. 2020 Oct 29;10(1):18622. doi: 10.1038/s41598-020-74744-z. Sci Rep. 2020. PMID: 33122737 Free PMC article.
References
-
- Gregory CJ, Eaves AC. Human marrow cells capable of erythropoietic differentiation in vitro: definition of three erythroid colony responses. Blood. 1977;49:855‐864. - PubMed
Publication types
MeSH terms
Substances
LinkOut - more resources
Full Text Sources
Research Materials
Miscellaneous
