. 2019 Jul 10;39(28):5481-5492.
doi: 10.1523/JNEUROSCI.0227-18.2019. Epub 2019 May 28.

Neural Stem Cells of the Subventricular Zone Contribute to Neuroprotection of the Corpus Callosum after Cuprizone-Induced Demyelination

Affiliations

Neural Stem Cells of the Subventricular Zone Contribute to Neuroprotection of the Corpus Callosum after Cuprizone-Induced Demyelination

Erica Butti et al. J Neurosci. .

Abstract

Myelin loss occurring in demyelinating diseases, including multiple sclerosis, is the leading cause of long-lasting neurological disability in adults. While endogenous remyelination, driven by resident oligodendrocyte precursor cells (OPCs), might partially compensate myelin loss in the early phases of demyelinating disorders, this spontaneous reparative potential fails at later stages. To investigate the cellular mechanisms sustaining endogenous remyelination in demyelinating disorders, we focused our attention on endogenous neural precursor cells (eNPCs) located within the subventricular zone (SVZ) since this latter area is considered one of the primary sources of new OPCs in the adult forebrain. First, we fate mapped SVZ-eNPCs in cuprizone-induced demyelination and found that SVZ endogenous neural stem/precursor cells are recruited during the remyelination phase to the corpus callosum (CC) and are capable of forming new oligodendrocytes. When we ablated SVZ-derived eNPCs during cuprizone-induced demyelination in female mice, the animals displayed reduced numbers of oligodendrocytes within the lesioned CC. Although this reduction in oligodendrocytes did not impact the ensuing remyelination, eNPC-ablated mice experienced increased axonal loss. Our results indicate that, in toxic models of demyelination, SVZ-derived eNPCs contribute to support axonal survival.SIGNIFICANCE STATEMENT One of the significant challenges in MS research is to understand the detrimental mechanisms leading to the failure of CNS tissue regeneration during disease progression. One possible explanation is the inability of recruited oligodendrocyte precursor cells (OPCs) to complete remyelination and to sustain axonal survival. The contribution of endogenous neural precursor cells (eNPCs) located in the subventricular zone (SVZ) to generate new OPCs in the lesion site has been debated. Using transgenic mice to fate map and to selectively kill SVZ-derived eNPCs in the cuprizone demyelination model, we observed migration of SVZ-eNPCs after injury and their contribution to oligodendrogenesis and axonal survival. We found that eNPCs are dispensable for remyelination but protect partially from increased axonal loss.

Keywords: ablation; cuprizone; multiple sclerosis; neural stem cells; sub ventricular zone; transgenic mice.


Figures

Figure 1.
Figure 1.
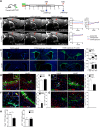
Cuprizone-induced demyelination in the corpus callosum. A, Experimental study design indicates the administration schedule of tamoxifen/oil via gavage and cuprizone diet, MRI analysis and tissue collection in Nestin:YFP mice. B, Analysis of CC damage by in vivo MRI. Representative sagittal T2-weighted images in mice treated either with a normal or cuprizone diet and treated with either oil or TAM via gavage. The graphs represent the quantification of the lesion of the CC by DTI (FA, MD, and //D). Arrows indicate the hyperintense demyelinating lesions occurring in the corpus callosum. n = 3 animals/group. C, Representative images and quantification of the mobilization of YFP+ cells in Nestin:YFP mice treated with cuprizone for 4 or 8 weeks at the level of the rostral and caudal CC considering the lateral and medial area. Shown are representative images: YFP+ cells are in green and nuclei stained by DAPI are in blue. n = 6 mice/group. D–G, Cell fate mapping of the differentiation fate of YFP+ cells during the remyelination at 8 weeks after cuprizone challenge, in the Nestin:YFP mouse: representative coronal sections and quantification, in the rostral and caudal regions of CC, of the differentiation of YFP+ cells (in green) either in astrocyte GFAP (red; D), in oligodendrocyte precursors Olig2 (red; E), in mature oligodendrocytes (APC; red; F), or in neurons (NeuN in red; G). Nuclei stained by DAPI are in blue. Data are expressed as the percentage of double-positive cells on the total of YFP+ cells. n = 6 pictures/6 mice/area. Cells indicated by arrows in D–F are double-positive cells and are magnified in the contoured inset; in F, the purple arrows indicate the DCX+ cells. H, Percentage of Olig2+ YFP+ cells on the total of Olig2+ and the percentage of APC+YFP+ cells on the total of APC+ cells in the rostral (white bar) and caudal (black bar) regions of CC. n = 6 pictures/6 mice/area. Each bar represents the mean ± SEM. *p ≤ 0.05; **p ≤ 0.01; ***p ≤ 0.001 (unpaired t test for D–F and H; one-way ANOVA followed by Bonferroni post hoc test for B and C). Scale bars: C, 200 μm; D–G, 50 μm.
Figure 2.
Figure 2.
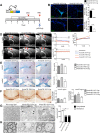
Demyelination after cuprizone treatment is unaltered after ablation of eNPCs. A, Experimental design: NestinTK+ mice or controls, NestinTK, were treated with either GCV or PBS during cuprizone-induced demyelination of the CC. MRI studies were performed at 4 and 6 weeks, and pathology was performed at 6 weeks of diet. B, C, Representative images and quantification of the ablation of eNPC after 4 weeks of GCV treatment in NestinTK+ mice at the sixth week of cuprizone treatment: neuroblasts were labeled for DCX in B, transient amplifying cells for BrdU in C. n = 3 mice/group. D, Analysis of CC damage by in vivo MRI. Representative brain sagittal T2-weighted images acquired on NestinTKGCV-Cup, NestinTK+PBS-Cup, and NestinTK+GCV-Cup mice at the fourth and sixth week of the cuprizone diet. Arrows indicate the demyelinating lesion of the corpus callosum that is quantified by the analysis of DTI parameters FA, MD, and //D in the graphs. n = 3 mice/group. E, Representative LFB-stained coronal brain sections at the level of the rostral and caudal CC of NestinTK and NestinTK+ mice treated either with PBS or GCV at the sixth week of the cuprizone diet; the demyelination damage is quantified in the graphs on the right. Arrows indicate the demyelinating lesion of the corpus callosum. n = 8 mice/group. 0 = complete myelination, 3 = complete demyelination. F, Representative brain sections of Bielschowsky staining are shown in the caudal region of CC in NestinTK and NestinTK+ mice treated with either PBS or GCV 2 weeks after the end of the cuprizone diet. The entity of axonal damage was evaluated in the rostral and caudal regions by Bielschowsky staining. n = 3 mice/group. G, Representative electron micrographs of the caudal CC of mice treated with the normal diet, of NestinTKGCV-Cup and NestinTK+GCV-Cup mice at the sixth week of the cuprizone diet. In the graph quantification of unmyelinated (in black) and myelinated (in white) axons in mice treated with the normal diet, NestinTKGCV-Cup and NestinTK+GCV-Cup mice are shown. Arrows indicate the remyelinated axons. n = 3 mice/group. H, High-magnification image of representative myelinated, unmyelinated, and remyelinated axons. Arrow indicates the demyelinated axon. ax, Axon. Each bar represents the mean ± SEM: *p ≤ 0.05; **p ≤ 0.01; ***p ≤ 0.001; ****p ≤ 0.0001. One-way ANOVA followed by Bonferroni post hoc test. Kruskal–Wallis test for nonparametric data in E. Scale bars: B, C, 50 μm; I, 100 μm; E, 200 μm; G, 2 μm; H, 1 μm.
Figure 3.
Figure 3.
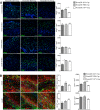
Effect of early eNPCs ablation on astrocytes, microglia and oligodendroglia. A, Representative images and quantification of oligodendrocyte precursors (Olig2+, in green) in the rostral and caudal regions of CC, at lateral and medial levels in NPC-ablated mice and controls at 6 weeks after the cuprizone diet. Graphs showing the number of Olig2+ cells. n = 6 mice/group. B, Representative images and quantification of astrocytes (GFAP, in red) and of microglia (Iba-1, in green) at the level of the rostral and caudal CC at 6 weeks after cuprizone treatment in NPC-ablated mice and controls. Graphs show the number of GFAP+ and Iba-1+ cells per area. n = 6 mice/group. Nuclei counterstained by DAPI are in blue. Each bar represents the mean ± SEM. *p ≤ 0.05; ***p ≤ 0.001; one-way ANOVA followed by Bonferroni post hoc test. Scale bar, 50 μm.
Figure 4.
Figure 4.
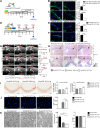
Delayed ablation of NPCs in cuprizone diet-treated mice to study remyelination. A, Experimental design to monitor the effective ablation of eNPCs using the NestinCreRT2YFP reporter mouse crossed with the NestinTK mouse, thus obtaining the Nestin:YFP-NestinTK mice. Mice were treated with tamoxifen by gavage for 4 d, and then the demyelination of the CC was induced by feeding for 6 weeks of the cuprizone diet. Mice were treated with GCV or PBS from the fourth week to the eighth week to ablate SVZ-eNPCs during the remyelination phase (late phase) and histology performed at the eighth week. B, C, Quantification of YFP+ cells (in green) in the rostral (B) and caudal (C) regions of the CC. n = 4 animals/group. D, Experimental design to ablate eNPCs using the NestinTK mouse in the remyelination phase. Mice were treated either with GCV or PBS from the fourth week to the eighth week to ablate SVZ-eNPCs during the remyelination phase (late phase). MRI was performed at 4, 6, and 8 weeks to monitor the CC damage, and histology was performed at the eighth week. E, F, Quantification of transit amplifying cells, labeled by BrdU (in green; E) and neuroblasts (DCX in green; F) in the SVZ of NestinTK+GCV mice and in control mice. n = 3–6 mice/group. G, Analysis of CC damage by MRI. Representative sagittal T2-weighted images acquired in vivo at the fourth, sixth, and eighth week. Arrows indicate the lesion of the corpus callosum and its evolution over time. Analysis of DTI parameters: fractional anisotropy, mean diffusivity, and axial diffusivity. n = 3 animals/group. H, Representative brain sections of Luxol fast blue (LFB) staining are shown in the rostral and caudal regions of CC in NestinTK and NestinTK+ mice treated with either PBS or GCV 2 weeks after the end of the cuprizone diet. The entity of demyelination was judged by scoring LFB. Arrows indicate the lesion of the corpus callosum. n = 8 mice/group. 0 = complete myelination, 3 = complete demyelination. I, Representative brain sections of Bielschowsky staining are shown in the caudal region of CC in NestinTK and NestinTK+ mice treated with either PBS or GCV at 8 weeks. The entity of axonal damage was evaluated in the rostral and caudal regions by Bielschowsky staining. n = 3 mice/group. J, Representative brain sections of APP staining are shown in the caudal region of CC in mice treated with normal diet, in NestinTK and NestinTK+ mice treated with GCV for 2 weeks at 8 weeks. Graph shows the number of APP+ cells at 8 weeks in the caudal region after the cuprizone diet. n = 3 mice/group. K, Representative electron micrographs of the caudal CC of mice treated with normal diet, of NestinTKGCV-Cup and NestinTK+GCV-Cup mice at the eighth week. Graphs show the axonal density and the g-ratio of myelinated axons in mice fed with a normal diet and in NestinTKGCV-Cup and NestinTK+GCV-Cup mice. n = 3 mice/group. Each bar represents the mean ± SEM. *p ≤ 0.05; **p ≤ 0.01; ***p ≤ 0.001; ****p ≤ 0.0001 (unpaired t test in B, C, E, and F; one-way ANOVA followed by Bonferroni post hoc test in G, J, and K). Kruskal–Wallis test for nonparametric data in H. Scale bars: B, C, E, F, 50 μm; I, 100 μm; H, 200 μm; K, 2 μm.
Figure 5.
Figure 5.
Effect of late eNPCs ablation on oligodendrocytes, astrogliosis, and microgliosis. A, Quantification of Olig2+ cells at 8 weeks in rostral and caudal region after the cuprizone diet. n = 6 mice/group. B, Graphs show the number of APC+ cells at 8 weeks in rostral and caudal regions after the cuprizone diet. n = 6 mice/group. C, Representative images and quantification of astrocytes (GFAP, in red) and of microglia (Iba-1, in green) at the level of the rostral and caudal CC at 8 weeks in NPC-ablated mice and controls. Graphs show the number of GFAP+ and Iba-1+ cells per area. n = 6 mice/group. Each bar represents the mean ± SEM. *p ≤ 0.05; one-way ANOVA followed by Bonferroni post hoc test. Scale bar, 50 μm.

Similar articles

Cited by

References

    1. Acs P, Kipp M, Norkute A, Johann S, Clarner T, Braun A, Berente Z, Komoly S, Beyer C (2009) 17β-estradiol and progesterone prevent cuprizone provoked demyelination of corpus callosum in male mice. Glia 57:807–814. 10.1002/glia.20806 - DOI - PubMed
    1. Aguirre A, Dupree JL, Mangin JM, Gallo V (2007) A functional role for EGFR signaling in myelination and remyelination. Nat Neurosci 10:990–1002. 10.1038/nn1938 - DOI - PubMed
    1. Bacigaluppi M, Russo GL, Peruzzotti-Jametti L, Rossi S, Sandrone S, Butti E, De Ceglia R, Bergamaschi A, Motta C, Gallizioli M, Studer V, Colombo E, Farina C, Comi G, Politi LS, Muzio L, Villani C, Invernizzi RW, Hermann DM, Centonze D, et al. (2016) Neural stem cell transplantation induces stroke recovery by upregulating glutamate transporter GLT-1 in astrocytes. J Neurosci 36:10529–10544. 10.1523/JNEUROSCI.1643-16.2016 - DOI - PMC - PubMed
    1. Barkhof F, Bruck W, De Groot CJ, Bergers E, Hulshof S, Geurts J, Polman CH, van der Valk P (2003) Remyelinated lesions in multiple sclerosis: magnetic resonance image appearance. Arch Neurol 60:1073–1081. 10.1001/archneur.60.8.1073 - DOI - PubMed
    1. Brousse B, Magalon K, Durbec P, Cayre M (2015) Region and dynamic specificities of adult neural stem cells and oligodendrocyte precursors in myelin regeneration in the mouse brain. Biol Open 4:980–992. 10.1242/bio.012773 - DOI - PMC - PubMed

Publication types

MeSH terms

LinkOut - more resources