. 2019 Dec;70(6):1986-2002.
doi: 10.1002/hep.30780. Epub 2019 Aug 13.

Ablation of Hepatocyte Smad1, Smad5, and Smad8 Causes Severe Tissue Iron Loading and Liver Fibrosis in Mice

Affiliations

Ablation of Hepatocyte Smad1, Smad5, and Smad8 Causes Severe Tissue Iron Loading and Liver Fibrosis in Mice

Chia-Yu Wang et al. Hepatology. 2019 Dec.

Abstract

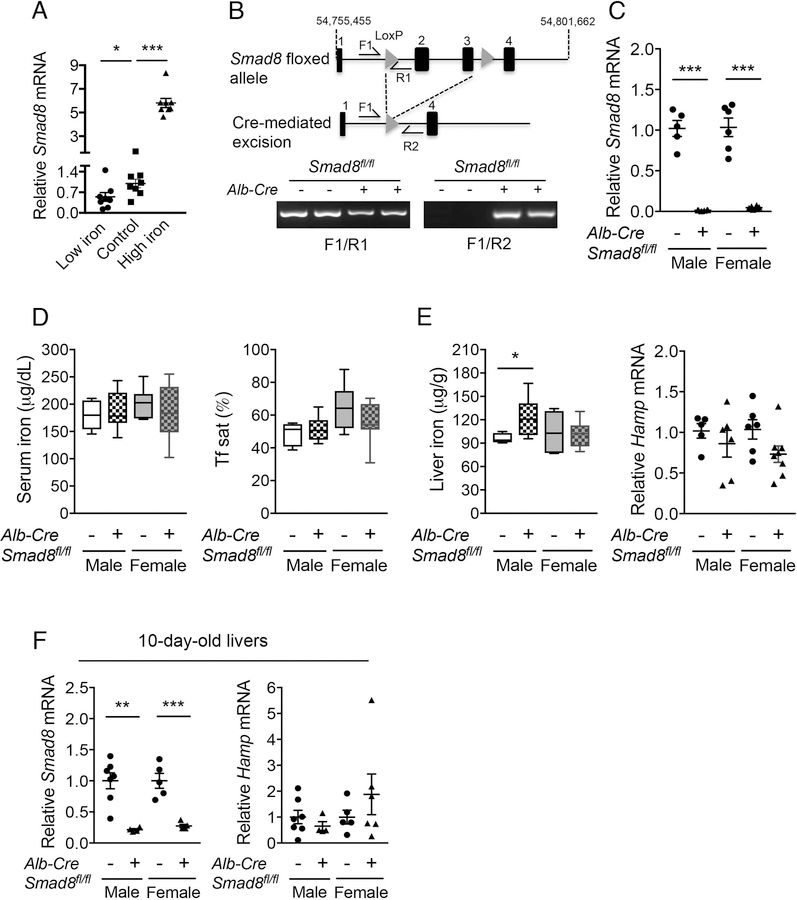
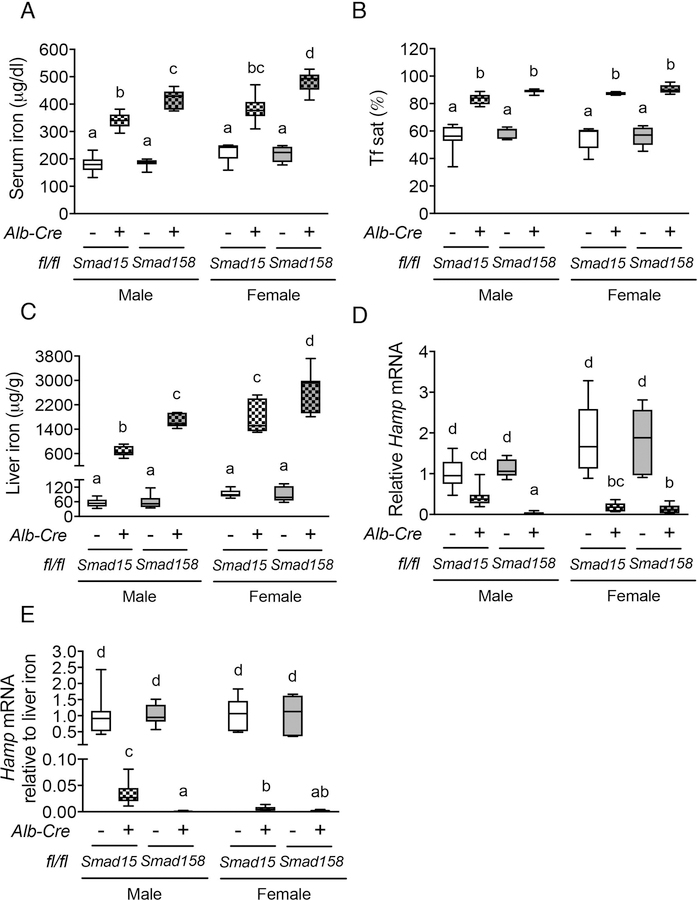
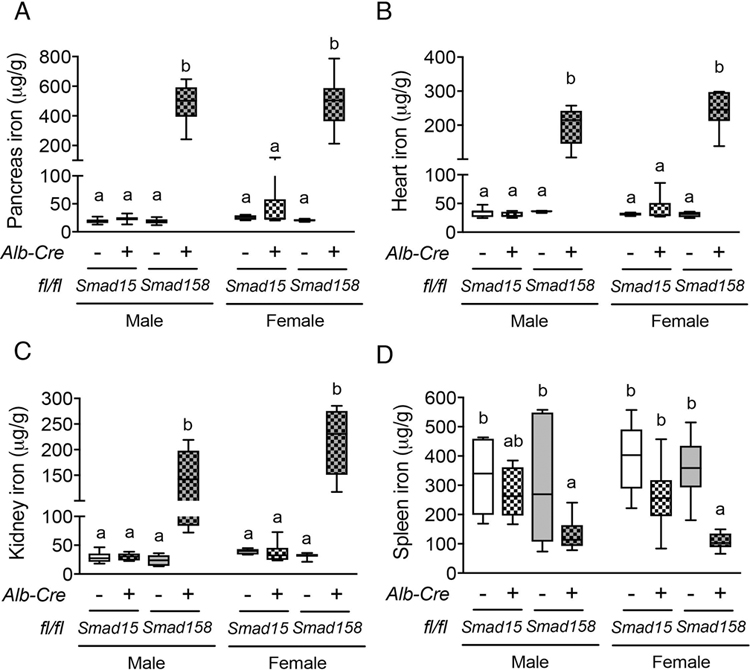
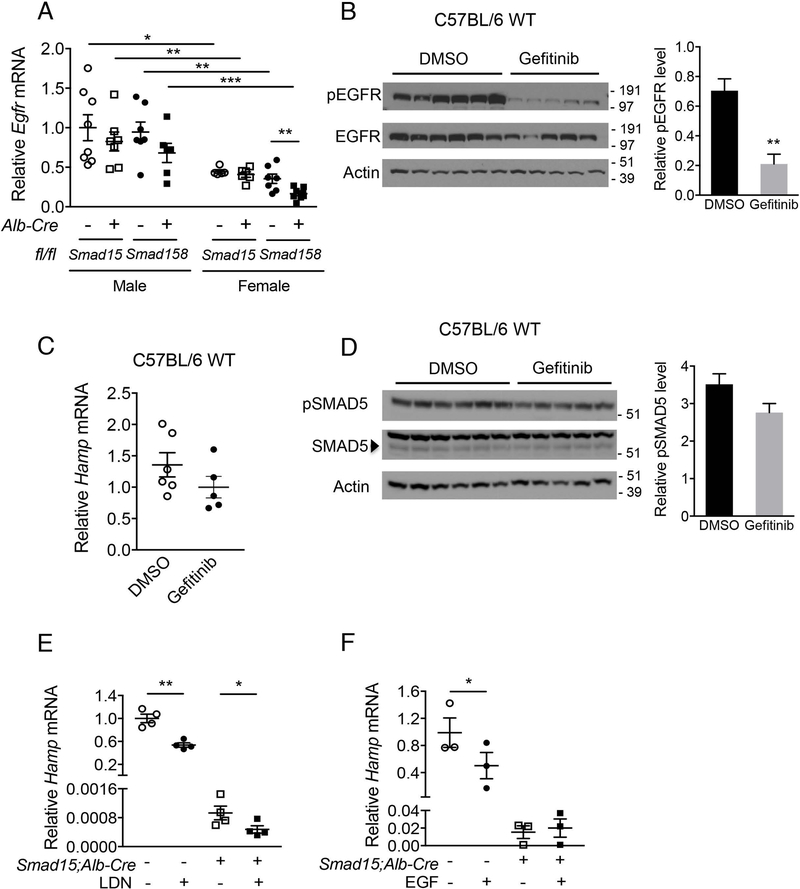
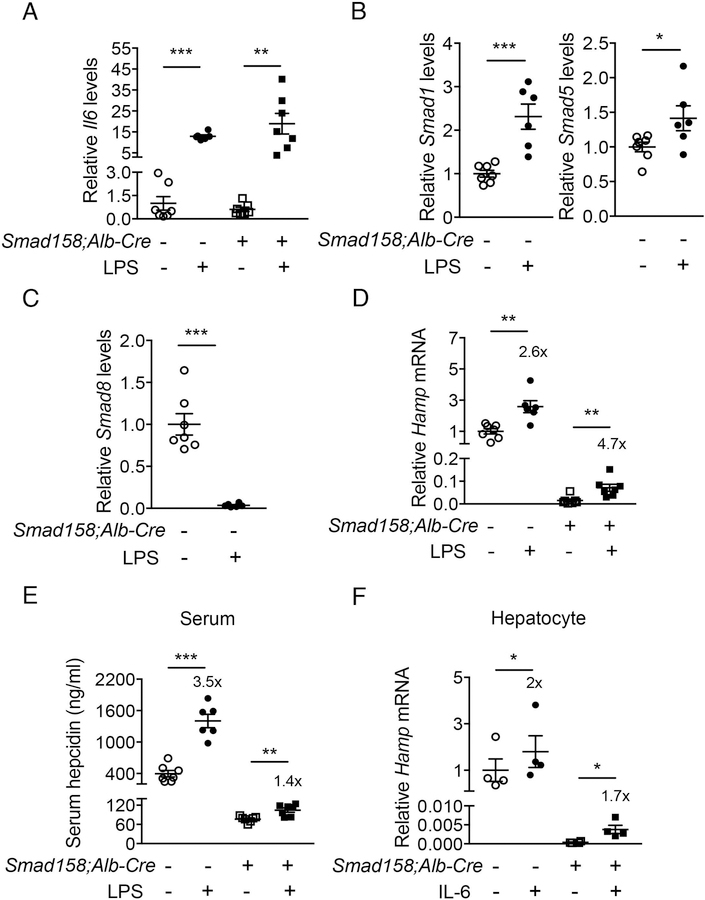
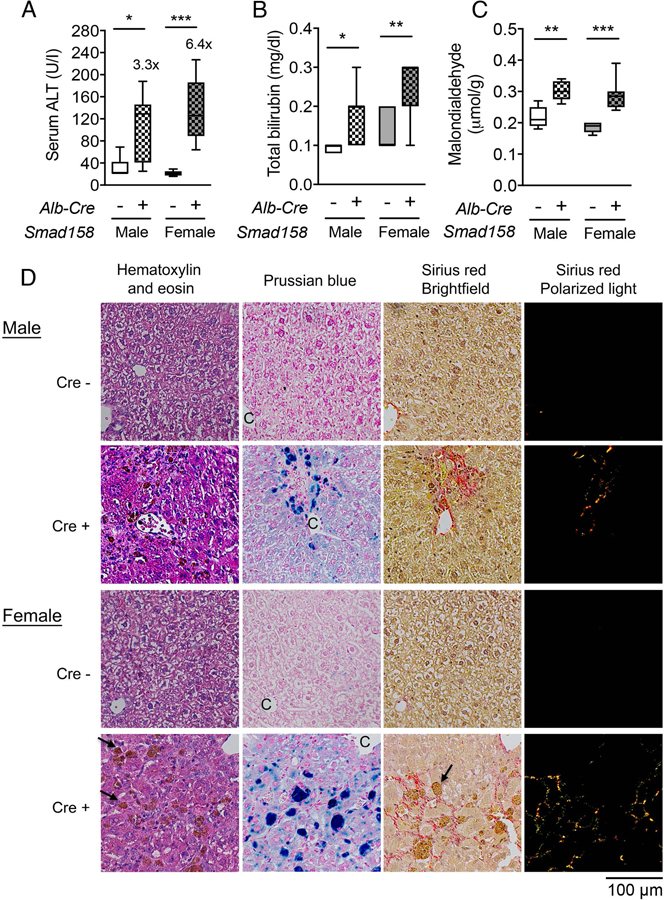
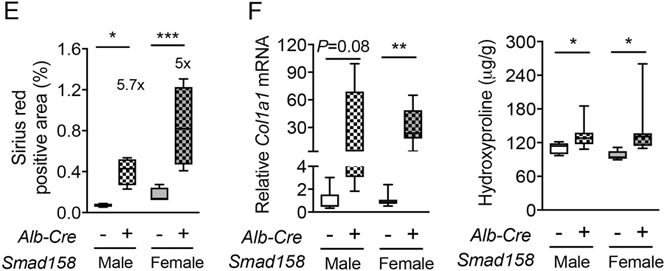
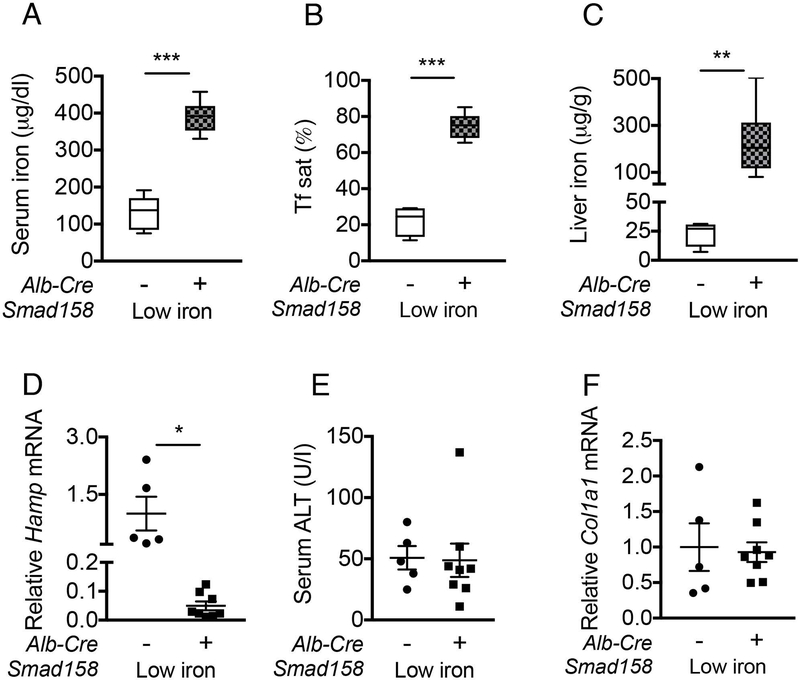
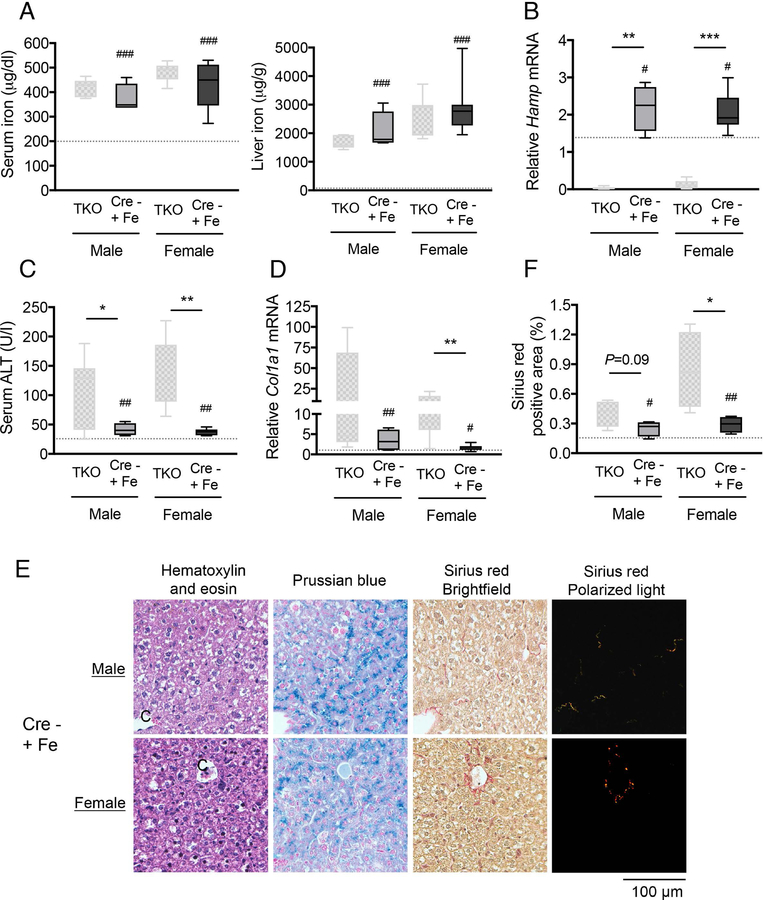
A failure of iron to appropriately regulate liver hepcidin production is central to the pathogenesis of hereditary hemochromatosis. SMAD1/5 transcription factors, activated by bone morphogenetic protein (BMP) signaling, are major regulators of hepcidin production in response to iron; however, the role of SMAD8 and the contribution of SMADs to hepcidin production by other systemic cues remain uncertain. Here, we generated hepatocyte Smad8 single (Smad8fl/fl ;Alb-Cre+ ), Smad1/5/8 triple (Smad158;Alb-Cre+ ), and littermate Smad1/5 double (Smad15;Alb-Cre+ ) knockout mice to investigate the role of SMAD8 in hepcidin and iron homeostasis regulation and liver injury. We found that Smad8;Alb-Cre+ mice exhibited no iron phenotype, whereas Smad158;Alb-Cre+ mice had greater iron overload than Smad15;Alb-Cre+ mice. In contrast to the sexual dimorphism reported for wild-type mice and other hemochromatosis models, hepcidin deficiency and extrahepatic iron loading were similarly severe in Smad15;Alb-Cre+ and Smad158;Alb-Cre+ female compared with male mice. Moreover, epidermal growth factor (EGF) failed to suppress hepcidin in Smad15;Alb-Cre+ hepatocytes. Conversely, hepcidin was still increased by lipopolysaccharide in Smad158;Alb-Cre+ mice, although lower basal hepcidin resulted in lower maximal hepcidin. Finally, unlike most mouse hemochromatosis models, Smad158;Alb-Cre+ developed liver injury and fibrosis at 8 weeks. Liver injury and fibrosis were prevented in Smad158;Alb-Cre+ mice by a low-iron diet and were minimal in iron-loaded Cre- mice. Conclusion: Hepatocyte Smad1/5/8 knockout mice are a model of hemochromatosis that encompasses liver injury and fibrosis seen in human disease. These mice reveal the redundant but critical role of SMAD8 in hepcidin and iron homeostasis regulation, establish a requirement for SMAD1/5/8 in hepcidin regulation by testosterone and EGF but not inflammation, and suggest a pathogenic role for both iron loading and SMAD1/5/8 deficiency in liver injury and fibrosis.


Conflict of interest statement

Disclosures

JLB has ownership interest in Ferrumax Pharmaceuticals and has received consulting fees from Keryx Biopharmaceuticals and Disc Medicine. All other authors have nothing to declare.

Figures

Fig. 1
Fig. 1. Iron regulates liver Smad8 expression, but hepatocyte Smad8 conditional knockout mice (Smad8fl/fl;Alb-Cre+) exhibit minimal to no iron loading.
(A) Relative Smad8 expression was measured by qRT-PCR in livers of 7-week-old C57BL/6 male mice after receiving a low (2–6 ppm), sufficient (48 ppm; Control) or high iron (2% carbonyl) diet for 3 weeks (n= 8 per group). (B, top) Schematic depictions of the lox-P-flanked (floxed) Smad8 allele and the allele after Cre recombinase-mediated excision. F and R indicate forward and reverse primers used for PCR genotyping. (B, bottom) PCR analysis of genomic DNA extracted from total liver of Smad8fl/fl;Alb-Cre+ mice and littermate Cre- controls at 8 weeks of age. (C) Relative Smad8 mRNA levels in the total livers of Smad8fl/fl;Alb-Cre+ mice and littermate Cre- controls was measured by qRT-PCR to confirm hepatocyte Smad8 ablation in conditional knockout mice (n= 5–8 per group). (D) Serum iron (left), transferrin saturation (Tf sat, right), (E) hepatic nonheme iron concentrations (left) and liver hepcidin (Hamp) expression (right) were quantified in 8-week-old male and female Smad8fl/fl;Alb-Cre+ mice compared with their respective littermate Cre- controls (n= 5–8 per group). (F) Liver Smad8 and Hamp mRNA were measured by qRT-PCR in male and female Smad8fl/fl;Alb-Cre+ mice and littermate Cre- controls at 10 days of age (n=4–7 per group). All transcript levels were normalized to Rpl19, and the average of the respective littermate Cre- control mice was set to 1. Data are presented as scatter plots with mean ± SEM or box plots with min to max whiskers. *P < 0.05, **P < 0.01, ***P < 0.001 relative to mice fed an iron sufficient diet by one-way ANOVA with Tukey’s post hoc test or to the respective Cre- controls by Student’s t test.
Fig. 2
Fig. 2. Smad1/5/8 triple-knockout mice (Smad158;Alb-Cre+) exhibit more severe hepcidin deficiency and iron overload compared with Smad1/5 double-knockout mice (Smad15;Alb-Cre+).
(A) Serum iron, (B) Tf sat, (C) liver iron concentration, (D) liver Hamp mRNA and (E) liver Hamp mRNA levels relative to liver iron concentration were measured in 8-week-old male and female Smad15;Alb-Cre+ and Smad158;Alb-Cre+ mice and their respective littermate Cre- controls (n=5–8 per group). Transcript levels were normalized to Rpl19, and the average of male Smad15;Alb-Cre- control mice was set to 1. Data are presented as box plots with min to max whiskers. Results were compared across genotype and sex by two-way ANOVA with Tukey’s post-hoc test. Means without a common superscript differ significantly (P < 0.05).
Fig. 3
Fig. 3. Eight-week-old Smad158;Alb-Cre+, but not Smad15;Alb-Cre+, mice exhibit extrahepatic iron loading in pancreas, heart and kidney with similar severity in females and males.
Eight-week-old male and female Smad15;Alb-Cre+ and Smad158;Alb-Cre+ mice and their respective littermate Cre- controls were analyzed for tissue iron in (A) pancreas, (B) heart, (C) kidney and (D) spleen (n=5–8 per group). Data are presented in box plots with min to max whiskers. Results were compared across genotype and sex by two-way ANOVA with Tukey’s post-hoc test. Means without a common superscript differ significantly (P < 0.05).
Fig. 4
Fig. 4. The EGFR inhibitor gefitinib does not reverse hepcidin suppression in male mice, but hepatocyte ablation of Smad1 and Smad5 abolishes hepcidin suppression by EGF.
(A) Eight-week-old male and female Smad15;Alb-Cre+ and Smad158;Alb-Cre+ mice and their respective littermate Cre- controls were analyzed for hepatic Egfr mRNA (n=5–8 per group). (B-D) C57BL/6 wildtype male mice at 7 weeks were treated with 200 mg per kg gefitinib or DMSO vehicle via oral gavage for 5 days (n=5–6 per group). Mice were sacrificed 6 hours after the final dose and livers were analyzed for (B) EGFR phosphorylation and (D) SMAD5 phosphorylation levels by immunoblot and chemiluminescence quantitation and (C) Hamp mRNA by qRT-PCR. (E-F) Primary hepatocytes were isolated from 7-week-old Smad15;Alb-Cre+ and littermate Cre- control mice. Hepatocyte Hamp mRNA was analyzed by qRT-PCR in cells treated with (E) 100 nM LDN-193189 in 2% 2-hydroxypropyl-β-cyclodextrin or (F) 20 ng/ml mouse recombinant EGF or vehicle alone for 24 hours. Data from 4 (E) or 3 (F) independent experiments, each performed in triplicate, are shown. Transcripts were normalized to Rpl19 and the average of male Smad15;Alb-Cre- or vehicle-treated Cre- control mice were set to 1. Data are presented in scatter plots with mean ± SEM. *P < 0.05, **P < 0.01, ***P < 0.001 relative to female mice or vehicle-treated control mice of the same genotype or as otherwise noted by Student’s t test.
Fig. 5
Fig. 5. Inflammation significantly increases hepcidin production in Smad158;Alb-Cre+ mice.
Male and female Smad158;Alb-Cre+ and littermate Cre- control mice (n=6–7 per group) at 6 weeks of age were injected with PBS or LPS (1 mg per kg body weight) and sacrificed after 6 hours. Livers and serum were collected to determine (A) Il6, (B) Smad1/5, (C) Smad8 (D) Hamp mRNA expression by qRT-PCR, and (E) serum hepcidin protein levels by ELISA. (F) Primary hepatocytes isolated from 6-week-old Smad158;Alb-Cre+ and littermate Cre- control mice (n=4 per group) were treated with 2 ng/ml IL-6 for 6 hours and Hamp mRNA levels were determined. Data from 4 independent experiments, each performed in triplicate, are shown. Transcripts were normalized to Rpl19 and the average of PBS-treated Cre- control mice were set to 1. Data are presented as scatter plots with mean ± SEM. *P < 0.05, **P < 0.01, ***P < 0.001 relative to PBS-treated controls of the same genotype by Student’s t test. Fold-change relative to PBS treatment for each genotype are reported in panels D-F.
Fig. 6
Fig. 6. Smad158;Alb-Cre+ mice develop liver injury and fibrosis at 8 weeks of age.
Male and female Smad158;Alb-Cre+ and littermate Cre- control mice were sacrificed at 8 weeks of age (n=6–8 per group). Serum was collected to measure (A) alanine aminotransferase (ALT) and (B) total bilirubin. (C, F) Liver malondialdehyde, hydroxyproline, and Col1a1 relative to Rpl19 mRNA levels were quantified by colorimetric assays or qRT-PCR. (D) Liver sections from a subset of mice (n=4 per group) were stained with hematoxylin and eosin, picrosirius red for collagen formation, or Perls’ Prussian blue for tissue iron. Branches of the central vein (C) and ceroid-laden macrophages (arrows) are indicated. Images were taken under the brightfield and/or polarized light, and representative images are shown. (E) The sirius red positive area was quantitated by dividing total area calculated in polarized light (after subtraction of major veins) by total area calculated under the brightfield (n=4 per group). Data are presented as box plots with min to max whiskers. For qRT-PCR, the average of male Cre- control mice was set to 1. *P < 0.05, **P < 0.01, ***P < 0.001 relative to their respective Cre- controls by Student’s t test.
Fig. 7
Fig. 7. A low iron diet prevents liver injury and fibrosis in Smad158;Alb-Cre+ mice.
Four-week-old male and female Smad158;Alb-Cre+ and littermate Cre- control mice were treated with a low iron diet for 4 weeks (n=5–8 per group). At 8 weeks of age, serum and livers were collected to determine (A) serum iron, (B) serum Tf sat, (C) liver iron, and (E) serum ALT. (D) Liver Hamp and (F) liver Col1a1 mRNA levels were measured by qRT-PCR. Transcript levels were normalized to Rpl19, and the average of Cre- control mice was set to 1. Data are presented as scatter plots with mean ± SEM or box plots with min to max whiskers. *P < 0.05, **P < 0.01, ***P < 0.001 relative to Cre- control mice on a low iron diet by Student’s t test.
Fig. 8
Fig. 8. Hepatocyte ablation of Smad1/5/8 worsens iron-induced liver injury and fibrosis in mice.
Three-week-old male and female Smad15;Alb-Cre- mice were fed a high iron (2% carbonyl iron) diet for 5 weeks (Cre- +Fe, n=4–8 per group). At 8 weeks of age, tissues were collected to measure (A) serum iron and liver iron and (C) serum ALT. (B) Liver Hamp and (D) Col1a1 relative to Rpl19 mRNA levels were measured by qRT-PCR. Data are presented as box plots with min to max whiskers. Results from Smad158;Alb-Cre+ mice on a house diet from Figure 2 and Figure 6 were replotted for comparison (TKO). The dotted lines represent the average of all Cre- mice on a house diet from Figure 2 and 6 for reference. For qRT-PCR, results are normalized to the average of male Smad158;Alb-Cre- control mice on a house diet, which was set to 1. #P < 0.05, ##P < 0.01, ###P < 0.001 relative to Cre- mice on a house diet by Student’s t test. *P < 0.05, **P < 0.01, ***P < 0.001 relative to sex-matched TKO mice by Student’s t test. (E) In a subset of mice (n=4 per group), liver sections were stained with hematoxylin and eosin, picrosirius red for collagen formation, or Perls’ Prussian blue for tissue iron. Images were taken under the brightfield and/or polarized light, and representative images are shown. (F) The sirius red positive area was quantitated by dividing total area calculated in polarized light (after subtraction of major veins) by total area calculated under the brightfield (n=4 per group). Data in panel F are presented and analyzed as in panels A-D.

Similar articles

Cited by

References

    1. Nemeth E, Tuttle MS, Powelson J, Vaughn MB, Donovan A, Ward DM, et al. Hepcidin regulates cellular iron efflux by binding to ferroportin and inducing its internalization. Science 2004;306:2090–2093. - PubMed
    1. Roetto A, Papanikolaou G, Politou M, Alberti F, Girelli D, Christakis J, et al. Mutant antimicrobial peptide hepcidin is associated with severe juvenile hemochromatosis. Nat Genet 2003;33:21–22. - PubMed
    1. Brissot P, Pietrangelo A, Adams PC, de Graaff B, McLaren CE, Loreal O. Haemochromatosis. Nat Rev Dis Primers 2018;4:18016. - PMC - PubMed
    1. Wang CY, Babitt JL. Liver iron sensing and body iron homeostasis. Blood 2018. - PMC - PubMed
    1. Canali S, Zumbrennen-Bullough KB, Core AB, Wang CY, Nairz M, Bouley R, et al. Endothelial cells produce bone morphogenetic protein 6 required for iron homeostasis in mice. Blood 2016. - PMC - PubMed

Publication types