Method for diagnosing neoplastic lesions by quantitative fluorescence value
- PMID: 31127170
- PMCID: PMC6534587
- DOI: 10.1038/s41598-019-44287-z
Method for diagnosing neoplastic lesions by quantitative fluorescence value
Abstract
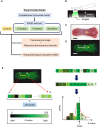
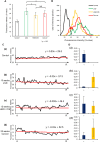
Fluorescence visualization devices (FVs) are useful for detecting malignant lesions because of their simple and noninvasive application. However, their quantitative application has been challenging. This study aimed to quantitatively and statistically evaluate the change in fluorescence intensity (FI) during the progression from normal epithelium to squamous cell carcinoma using a reproducible animal tongue carcinogenesis model. To establish this model, rats were treated with 50 ppm 4-Nitroquinoline 1-oxide (4NQO) in their drinking water for 10, 15, and 20 weeks. After 4NQO administration, each rat tongue was evaluated by gross observation, histology, and FI measurements. Fluorescence images were captured by FV, and ImageJ was used to measure FI, which was analyzed quantitatively and statistically. The establishment of a reproducible tumor progression model was confirmed, showing precancerous lesions (low-grade dysplasia [LGD]), early cancers (high-grade dysplasia/carcinoma in situ [HGD/CIS]), and advanced cancers (Cancer). This carcinogenesis model was quantitatively evaluated by FI. The FI of LGD stage was 54.6, which was highest intensity of all groups. Subsequently, the HGD/CIS and Cancer stages showed decreased FI (HGD/CIS: 46.1, Cancer: 49.1) and manifested as dark spots. This result indicates that FI had more variation and a wider range with increasing tumor progression. We demonstrated that FI migration and an uneven distribution are consistent with tumor progression. Since each step of tumor progression occurs reproducibly in this animal model, statistical evaluation was possible. In addition, tumor progression can be monitored by this new FI analysis method in humans.
Conflict of interest statement
The authors declare no competing interests.
Figures


Similar articles
-
Early Detection of Leukoplakic Oral Squamous Cell Carcinoma Using 4NQO-induced Rat Tongue Cancer Model: Study Utilizing Fluorescence Intensity and Histopathological Evaluation.Bull Tokyo Dent Coll. 2022 Mar 8;63(1):1-12. doi: 10.2209/tdcpublication.2020-0014. Epub 2022 Feb 15. Bull Tokyo Dent Coll. 2022. PMID: 35173082
-
Grape seed extract and resveratrol prevent 4-nitroquinoline 1-oxide induced oral tumorigenesis in mice by modulating AMPK activation and associated biological responses.Mol Carcinog. 2015 Apr;54(4):291-300. doi: 10.1002/mc.22099. Epub 2013 Nov 14. Mol Carcinog. 2015. PMID: 24243690 Free PMC article.
-
[A rat model of tongue mucosa squamous cell carcinoma induced by oral administration of 4NQO in drinking water].Zhonghua Kou Qiang Yi Xue Za Zhi. 1999 Nov;34(6):354-6. Zhonghua Kou Qiang Yi Xue Za Zhi. 1999. PMID: 11776878 Chinese.
-
4-nitroquinoline-1-oxide (4NQO) induced oral carcinogenesis: A systematic literature review.Pathol Res Pract. 2022 Aug;236:153970. doi: 10.1016/j.prp.2022.153970. Epub 2022 Jun 10. Pathol Res Pract. 2022. PMID: 35709549 Review.
-
Host genes controlling the susceptibility and resistance to squamous cell carcinoma of the tongue in a rat model.Pathol Int. 2000 May;50(5):353-62. doi: 10.1046/j.1440-1827.2000.01058.x. Pathol Int. 2000. PMID: 10849324 Review.
Cited by
-
Non-Invasive Early Detection of Oral Cancers Using Fluorescence Visualization with Optical Instruments.Cancers (Basel). 2020 Sep 27;12(10):2771. doi: 10.3390/cancers12102771. Cancers (Basel). 2020. PMID: 32992486 Free PMC article.
-
Flavinated SDHA underlies the change in intrinsic optical properties of oral cancers.Commun Biol. 2023 Nov 9;6(1):1134. doi: 10.1038/s42003-023-05510-w. Commun Biol. 2023. PMID: 37945749 Free PMC article.
-
Tween-20-Modified BiVO4 Nanorods for CT Imaging-Guided Radiotherapy of Tumor.ACS Omega. 2023 Jan 25;8(5):4736-4746. doi: 10.1021/acsomega.2c06714. eCollection 2023 Feb 7. ACS Omega. 2023. PMID: 36777573 Free PMC article.
-
Combined Photothermotherapy and Chemotherapy of Oral Squamous Cell Carcinoma Guided by Multifunctional Nanomaterials Enhanced Photoacoustic Tomography.Int J Nanomedicine. 2021 Nov 2;16:7373-7390. doi: 10.2147/IJN.S336788. eCollection 2021. Int J Nanomedicine. 2021. PMID: 34754191 Free PMC article.
-
Evaluation of Oral Mucosal Lesions Using the IllumiScan® Fluorescence Visualisation Device: Distinguishing Squamous Cell Carcinoma.Int J Environ Res Public Health. 2022 Aug 21;19(16):10414. doi: 10.3390/ijerph191610414. Int J Environ Res Public Health. 2022. PMID: 36012046 Free PMC article.
References
-
- Morikawa T, Bessho H, Kozakai A, Kosugi A, Shibahara T. Analysis of oral squamous cell carcinoma and oral lichen planus using the “Illumiscan” optical instrument. J. Shikwa Gakuho. 2017;117:383–392.
Publication types
MeSH terms
Substances
LinkOut - more resources
Full Text Sources

