. 2019 May 23;17(1):41.
doi: 10.1186/s12915-019-0662-4.

A genetically encoded toolkit of functionalized nanobodies against fluorescent proteins for visualizing and manipulating intracellular signalling

Affiliations

A genetically encoded toolkit of functionalized nanobodies against fluorescent proteins for visualizing and manipulating intracellular signalling

David L Prole et al. BMC Biol. .

Abstract

Background: Intrabodies enable targeting of proteins in live cells, but generating specific intrabodies against the thousands of proteins in a proteome poses a challenge. We leverage the widespread availability of fluorescently labelled proteins to visualize and manipulate intracellular signalling pathways in live cells by using nanobodies targeting fluorescent protein tags.

Results: We generated a toolkit of plasmids encoding nanobodies against red and green fluorescent proteins (RFP and GFP variants), fused to functional modules. These include fluorescent sensors for visualization of Ca2+, H+ and ATP/ADP dynamics; oligomerising or heterodimerising modules that allow recruitment or sequestration of proteins and identification of membrane contact sites between organelles; SNAP tags that allow labelling with fluorescent dyes and targeted chromophore-assisted light inactivation; and nanobodies targeted to lumenal sub-compartments of the secretory pathway. We also developed two methods for crosslinking tagged proteins: a dimeric nanobody, and RFP-targeting and GFP-targeting nanobodies fused to complementary hetero-dimerizing domains. We show various applications of the toolkit and demonstrate, for example, that IP3 receptors deliver Ca2+ to the outer membrane of only a subset of mitochondria and that only one or two sites on a mitochondrion form membrane contacts with the plasma membrane.

Conclusions: This toolkit greatly expands the utility of intrabodies and will enable a range of approaches for studying and manipulating cell signalling in live cells.

Keywords: Cell signalling; Endoplasmic reticulum; Fluorescence microscopy; Fluorescent protein; GFP; Intrabody; Membrane contact site; Mitochondria; Nanobody; RFP.


Conflict of interest statement

The authors declare that they have no competing interests.

Figures
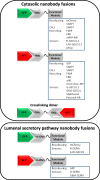
Fig. 1
Fig. 1
Nanobody fusions for visualizing and manipulating intracellular signalling. Plasmids were generated that encode nanobodies specific for GFP variants (GNb) or RFP variants (RNb), fused to functional modules. Nanobody fusions with an N-terminal signal sequence to target them to the secretory pathway are also shown (ssGNb and ssRNb)
Fig. 2
Fig. 2
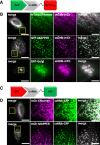
RNb and GNb fusion proteins bind to their respective tagged proteins in live cells. a Schematic of the RNb-GFP fusion binding to RFP. b HeLa cells expressing RNb-GFP with RFP-tagged markers for the ER surface (mCh-Sec61β), the mitochondrial surface (TOM20-mCh), the nucleus (H2B-mCh), or the surface of lysosomes (TPC2-mRFP). Cells were imaged in HBS using epifluorescence microscopy (cells expressing H2B-mCh) or TIRFM (other cells). Yellow boxes indicate regions enlarged in the subsequent panels. Colocalization values (Pearson’s coefficient, r) were mCh-Sec61β (r = 0.93 ± 0.09, n = 10 cells), TOM20-mCh (r = 0.94 ± 0.09, n = 10 cells), H2B-mCh (r = 0.97 ± 0.06, n = 10 cells), and TPC2-mRFP (r = 0.78 ± 0.09, n = 5 cells). c Schematic of the GNb-mCh fusion binding to GFP. d HeLa cells co-expressing GNb-mCh with GFP-tagged markers for the ER surface (GFP-ERcyt), the mitochondrial surface (TOM20-GFP), and the nucleus (H2B-GFP), or an mTurquoise2-tagged ER surface marker (mTurq-ERcyt). Cells were imaged using epifluorescence microscopy (cells expressing H2B-GFP) or TIRFM (other cells). Yellow boxes indicate regions enlarged in the subsequent panels. Colocalization values were GFP-ERcyt (r = 0.92 ± 0.08, n = 8 cells), TOM20-GFP (r = 0.87 ± 0.05, n = 7 cells), H2B-GFP (r = 0.94 ± 0.07, n = 6 cells), and mTurq-ERcyt (r = 0.97 ± 0.03, n = 7 cells). Scale bars 10 μm (main images) or 2.5 μm (enlargements)
Fig. 3
Fig. 3
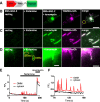
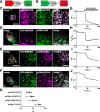
Targeting RNb-Ca2+ sensors to RFP-tagged proteins. a Schematic of RNb-GGECO fusion binding to RFP. bd HeLa cells expressing RNb-GGECO1.2 and TOM20-mCh, before and after addition of histamine (100 μM) and then ionomycin (5 μM). Cells were imaged in HBS using TIRFM. The TOM20-mCh image is shown after the histamine and ionomycin additions. The merged images are shown using images of RNb-GGECO1.2 after ionomycin (b, c) or histamine (d). The yellow and cyan-boxed regions in panel b are shown enlarged in panels c and d, respectively. Scale bars are 10 μm (b) or 1.25 μm (c, d). e Timecourse of the effects of histamine (100 μM) and ionomycin (5 μM) on the fluorescence of RNb-GGECO1.2 (F/F0, where F and F0 are fluorescence recorded at t and t = 0). The traces are from regions coinciding with a single mitochondrion or cytosol (regions identified in panel d), indicating changes in [Ca2+] at the OMM. f Enlarged region (70–180 s) of the graph is shown in e. Results are representative of cells from 13 independent experiments
Fig. 4
Fig. 4
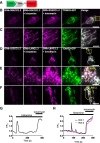
Targeted GNb-Ca2+ sensors detect changes in [Ca2+] at the surface of mitochondria. a Schematic of GNb-RGECO fusion binding to GFP. b, c Representative HeLa cells co-expressing TOM20-GFP and GNb-RGECO1.2 imaged in HBS using TIRFM before and after addition of histamine (100 μM) and then ionomycin (5 μM). The TOM20-GFP images are shown after the histamine and ionomycin additions. Histamine and ionomycin evoked changes in fluorescence of GNb-RGECO1.2 at the OMM. The yellow boxed region in panel B is shown enlarged in panel c. df Similar analyses of HeLa cells co-expressing TOM20-GFP and GNb-LAR-GECO1.2 (GNb-LARG1.2). Histamine (100 μM) evoked changes in fluorescence of GNb-LARG1.2 at the OMM of mitochondria in the perinuclear region (region of interest 1 (ROI 1) in e), but not in a peripheral region (ROI 2 in f). All mitochondria responded to ionomycin (5 μM), indicating that histamine evoked local changes in [Ca2+] at the OMM. The cyan and yellow boxed regions in d are shown enlarged in e and f, respectively. Scale bars 10 μm (b, d) or 2.5 μm (c, e and f). g Timecourse of the changes in fluorescence of GNb-RGECO1.2 at the OMM evoked by histamine and ionomycin for the entire cell shown in B. h Fluorescence changes recorded from ROI 1 and ROI 2 in panels e and f. Results are representative of cells from 4 independent experiments
Fig. 5
Fig. 5
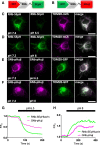
Targeting H+ sensors to RFP-tagged and GFP-tagged proteins. a Schematic of RNb fused to the pH sensor super-ecliptic pHluorin (RNb-SEpH) and bound to RFP. b Schematic of GNb-pHuji binding to RFP. c, d HeLa cells co-expressing RNb-SEpH and TOM20-mCh were imaged in modified HBS (MHBS) using epifluorescence microscopy and exposed to extracellular pH 6.5 (c) or pH 8 (d) in the presence of nigericin (10 μM). Scale bars 10 μm. e, f HeLa cells co-expressing GNb-pHuji and TOM20-GFP were exposed to extracellular pH 6.5 (e) or pH 8 (f) in the presence of nigericin. Scale bars 10 μm. g, h Timecourse from single cells of the fluorescence changes (F/F0) of mitochondrially targeted RNb-SEpH or GNb-pHuji evoked by the indicated manipulations of extracellular pH. Results shown are representative of 3 independent experiments
Fig. 6
Fig. 6
Targeting an ATP/ADP sensor to RFP-tagged proteins. a Schematic of RNb-Perceval-HR fusion (RNb-PHR) bound to RFP. b HeLa cells co-expressing RNb-PHR and TOM20-mCh were imaged in HBS using epifluorescence microscopy. The yellow box indicates the region enlarged in subsequent panels. Scale bars 10 μm (main image) and 2.5 μm (enlarged images). c, d Changes in fluorescence for each excitation wavelength (405 and 488 nm, F/F0) (c) and their ratio (R/R0, where R = F405/F488) (d) of mitochondrially targeted RNb-Perceval-HR after addition of 2-deoxyglucose (2DG, 10 mM), oligomycin (OM, 1 μM) and antimycin (AM, 1 μM). The results indicate a decrease in the ATP/ADP ratio at the OMM. Results are representative of 3 independent experiments
Fig. 7
Fig. 7
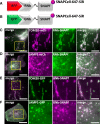
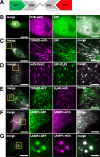
Nanobody-SNAPf fusion proteins allow labelling of RFP-tagged and GFP-tagged proteins with fluorescent O6-benzylguanine derivatives in live cells. a, b Schematics of RNb-SNAPf fusion bound to RFP, and GNb-SNAPf fusion bound to GFP, after labelling with SNAP-Cell-647-SiR (magenta circles). cf HeLa cells co-expressing RNb-SNAPf and mitochondrial TOM20-mCh (c), RNb-SNAPf and lysosomal LAMP1-mCh (d), GNb-SNAPf and TOM20-GFP (e) or GNb-SNAPf and LAMP1-GFP (f) were treated with SNAP-Cell-647-SiR (0.5 μM, 30 min at 37 °C) and imaged using TIRFM. Scale bars 10 μm (main images) or 2.5 μm (enlarged images of yellow boxed regions). Colocalization values: RNb-SNAPf + TOM20-mCh (r = 0.95 ± 0.02, n = 6 cells); RNb-SNAPf + LAMP1-mCh (r = 0.84 ± 0.06, n = 8 cells); GNb-SNAPf + TOM20-GFP (r = 0.78 ± 0.09, n = 10 cells); and GNb-SNAPf + LAMP1-GFP (r = 0.85 ± 0.10, n = 11 cells)
Fig. 8
Fig. 8
Targeting CALI to lysosomes using RNb-SNAPf reduces lysosomal motility. a Schematic of RNb-SNAPf after labelling with SNAP-Cell-fluorescein (green circle) and bound to RFP. b HeLa cells co-expressing LAMP1-mCh and RNb-SNAPf were incubated with SNAP-Cell-fluorescein (0.5 μM, 30 min, 37 °C), which labelled lysosomes (colocalization values, r = 0.73 ± 0.02, n = 6 cells), and imaged using TIRFM. c, d Cells were then exposed to 488-nm light for 3 s to induce CALI. TIRFM images show a representative cell at different times before (c) and after (d) CALI, with the image at t = 0 s shown in magenta and the image at t = 60 s in green. White in the merged images from the two different times indicates immobile lysosomes, while green and magenta indicate lysosomes that moved in the interval between images. Yellow boxes show regions enlarged in subsequent images. Scale bars 10 μm (main images) and 2.5 μm (enlargements). For clarity, images were auto-adjusted for brightness and contrast (ImageJ) to compensate for bleaching of mCh during tracking and CALI. e Effect of CALI on the displacements of individual lysosomes, determining by particle-tracking (TrackMate), during a 60-s recording from a representative cell (images taken every 1 s; mean values shown by bars). f Summary data (mean ± SEM, n = 6 cells from 6 independent experiments) show the mean fractional decrease in displacement (Δ displacement) due to CALI in cells expressing RNb-SNAPf or cytosolic SNAPf (see Additional file 1: Figure S2). The fractional decrease in displacement for each cell was defined as (MDpre–MDpost)/MDpre, where MDpre and MDpost are the mean displacement of all tracked particles in 60 s before and after CALI. *P < 0.05, unpaired Student’s t test
Fig. 9
Fig. 9
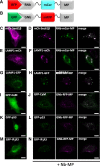
Clustering of RFP-tagged and GFP-tagged proteins and organelles using RNb-mCerulean-MP and GNb-mRFP-MP. a Schematic of RNb-mCerulean-MP fusion bound to RFP. b Schematic of GNb-mRFP-MP fusion bound to GFP. cf HeLa cells expressing RFP-tagged proteins in the absence (c, e) or presence (d, f) of co-expressed RNb-mCerulean-MP (RNb-mCer-MP) were imaged using epifluorescence microscopy. gn HeLa cells expressing GFP-tagged proteins in the absence (g, i, k, m) or presence (h, j, l, n) of co-expressed GNb-mRFP-MP were imaged using epifluorescence microscopy. Results are representative of at least 5 cells, from at least 3 independent experiments. Scale bars 10 μm
Fig. 10
Fig. 10
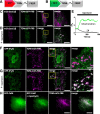
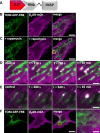
RNb-FKBP inducibly recruits ER transmembrane proteins to mitochondria. a Schematic of RNb-FKBP bound to RFP. b Schematic of GNb-FKBP bound to GFP. c, d HeLa cells co-expressing RNb-FKBP, mitochondrial TOM70-GFP-FRB and mCh-Sec61β were imaged using TIRFM. A representative cell (n = 7) is shown before (c) and after (d) treatment with rapamycin (100 nM, 10 min). The boxed region is enlarged in subsequent images. Scale bars 10 μm (main images) and 2.5 μm (enlargements). e Timecourse of mCh-Sec61β fluorescence changes (F/F0) evoked by rapamycin recorded at a representative mitochondrion and in nearby reticular ER. Results show ~ 80% loss of fluorescence from the ER devoid of mitochondrial contacts. f, g HeLa cells co-expressing endogenously tagged GFP-IP3R1, GNb-FKBP and mitochondrial TOM70-mCh-FRB were imaged using TIRFM. A representative cell (n = 6) is shown before (f) and after (g) treatment with rapamycin (100 nM, 10 min). The boxed region is enlarged in subsequent images. Scale bars 10 μm (main images) and 2.5 μm (enlargements). h HeLa cells co-expressing GFP-calmodulin (GFP-CaM), GNb-FKBP and TOM20-mCh-FRB were imaged using epifluorescence microscopy. A representative cell (n = 3) is shown before and after treatment with rapamycin (100 nM, 10 min). The image for TOM-mCh-FRB is shown in the presence of rapamycin. Scale bar 10 μm
Fig. 11
Fig. 11
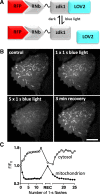
Reversible optogenetic recruitment of RFP-tagged proteins using RNb-zdk1. a Schematic of RNb-zdk1 fusion bound to RFP, showing the reversible light-evoked dissociation of zdk1 from LOV2. b HeLa cells co-expressing RNb-zdk1, mitochondrial TOM20-LOV2 and cytosolic mCh were imaged using TIRFM. A representative cell is shown before and after one or five 1-s exposures to blue light (488-nm laser at 2-s intervals) and after a 3-min recovery period in the dark. Scale bar 10 μm. c Timecourse of the mCherry fluorescence changes (F/F0) recorded at a representative mitochondrion and in nearby cytosol after each of the indicated light flashes. There is a reversible decrease (~ 60%) in mitochondrial mCh fluorescence and a corresponding reversible increase (~ 70%) in cytosolic fluorescence. A single measurement of mCh fluorescence was made at the end of a 3-min recovery period in the dark (REC) before further light flashes. Results are representative of 5 cells from 3 independent experiments
Fig. 12
Fig. 12
Recruitment of proteins to native PM-mitochondria MCS using RNb-FKBP. a Schematic of RNb-FKBP fusion bound to RFP. b, c HeLa cells co-expressing RNb-FKBP, mitochondrial TOM70-GFP-FRB and β2AR-mCh were imaged using TIRFM before (b) and after (c) treatment with rapamycin (100 nM, 10 min). Scale bar 10 μm. d, e Enlarged images from C of the yellow box (d) and cyan box (e) show punctate recruitment of β2AR-mCh to individual mitochondria at the indicated times after addition of rapamycin. Scale bars 1.25 μm. f TIRFM images of HeLa cells co-expressing mitochondrial TOM70-GFP-FRB and β2AR-mCh in the presence of rapamycin (100 nM, 10 min) show no recruitment in the absence of co-expressed RNb-FKBP. The yellow box shows a region enlarged in the subsequent image. Scale bars 10 μm (main images) and 2.5 μm (enlargement). Results (bf) are representative of 5 independent experiments
Fig. 13
Fig. 13
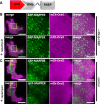
Recruitment of PM proteins to ER-PM MCS using RNb-FKBP. a Schematic of RNb-FKBP fusion bound to RFP. b HeLa cells co-expressing RNb-FKBP, mCh-Orai1 and the ER-PM junction marker GFP-MAPPER-FRB were imaged using TIRFM. A representative cell (n = 5) is shown before (top row) and after (bottom row) treatment with rapamycin (100 nM, 10 min). The boxed region is shown enlarged in subsequent images. c HeLa cells co-expressing mCh-Orai1 and GFP-MAPPER-FRB alone were imaged using TIRFM. A representative cell (n = 3) is shown before (top row) and after (bottom row) treatment with rapamycin (100 nM, 10 min). The boxed region is shown enlarged in subsequent images. The results show no recruitment in the absence of co-expressed RNb-FKBP. Scale bars (b, c) 10 μm (main images) and 2.5 μm (enlargements)
Fig. 14
Fig. 14
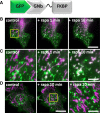
Inducible recruitment of lysosomes to mitochondria using GNb-FKBP. a Schematic of GNb-FKBP fusion bound to GFP. b HeLa cells co-expressing mitochondrial TOM70-mCh-FRB (magenta), lysosomal LAMP1-GFP (green) and GNb-FKBP were imaged using TIRFM. Merged images of a representative cell (n = 5) are shown before and at times after treatment with rapamycin (rapa, 100 nM). Scale bar 10 μm. c Enlargements of the boxed region in b. Scale bar 2.5 μm. d HeLa cells co-expressing TOM70-mCh-FRB (magenta) and lysosomal LAMP1-GFP (green) were imaged using TIRFM. A representative cell (n = 3) is shown before and after treatment with rapamycin (100 μm, 10 min); there is no recruitment in the absence of co-expressed GNb-FKBP. The yellow box shows a region enlarged in the subsequent image. Scale bars 10 μm (main images) and 2.5 μm (enlargement)
Fig. 15
Fig. 15
Crosslinking GFP-tagged and RFP-tagged proteins and organelles using GNb-RNb. a Schematic of GNb-RNb bound to GFP and RFP. be HeLa cells co-expressing the tagged proteins indicated with GNb-RNb were imaged using epifluorescence microscopy (b) or TIRFM (ce). Representative cells (n = 5–7) are shown. Control images for GFP-IP3R1 are shown in Fig. 10 and Additional file 1: Figure S3. f, g HeLa cells co-expressing LAMP1-GFP and LAMP1-mCh in the absence (f) or presence (g) of co-expressed GNb-RNb were imaged using TIRFM. Representative cells (n = 5) are shown. Scale bars (bg) 10 μm (main images) and 2.5 μm (enlargements of boxed areas)
Fig. 16
Fig. 16
Inducible crosslinking of RFP-tagged and GFP-tagged proteins with GNb-FKBP and RNb-FRB. a Schematic of the nanobody fusions used, with rapamycin shown as a blue sphere. b, c HeLa cells co-expressing GNb-FKBP, RNb-FRB, TOM20-GFP and mCh-Sec61β were imaged using TIRFM. A representative cell (n = 3) is shown before (b) and after (c) treatment with rapamycin (100 nM, 10 min). Scale bars 10 μm (main images) and 2.5 μm (enlargements of boxed areas)
Fig. 17
Fig. 17
Nanobody fusions can be targeted to different lumenal compartments of the secretory pathway. a Schematic of ssGNb-mCh bound to GFP. b HeLa cells co-expressing ssGNb-mCh and either the lumenal ER marker mTurquoise2-ERlumen, the marker of ER-PM junctions GFP-MAPPER, or the Golgi marker GFP-Golgi. Cells were imaged using epifluorescence microscopy. Representative cells are shown. Colocalization values were mTurquoise2-ERlumen (r = 0.96 ± 0.03, n = 10); GFP-MAPPER (r = 0.94 ± 0.02, n = 5); and GFP-Golgi (r = 0.91 ± 0.06, n = 4). c Schematic of ssRNb-GFP bound to RFP. d HeLa cells co-expressing ssRNb-GFP and either mCh-ERlumen or mCh-MAPPER were imaged using epifluorescence microscopy. Representative cells are shown. Colocalization values were: mCh-ERlumen (r = 0.98 ± 0.009, n = 9) and mCh-MAPPER (r = 0.93 ± 0.07, n = 13. Scale bars 10 μm (main images) and 2.5 μm (enlargements of boxed regions)
Fig. 18
Fig. 18
Nanobody-mediated targeting of low-affinity Ca2+ sensors allows measurement of changes in [Ca2+] in an ER sub-compartment at ER-PM MCS. a Schematic of ssRNb-Ca2+ sensor bound to RFP. b Schematic of ssGNb-Ca2+ sensor bound to GFP. cf HeLa cells co-expressing the indicated combinations of mCh-MAPPER, GFP-MAPPER, ssRNb-GCEPIA (ssRNb-GC), ssRNb-GEMCEPIA (ssRNb-GEM; the image is shown for the 525-nm emission channel), ssGNb-LAR-GECO1 (ssGNb-LGECO) or ssGNb-RCEPIA were imaged in Ca2+-free HBS using TIRFM. Yellow boxes indicate regions enlarged in subsequent images. Scale bars 10 μm (main images) and 2.5 μm (enlargements). gj Timecourses of fluorescence changes recorded from cells co-expressing mCh-MAPPER and ssRNb-GCEPIA (g), mCh-MAPPER and ssRNb-GEMCEPIA (h), GFP-MAPPER and ssGNb-LAR-GECO1 (ssGNb-LARG1) (i) and GFP-MAPPER and ssGNb-RCEPIA (j) in response to emptying of intracellular Ca2+ stores with ionomycin (5 μM). k Summary results (with mean ± SD, n = 4 cells) show fractional decreases (ΔF) in either fluorescence or emission ratio (for ssRNb-GEM) recorded 90 s after addition of ionomycin

Similar articles

Cited by

References

    1. Clift D, McEwan WA, Labzin LI, Konieczny V, Mogessie B, James LC, et al. A method for the acute and rapid degradation of endogenous proteins. Cell. 2018;171:1692–1706. doi: 10.1016/j.cell.2017.10.033. - DOI - PMC - PubMed
    1. Helma J, Cardoso MC, Muyldermans S, Leonhardt H. Nanobodies and recombinant binders in cell biology. J Cell Biol. 2015;209:633–644. doi: 10.1083/jcb.201409074. - DOI - PMC - PubMed
    1. Shaner NC, Steinbach PA, Tsien RY. A guide to choosing fluorescent proteins. Nat Methods. 2005;2:905–909. doi: 10.1038/nmeth819. - DOI - PubMed
    1. Rodriguez EA, Campbell RE, Lin JY, Lin MZ, Miyawaki A, Palmer AE, et al. The growing and glowing toolbox of fluorescent and photoactive proteins. Trends Biochem Sci. 2017;42:111–129. doi: 10.1016/j.tibs.2016.09.010. - DOI - PMC - PubMed
    1. Leonetti MD, Sekine S, Kamiyama D, Weissman JS, Huang B. A scalable strategy for high-throughput GFP tagging of endogenous human proteins. Proc Natl Acad Sci U S A. 2016;113:E3501–E3508. doi: 10.1073/pnas.1606731113. - DOI - PMC - PubMed

Publication types

Substances