Clinical Trial
. 2019 May 22;11(493):eaau0528.
doi: 10.1126/scitranslmed.aau0528.

Augmentation of HIV-specific T cell function by immediate treatment of hyperacute HIV-1 infection

Affiliations
Clinical Trial

Augmentation of HIV-specific T cell function by immediate treatment of hyperacute HIV-1 infection

Zaza M Ndhlovu et al. Sci Transl Med. .

Abstract

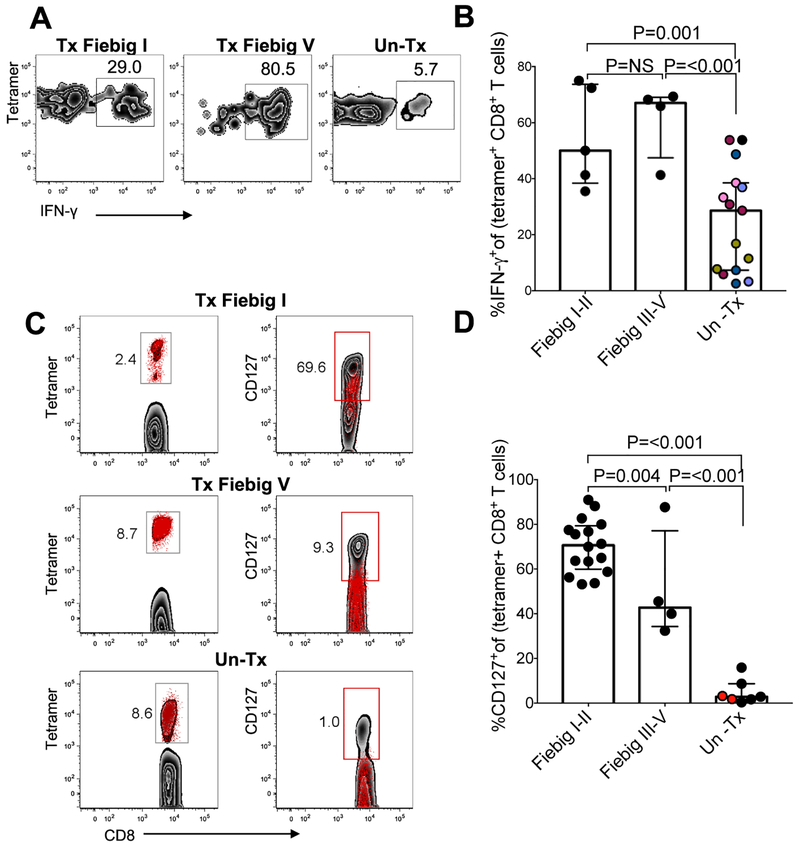
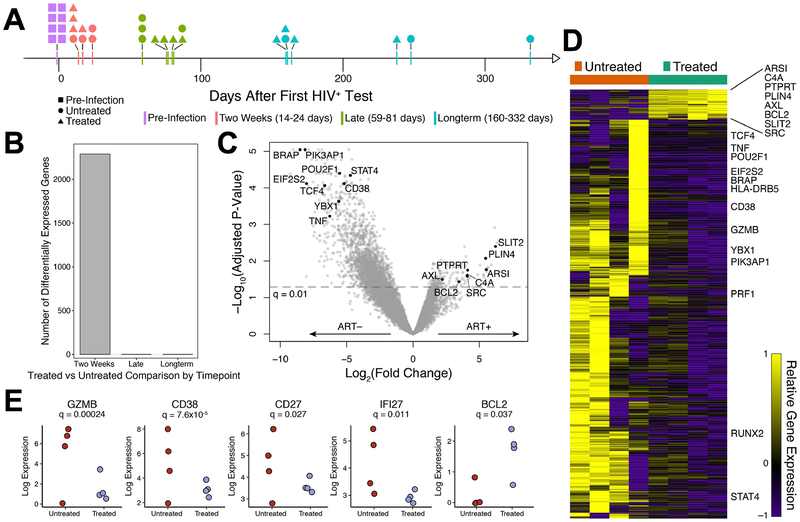
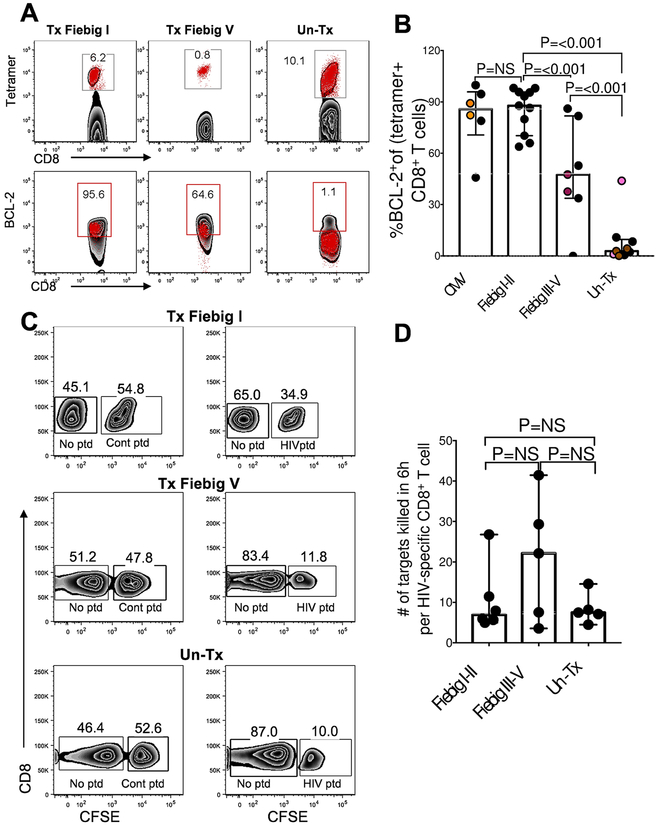
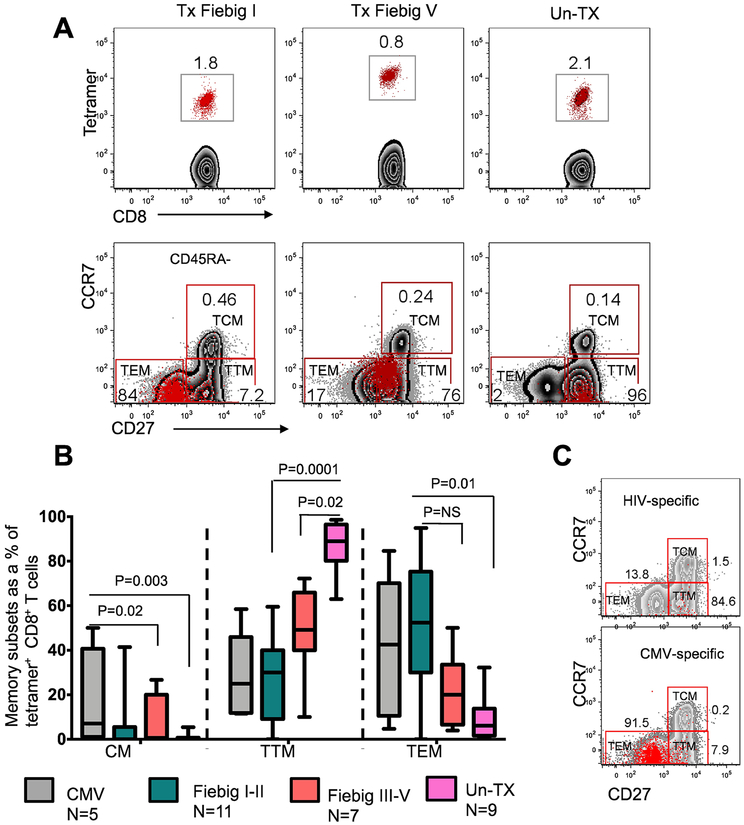
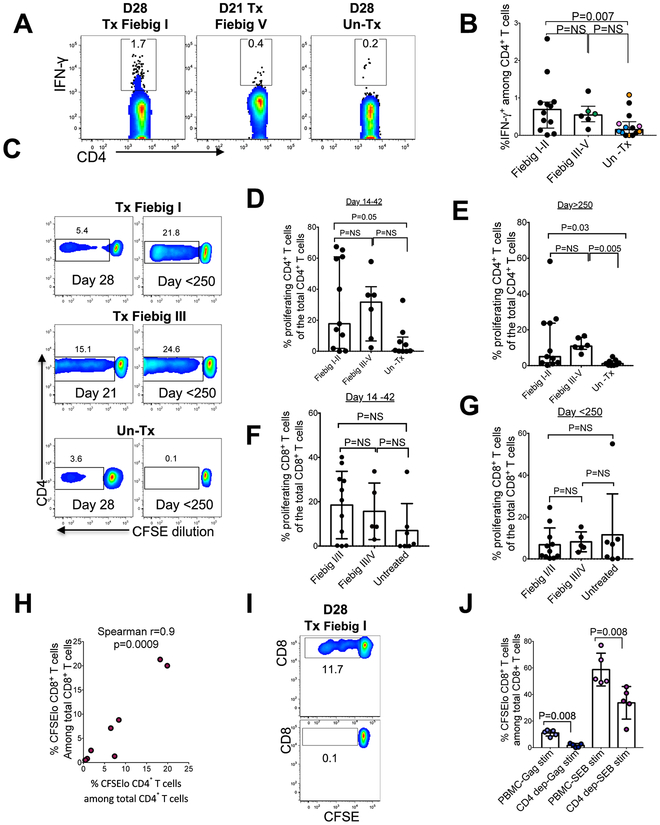
Sustained viremia after acute HIV infection is associated with profound CD4+ T cell loss and exhaustion of HIV-specific CD8+ T cell responses. To determine the impact of combination antiretroviral therapy (cART) on these processes, we examined the evolution of immune responses in acutely infected individuals initiating treatment before peak viremia. Immediate treatment of Fiebig stages I and II infection led to a rapid decline in viral load and diminished magnitude of HIV-specific (tetramer+) CD8+ T cell responses compared to untreated donors. There was a strong positive correlation between cumulative viral antigen exposure before full cART-induced suppression and immune responses measured by MHC class I tetramers, IFN-γ ELISPOT, and CD8+ T cell activation. HIV-specific CD8+ T responses of early treated individuals were characterized by increased CD127 and BCL-2 expression, greater in vitro IFN-γ secretion, and enhanced differentiation into effector memory (Tem) cells. Transcriptional analysis of tetramer+ CD8+ T cells from treated persons revealed reduced expression of genes associated with activation and apoptosis, with concurrent up-regulation of prosurvival genes including BCL-2, AXL, and SRC Early treatment also resulted in robust HIV-specific CD4+ T cell responses compared to untreated HIV-infected individuals. Our data show that limiting acute viremia results in enhanced functionality of HIV-specific CD4+ and CD8+ T cells, preserving key antiviral properties of these cells.


Conflict of interest statement

Competing interests: None.

Figures

Figure 1:
Figure 1:. Very early cART initiation is associated with the induction of HIV-specific CD8+ T cell responses that are lower in magnitude and breadth compared to untreated acute HIV infection
(a) Number of study participants tested in each of the three donor groups using ELISPOT assay. PBMCs were stimulated with individual overlapping peptides (OLP) spanning Gag, Nef, and Env proteins derived from HIV-1 clade C. (b) ELISPOT data denoting cumulative number of responses to clade C HIV Gag, Nef and Env peptides in 24 Fiebig I-II, 6 Fiebig III-V and 12 UnTx (c) Number of study participants tested in each group using the CFSE proliferation assays. PBMCs were stimulated with Gag, Nef, and Env peptide pools derived from HIV-1 clade C. One peptide pool was used for each protein (d) Cumulative percent of proliferating CD8+ T cells in response to Gag, Nef and Env HIV-1 clade C peptide pools in 20 Fiebig I-II, 6 Fiebig III-V and 6 UnTx. (e) Left column shows longitudinal plasma HIV RNA (red, RNA copies/ml plasma) and absolute CD4+ T cell counts (blue, CD4+ T lymphocytes/ul) before HIV infection and following onset of detectable plasma viremia in three representative individuals. The right column shows representative immunodominant tetramer positive responses for each subject measured at the peak of the response (D14 to D42 after diagnosis). The data are arranged according to treatment initiation status. (f) Number of responding and non-responding participants tested in each group using the MHC class I tetramers. (g) Frequencies of immunodominant tetramer+CD8+ T cells in Fiebig I-II, Fiebig III-V and untreated subjects in 21 Fiebig I-II, 8 Fiebig III-V and 11 UnTx. Statistical significance was calculated using multilevel mixed-effects linear regression analyses when comparing between groups to account for multiple measurements within some individuals. Black dots denote a single tetramer measurement per donor. Same coloured dots denote sum of multiple tetramer measurements from a single donor. Horizontal lines represent median with interquartile range.
Figure 2:
Figure 2:. Cumulative HIV antigen load correlates with the magnitude of HIV-specific CD8+ T cell responses
Correlation between HIV antigen burden prior to cART-induced complete plasma viral suppression defined as viremic copy days (VCD) and the frequency of (a) tetramer+CD8+ T cells in 21 Fiebig I-II, (b) breadth of CD8+ T cells in 21 Fiebig I-II and (c) frequency of activated (CD8+,CD38+, HLA-DR+) cells in 20 Fiebig I-II individuals respectively at 14 to 42 days after detection of plasma viremia. Spearman’s rank correlation test was used. Two tailed p values are reported.
Figure 3:
Figure 3:. HIV-specific CD8+ T cells in early treated individuals produce more IFN-γ and are more likely to express CD127 compared to untreated hyperacute HIV infection
HLA class I-tetramer binding cells were tested by ICS for IFN-γ production in response to HIV peptide stimulation. (a) Representative data for one Fiebig stage I-II treated, one Fiebig stage III-V treated subject and one untreated donor are shown. Flow panels are gated on IFN-γ-secreting cells. (b) Aggregate data depicting IFN-γ-secreting tetramer+ CD8+ T cells. Black dots denote a single measurement per donor in 5 Fiebig I-II, 4 Fiebig III-V and 6 UnTx. Same coloured dots denote multiple measurements from a single donor. (c) All flow plots gated on CD8+ T cells. The left column shows flow plots gated on tetramer+ cells (red dots). The right column shows tetramer+ cells (red dots) overlaid over total CD8+ T cells (gray background), (d) Aggregate for frequencies of CD127+ tetramer+ cells in 16 Fiebig I-II, 4 Fiebig III-V and 6 UnTx. Black dots denote a single measurement per donor, same coloured dots denote multiple measurements from a single donor. Samples were tested between 21–28 days after diagnosis, as indicated in the figures. Statistical significance for aggregate data was calculated using multilevel mixed-effects linear regression analyses when comparing between groups to account for multiple measurements within some individuals. Horizontal lines represent median with interquartile range.
Figure 4:
Figure 4:. HIV-specific CD8+ T cell responses in treated hyperacute and untreated hyperacute HIV infection have distinct transcriptional signatures
Transcriptional responses of CD8+ T cells in untreated (n=4) and early treated (n=4) individuals along the course of acute infection. (a) Timeline of collected RNA samples with samples binned into time-frames denoted by color. (b) Number of differentially expressed genes between HIV-specific CD8+ T cells from untreated and early treated individuals at various time-points. (c) Volcano plot depicting differentially expressed genes (False Discovery Ratio (FDR), q < 0.01, edgeR Likelihood Ratio Test) in HIV-specific CD8+ T cells at the two week time-frame frame comparing treated and untreated individuals. Genes of interest are annotated by name. (d) Heatmap depicting differentially expressed genes from (c), row normalized expression. (e) Scaled log normalized expression values of genes of interest. The significances reported were calculated as in (c).
Figure 5:
Figure 5:. The effect of transient antigen exposure on the functional quality of HIV-specific CD4+ and CD8+ T cell responses
(a) PBMCs isolated within 28 days of ART initiation were stained with a panel of MHC class I peptide-tetramers specific for HIV epitopes and antibodies against BCL-2. All flow plots are gated on CD8+ T cells. Upper panels show flow plots gated on tetramer+ CD8+ T cells for each HIV tetramer tested. The lower panel shows tetramer+ cells (red dots) overlaid on total CD8+ T cells (black background), (b) Aggregate BCL-2 expression on tetramer+ cells specific for CMV or HIV measured in 5 persons with CMV responses and 11 Fiebig I-II, 6 Fiebig III-V, 6 UnTx with HIV-specific responses. Black dots denote single measurement per donor, same coloured dots denote multiple measurements within a donor. (c) Representative results of direct killing activity of HIV-specific CD8+ T cells measured in a four-hour killing assay. Peptide-pulsed CFSEhi CD8-depleted cells designated as targets were mixed with CFSElo unpulsed control cells in a 1:1 ratio and co-incubated with autologous CD8+ T cells. Reduction in the CFSEhi population was compared to target cells pulsed with an irrelevant peptide. (d) The killing capacity was calculated as percent reduction in CFSEhi HIV peptide-pulsed targets relative to control ovalbumin (SIINFEKL) peptide-pulsed condition. 6 Fiebig I-II, 5 Fiebig III-V treated subjects and 5 UnTx were used for these experiments. Statistical significance for aggregated data (b and d) was determined using linear mixed-effects linear regression analyses when comparing between groups to account for multiple measurements within some individuals. Horizontal lines represent median with interquartile range.
Figure 6:
Figure 6:. Phenotypic characterization of HIV-specific CD8+ T cell responses in treated and untreated hyperacute HIV infection
HIV-specific (tetramer+) CD8+ T cell memory subpopulations defined using CD45RA, CD27 and CCR7 at 14 to 36 days after viremia using flow cytometry. These markers were used to discriminate three distinct memory populations: central memory Tcm (CD45RACD27+CCR7+), transitional memory Ttm (CD45RACD27+CCR7) and effector memory Tem (CD45RACD27CCR7). (a) Representative flow plots for early treated subjects and untreated subjects are shown. (b) Aggregate data for the frequencies of the three memory subsets in 11 Tx Fiebig I-II, 7 Tx Fiebig III-V, and 9 UnTx subjects, as well as 6 CMV responses in early treated subjects are shown. Statistical significance was calculated using two sided Mann Whitney test. Horizontal lines represent median with interquartile range. (c) Representative flow plot showing intra-donor differences in the phenotype of CMV and HIV specific CD8+ T cells in a Fiebig V treated donor is shown.
Figure 7:
Figure 7:. Longitudinal characterization of HIV-specific CD8+ T cell responses in treated and untreated hyperacute HIV infection
HIV-specific (tetramer+) CD8+ T cell memory subpopulations defined using CD45RA, CD27, and CCR7 during acute (14 to 36 days after diagnosis) and chronic (more that 250 days after diagnosis) infection. (a) Representative flow plots for a Fiebig I treated subject and aggregate data for the frequencies of the three memory subsets in 5 Tx Fiebig I-II treated subjects, (b) Representative flow plots for a Fiebig III treated subject and aggregate data for the frequencies of the three memory subsets in 5 Tx Fiebig III-V treated subjects, (c) Representative flow plots for one untreated subject and aggregate data for the frequencies of the three memory subsets in 4 UnTx subjects. The whiskers represents minimum and maximum values, P values were adjusted using Bonferroni-Dunn method.
Figure 8:
Figure 8:. Early treatment preserves HIV-specific CD4+ T cell responses
HIV-specific CD4+ T cell responses were measured by IFN-γ ICS after overnight incubation in the presence of overlapping HIV-1 clade C peptide pools. (a) Representative flow plots gated on IFN-γ-secreting CD4+ T cells. (b) Aggregate data for frequencies of IFN-γ-producing CD4+ T cells in response to Gag, Nef, and Env peptide pools in 12 Fiebig I-II, 5 Fiebig II-III and 9 Un Tx are shown. Black dots denote a single measurement per donor, same coloured dots denote multiple measurements within a donor. Statistical significance was determined using multilevel mixed-effects linear regression analyses when comparing between groups to account for multiple measurements within some individuals. Horizontal lines represent median with interquartile range. (c) Flow cytometry of CFSE-labelled CD4+ T cells for 1 representative donor from each group measured at day 21 and day >250. (d) Aggregate CD4+ T cell proliferative responses measured between 14 and 42 days after diagnosis. (e) Aggregate CD4+ T cell proliferative responses measured after 120 days after diagnosis Data in panel d and e were generated 11 Fiebig I-II, 6 Fiebig III-V and 9 UnTx. (f) Aggregate CD8+ T cell proliferative responses measured between 14 and 42 days after diagnosis. (g) Aggregate CD8+ T cell proliferative responses measured 120 days after diagnosis. Data in panels f and g were generated from 11 Fiebig I-II, 5 Fiebig III-V and 7 UnTx persons. Statistical significance was determined using two tailed Mann-Whitney test. (h) Correlation between CD4+ and CD8+ T cell proliferative responses in 8 Fiebig I-II treated donors. Spearman’s rank correlation test was used. Two tailed p values are reported. (i) Representative flow plot depicting CD8+ T cell proliferation in unfractionated PBMC and in CD4-depleted PBMC. (j) Aggregate CD8+ T cell proliferative responses to HIV antigens with and without CD4+ T cells in 5 Tx Fiebig I-II donors. Statistical significance was determined using two tailed Mann-Whitney test. Horizontal lines represent median with interquartile range.

Similar articles

Cited by

  • The Role of Natural Killer Cells and Their Metabolism in HIV-1 Infection.
    Naidoo KK, Altfeld M. Naidoo KK, et al. Viruses. 2024 Oct 9;16(10):1584. doi: 10.3390/v16101584. Viruses. 2024. PMID: 39459918 Free PMC article. Review.
  • Immune mobilising T cell receptors redirect polyclonal CD8+ T cells in chronic HIV infection to form immunological synapses.
    Wallace Z, Kopycinski J, Yang H, McCully ML, Eggeling C, Chojnacki J, Dorrell L. Wallace Z, et al. Sci Rep. 2022 Nov 1;12(1):18366. doi: 10.1038/s41598-022-23228-3. Sci Rep. 2022. PMID: 36319836 Free PMC article.
  • What's Hot in HIV in 2019-A Basic and Translational Science Summary for Clinicians From IDWeek 2019.
    Titanji B, Kelley CF. Titanji B, et al. Open Forum Infect Dis. 2020 Feb 13;7(3):ofaa053. doi: 10.1093/ofid/ofaa053. eCollection 2020 Mar. Open Forum Infect Dis. 2020. PMID: 32154324 Free PMC article. Review.
  • Evolution and Diversity of Immune Responses during Acute HIV Infection.
    Kazer SW, Walker BD, Shalek AK. Kazer SW, et al. Immunity. 2020 Nov 17;53(5):908-924. doi: 10.1016/j.immuni.2020.10.015. Immunity. 2020. PMID: 33207216 Free PMC article. Review.
  • Guidelines for the use of flow cytometry and cell sorting in immunological studies (third edition).
    Cossarizza A, Chang HD, Radbruch A, Abrignani S, Addo R, Akdis M, Andrä I, Andreata F, Annunziato F, Arranz E, Bacher P, Bari S, Barnaba V, Barros-Martins J, Baumjohann D, Beccaria CG, Bernardo D, Boardman DA, Borger J, Böttcher C, Brockmann L, Burns M, Busch DH, Cameron G, Cammarata I, Cassotta A, Chang Y, Chirdo FG, Christakou E, Čičin-Šain L, Cook L, Corbett AJ, Cornelis R, Cosmi L, Davey MS, De Biasi S, De Simone G, Del Zotto G, Delacher M, Di Rosa F, Di Santo J, Diefenbach A, Dong J, Dörner T, Dress RJ, Dutertre CA, Eckle SBG, Eede P, Evrard M, Falk CS, Feuerer M, Fillatreau S, Fiz-Lopez A, Follo M, Foulds GA, Fröbel J, Gagliani N, Galletti G, Gangaev A, Garbi N, Garrote JA, Geginat J, Gherardin NA, Gibellini L, Ginhoux F, Godfrey DI, Gruarin P, Haftmann C, Hansmann L, Harpur CM, Hayday AC, Heine G, Hernández DC, Herrmann M, Hoelsken O, Huang Q, Huber S, Huber JE, Huehn J, Hundemer M, Hwang WYK, Iannacone M, Ivison SM, Jäck HM, Jani PK, Keller B, Kessler N, Ketelaars S, Knop L, Knopf J, Koay HF, Kobow K, Kriegsmann K, Kristyanto H, Krueger A, Kuehne JF, Kunze-Schumacher H, Kvistborg P, Kwok I, Latorre D, Lenz D, Levings MK, Lino AC, Liotta F, Long HM, Lugli E, MacDonald KN, M… See abstract for full author list ➔ Cossarizza A, et al. Eur J Immunol. 2021 Dec;51(12):2708-3145. doi: 10.1002/eji.202170126. Epub 2021 Dec 7. Eur J Immunol. 2021. PMID: 34910301 Free PMC article. Review.

References

    1. Siliciano JD, Siliciano RF. 2016. Recent developments in the effort to cure HIV infection: going beyond N = 1. J Clin Invest 126:409–414. - PMC - PubMed
    1. Fauci AS, Marston HD. 2015. Ending the HIV-AIDS Pandemic--Follow the Science. N Engl J Med 373:2197–2199. - PubMed
    1. Mellors JW, Rinaldo CR Jr., Gupta P, White RM, Todd JA, Kingsley LA. 1996. Prognosis in HIV-1 infection predicted by the quantity of virus in plasma. Science 272:1167–1170. - PubMed
    1. Rodriguez B, Sethi AK, Cheruvu VK, Mackay W, Bosch RJ, Kitahata M, Boswell SL, Mathews WC, Bangsberg DR, Martin J, Whalen CC, Sieg S, Yadavalli S, Deeks SG, Lederman MM. 2006. Predictive value of plasma HIV RNA level on rate of CD4 T-cell decline in untreated HIV infection. Jama 296:1498–1506. - PubMed
    1. Lyles RH, Munoz A, Yamashita TE, Bazmi H, Detels R, Rinaldo CR, Margolick JB, Phair JP, Mellors JW. 2000. Natural history of human immunodeficiency virus type 1 viremia after seroconversion and proximal to AIDS in a large cohort of homosexual men. Multicenter AIDS Cohort Study. J Infect Dis 181:872–880. - PubMed

Publication types

MeSH terms