. 2019 Apr 10:10:756.
doi: 10.3389/fimmu.2019.00756. eCollection 2019.

Sequential Immunization With Live-Attenuated Chimeric Hemagglutinin-Based Vaccines Confers Heterosubtypic Immunity Against Influenza A Viruses in a Preclinical Ferret Model

Affiliations

Sequential Immunization With Live-Attenuated Chimeric Hemagglutinin-Based Vaccines Confers Heterosubtypic Immunity Against Influenza A Viruses in a Preclinical Ferret Model

Wen-Chun Liu et al. Front Immunol. .

Abstract

Due to continuous antigenic drift and occasional antigenic shift, influenza viruses escape from human adaptive immunity resulting in significant morbidity and mortality in humans. Therefore, to avoid the need for annual reformulation and readministration of seasonal influenza virus vaccines, we are developing a novel chimeric hemagglutinin (cHA)-based universal influenza virus vaccine, which is comprised of sequential immunization with antigens containing a conserved stalk domain derived from a circulating pandemic H1N1 strain in combination with "exotic" head domains. Here, we show that this prime-boost sequential immunization strategy redirects antibody responses toward the conserved stalk region. We compared the vaccine efficacy elicited by distinct vaccination approaches in the preclinical ferret model of influenza. All ferrets immunized with cHA-based vaccines developed stalk-specific and broadly cross-reactive antibody responses. Two consecutive vaccinations with live-attenuated influenza viruses (LAIV-LAIV) conferred superior protection against pH1N1 and H6N1 challenge infection. Sequential immunization with LAIV followed by inactivated influenza vaccine (LAIV-IIV regimen) also induced robust antibody responses. Importantly, the LAIV-LAIV immunization regimen also induced HA stalk-specific CD4+IFN-γ+ and CD8+IFN-γ+ effector T cell responses in peripheral blood that were recalled by pH1N1 viral challenge. The findings from this preclinical study suggest that an LAIV-LAIV vaccination regimen would be more efficient in providing broadly protective immunity against influenza virus infection as compared to other approaches tested here.

Keywords: chimeric hemagglutinin; ferret; heterosubtypic protection; live-attenuated influenza vaccine; stalk antibody; universal influenza virus vaccine.


Figures

Figure 1
Figure 1
Overview of the pH1N1 viral challenge study design. The timeline and experimental groups for the pH1N1 challenge study are outlined. Ferrets in the cHA vaccination groups were unprimed or primed with an influenza B-cH9/1 virus. All cHA vaccination groups except for the mock animals received a booster immunization of cH8/1 LAIV on day 21, followed by a second booster immunization on day 49 with cH11/1 LAIV or cH5/1 IIV vaccine (with adjuvant AS03) to boost stalk-specific antibodies. Mock immunization controls received plain allantoic fluid (mock group). All ferrets were challenged with pH1N1 (Cal/09) influenza A virus on day 91, and sample specimens were collected on days 1, 3, and 4 post-challenge infection.
Figure 2
Figure 2
Vaccine-specific antibody titers measured by hemagglutination inhibition assay. Pre-challenge (day 91) hemagglutination inhibition (HI) titers against (A) cH9/1, (B) cH8/1, (C) cH11/1, and (D) cH5/1 viruses were measured prior to pH1N1 influenza A virus challenge infection. Y-axis indicates HI titers against the different virus strains. LAIV-LAIV vaccinated animals are shown as blue circles. Single dose of LAIV vaccinated animals are shown as red triangles. LAIV followed by AS03-adjuvanted IIV vaccinated animals are shown as green circles. Mock-immunized animals are shown as black circles. Empty symbols denote unprimed. Closed symbols denote B-cH9/1 virus prime immunization. White bars indicate the geometric mean titers (GMT) with individual scatter dot plots. Each point indicates the titer for each individual ferret (n = 4 or 8 /group). The black dashed line indicates the limit of detection for the assay. Data were analyzed by one-way ANOVA with Tukey multiple comparisons test. The asterisks refer to the level of significance. *p < 0.05.
Figure 3
Figure 3
H1 stalk- and N1-specific antibody titers measured by ELISA and/or ELLA. The IgG antibody responses were measured on days 0, 21, 49, and/or 91. (A) H1 stalk serum IgG and (B) H1 stalk serum IgA mean endpoint titers ± standard error of the mean (SEM) against cH6/1 protein were indicated. (C) N1 serum total IgG titer against N1 (Cal/09) protein by ELISA is plotted on the y-axis. Each point indicates the GMT for each individual animal (n = 4 or 8/ group). The white bars indicate the averaged endpoint titer of each experimental group. The black dashed line indicates the limit of detection for the assay. (D) Fetuin-based enzyme-linked lectin assays were used to measure NA-inhibiting-antibody titers as reductions in the N1 NA enzymatic activities of the H7N1 viruses. The percentage of NA-inhibiting curves were graphed in Figure S2C. Corresponding IC50 values were determined as the 50% reduction in the NA enzymatic activities of H7malN1Cal09 virus strain. Data in (A,B) were analyzed by two-way ANOVA followed by a Tukey's multiple comparison test (multiple time points). Data in (C,D) were compared to mock vaccinated animals with one-way ANOVA followed by a Dunnett's multiple comparison test (single time point). ns, no significant difference. The asterisks refer to the level of significance: *p < 0.05; **p < 0.01; ***p < 0.001.
Figure 4
Figure 4
Breadth of antibody responses measured by ELISA. Serum IgG endpoint titers (y-axis) against group 1 (A) H1, (B) H2, (C) H18, and group 2 (D) H3 were measured prior to pH1N1 challenge infection (day 91). LAIV-LAIV vaccinated animals are shown as blue circles. Single dose of LAIV vaccinated animals are shown as red triangles. LAIV followed by AS03-adjuvanted IIV vaccinated animals are shown as green circles. Mock-immunized animals are shown as black circles. Empty symbols denote unprimed. Closed symbols denote B-cH9/1 prime immunization. White bars indicate the GMT with individual scatter dot plots. Each point indicates the endpoint titer for each individual ferret (n = 4 or 8/group). Data were compared to Prime-LAIV-LAIV vaccinated animals with one-way ANOVA followed by a Dunnett's multiple comparison test. ns, no significant difference. The asterisks refer to the level of significance, *p < 0.05; **p < 0.01; ***p < 0.001.
Figure 5
Figure 5
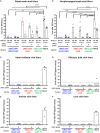
Viral replication post pH1N1 (106 PFU) challenge infection. Viral titers of each vaccinated group or mock animals were measured by plaque assay. LAIV-LAIV vaccinated animals are shown as blue circles. Single dose of LAIV vaccinated animals are shown as red triangles. LAIV followed by AS03-adjuvanted IIV vaccinated animals are shown as green circles. Mock-immunized animals are shown as black circles. Empty symbols denote unprimed. Closed symbols denote B-cH9/1 virus prime immunization. White bars indicate the GMT with individual scatter dot plots. Each point indicates the titer for each individual ferret (n = 4 or 8/group). The black dashed line indicates the limit of detection for the assay. (A) Nasal wash and (B) Oropharyngeal swab viral titers were measured on days 1 and 3 post infection. (C) Nasal turbinate, (D) olfactory bulb viral titers in the upper respiratory tract, and (E) trachea, (F) lung (left medial bronchus of the upper lobe) viral titers in the lower respiratory tract were determined on day 4 post challenge. Groups in (A) and (B) were compared to mock vaccinated animals with one-way ANOVA followed by a Dunnett's multiple comparison test. The asterisks refer to the level of significance. *p < 0.05; **p < 0.01; ***p < 0.001; ****p < 0.0001.
Figure 6
Figure 6
Overview of the H6N1 viral challenge study design. The timeline and experimental groups for the H6N1 challenge study are outlined. All cHA-based vaccinated ferrets were prime immunized with B-cH9/1 virus, followed by booster immunization with cH8/1 LAIV or AS03-adjuvanted cH8/1 IIV on day 35, followed by a second booster immunization with cH11/1 LAIV or AS03-adjuvanted cH5/1 IIV on day 56. In addition, a prime-only, QIV-QIV, H3N2 LAIV, or mock-vaccinated ferrets were included as control groups. All ferrets were challenged with the H6N1 (tk/97) influenza A virus on day 77, and sample specimens were collected on days 1, 3, and 4 post-challenge infection.
Figure 7
Figure 7
Vaccine-specific antibody titers measured by hemagglutination inhibition assay. Pre-challenge (day 77) hemagglutination inhibition (HI) titers against (A) cH9/1, (B) cH8/1, (C) H3N2, (D) cH11/1, (E) cH5/1, and (F) H6N1 viruses were measured prior to H6N1 influenza A virus challenge infection. Y-axis indicates HI titers against the different virus strains. LAIV-LAIV vaccinated animals are shown in blue. LAIV followed by AS03-adjuvanted IIV vaccinated animals are shown in green. Two doses of AS03-adjuvanted IIV vaccinated animals are shown in red. Prime only, two doses of QIV, and single dose of H3N2 LAIV vaccinated animals are shown in light blue, purple, and orange, respectively. Mock-immunized animals are shown as black. All cHA-vaccinated ferrets were primed with influenza B-cH9/1 virus. White bars indicate the GMT with individual scatter dot plots. Each point indicates the titer for each individual ferret (n = 4/group). The black dashed line indicates the limit of detection for the assay. Data were analyzed by one-way ANOVA with Tukey multiple comparisons test. ns, no significant difference. The asterisks refer to the level of significance. *p < 0.05; **p < 0.01.
Figure 8
Figure 8
Viral shedding post H6N1 (106 PFU) challenge infection. Viral titers of each vaccinated group or mock animals were measured by plaque assay. LAIV-LAIV vaccinated animals are shown in blue. LAIV followed by AS03-adjuvanted IIV vaccinated animals are shown in green. Two doses of AS03-adjuvanted IIV vaccinated animals are shown in red. Prime only, two doses of QIV, and single dose of H3N2 LAIV vaccinated animals are shown in light blue, purple, and orange, respectively. Mock-immunized animals are shown in black. All cHA-vaccinated ferrets were primed with influenza B-cH9/1 virus. White bars indicate the GMT with individual scatter dot plots. Each point indicates the titer for each individual ferret (n = 4/group). The black dashed line indicates the limit of detection for the assay. (A) Nasal wash and (B) Oropharyngeal swab viral titers were measured on days 1 and 3 post infection. (C) Nasal turbinate and (D) Olfactory bulb viral titers in the upper respiratory tract were determined on day 4 post challenge. Groups in (A) and (B) were analyzed by two-way ANOVA followed by a Tukey's multiple comparison test (multiple time points). Groups in (C) and (D) were analyzed by one-way ANOVA followed by a Tukey's multiple comparison test (single time point). The asterisks refer to the level of significance: *p < 0.05.
Figure 9
Figure 9
Analysis of antigen-specific T cell responses in PBMCs by flow cytometry. (A) Ten peptide sequences corresponding to predicted T cell epitopes within the Cal/09 (H1N1) stalk domain were identified by computational analysis. Alignments of the HA stalk peptides between Cal/09 (H1N1) and tk/97 (H6N1) are summarized. Non-conserved amino acids are indicated. Influenza virus HA stalk-specific, NP-specific and gp-120-specific T cell responses from PBMCs are shown for the Prime-LAIV-LAIV (blue circles), Prime-LAIV-IIV (green circles), or naïve animals (white diamonds) following challenge infection with pH1N1 influenza virus (B) or H6N1 influenza virus (C). X-axis indicates influenza HA stalk-specific, NP-specific, and irrelevant peptide gp120-specific CD3+IFN-γ+, CD4+IFN-γ+ or CD8+IFN-γ+ T cells. Fold changes in mean fluorescence intensity (MFI) of IFN-γ expressions over the MFI of naïve animals were calculated and plotted on the y-axis. One sample for a Prime-LAIV-IIV vaccinated ferret in (C) was contaminated and was not included in the analysis. Each point indicates the fold-change in MFI of activated T cells for each individual ferret. The black dashed line indicates the averaged baseline responses of naïve animals. Data were analyzed by two-way ANOVA followed by a Tukey's multiple comparison test (different peptides stimulation). The asterisks refer to the level of significance: *p < 0.05; **p < 0.01; ***p < 0.001.

Similar articles

Cited by

References

    1. Garten R, Blanton L, Elal AIA, Alabi N, Barnes J, Biggerstaff M, et al. . Update: Influenza activity in the united states during the 2017-18 season and composition of the 2018-19 influenza vaccine. MMWR. (2018) 67:634–42. 10.15585/mmwr.mm6722a4 - DOI - PMC - PubMed
    1. Bouvier NM. The future of influenza vaccines: a historical and clinical perspective. Vaccines. (2018) 6:30058. 10.3390/vaccines6030058 - DOI - PMC - PubMed
    1. Paules CI, Marston HD, Eisinger RW, Baltimore D, Fauci AS. The pathway to a universal influenza vaccine. Immunity. (2017) 47:599–603. 10.1016/j.immuni.2017.09.007 - DOI - PubMed
    1. Tricco AC, Chit A, Soobiah C, Hallett D, Meier G, Chen MH, et al. . Comparing influenza vaccine efficacy against mismatched and matched strains: a systematic review and meta-analysis. BMC Med. (2013) 11:153. 10.1186/1741-7015-11-153 - DOI - PMC - PubMed
    1. Gerdil C. The annual production cycle for influenza vaccine. Vaccine. (2003) 21:1776–9. 10.1016/S0264-410X(03)00071-9 - DOI - PubMed

Publication types

MeSH terms