Glycoproteogenomics: A Frequent Gene Polymorphism Affects the Glycosylation Pattern of the Human Serum Fetuin/α-2-HS-Glycoprotein
- PMID: 31097672
- PMCID: PMC6683009
- DOI: 10.1074/mcp.RA119.001411
Glycoproteogenomics: A Frequent Gene Polymorphism Affects the Glycosylation Pattern of the Human Serum Fetuin/α-2-HS-Glycoprotein
Abstract
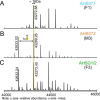
Fetuin, also known as α-2-HS-glycoprotein (gene name: AHSG), is one of the more abundant glycoproteins secreted into the bloodstream. There are two frequently occurring alleles of human AHSG, resulting in three genotypes (AHSG*1, AHSG*2, and heterozygous AHSG1/2). The backbone amino acid sequences of fetuin coded by the AHSG*1 and AHSG*2 genes differ in two amino acids including one known O-glycosylation site (aa position 256). Although fetuin levels have been extensively studied, the originating genotype is often ignored in such analysis. As fetuin has been suggested repeatedly as a potential biomarker for several disorders, the question whether the gene polymorphism affects the fetuin profile is of great interest. In this work, we describe detailed proteoform profiles of fetuin, isolated from serum of 10 healthy and 10 septic patient individuals and investigate potential glycoproteogenomics correlations, e.g. how gene polymorphisms affect glycosylation. We established an efficient method for fetuin purification from individuals' serum using ion-exchange chromatography. Subsequently, we performed hybrid mass spectrometric approaches integrating data from native mass spectra and peptide-centric MS analysis. Our data reveal a crucial effect of the gene polymorphism on the glycosylation pattern of fetuin. Moreover, we clearly observed increased fucosylation in the samples derived from the septic patients. Our serum proteoform analysis, targeted at one protein obtained from 20 individuals, exposes the wide variability in proteoform profiles, which should be taken into consideration when using fetuin as biomarker. Importantly, focusing on a single or few proteins, the quantitative proteoform profiles can provide, as shown here, already ample data to classify individuals by genotype and disease state.
Keywords: Glycoproteins*; Glycoproteomics; Plasma or serum analysis; Post-translational modifications*; Protein Identification*; fetuin.
© 2019 Lin et al.
Figures


Similar articles
-
Similar Albeit Not the Same: In-Depth Analysis of Proteoforms of Human Serum, Bovine Serum, and Recombinant Human Fetuin.J Proteome Res. 2018 Aug 3;17(8):2861-2869. doi: 10.1021/acs.jproteome.8b00318. Epub 2018 Jul 13. J Proteome Res. 2018. PMID: 29966421 Free PMC article.
-
Minor variant of AHSG gene 767C>G polymorphism may decrease the risk of gestational diabetes mellitus.J Obstet Gynaecol. 2020 Apr;40(3):303-307. doi: 10.1080/01443615.2019.1621810. Epub 2019 Jul 24. J Obstet Gynaecol. 2020. PMID: 31339395
-
Association of AHSG gene polymorphisms with serum Fetuin-A levels in individuals with cardiovascular calcification in west of Iran.Mol Biol Rep. 2020 Mar;47(3):1809-1820. doi: 10.1007/s11033-020-05275-z. Epub 2020 Jan 30. Mol Biol Rep. 2020. PMID: 32002794
-
The "thrifty" gene encoding Ahsg/Fetuin-A meets the insulin receptor: Insights into the mechanism of insulin resistance.Cell Signal. 2011 Jun;23(6):980-90. doi: 10.1016/j.cellsig.2010.11.003. Epub 2010 Nov 16. Cell Signal. 2011. PMID: 21087662 Review.
-
From infancy to aging: Biological and behavioral modifiers of Fetuin-A.Biochimie. 2016 May;124:141-149. doi: 10.1016/j.biochi.2015.12.016. Epub 2015 Dec 29. Biochimie. 2016. PMID: 26740309 Review.
Cited by
-
Malignant tissues produce divergent antibody glycosylation of relevance for cancer gene therapy effectiveness.MAbs. 2020 Jan-Dec;12(1):1792084. doi: 10.1080/19420862.2020.1792084. MAbs. 2020. PMID: 32643525 Free PMC article.
-
Genetics meets proteomics: perspectives for large population-based studies.Nat Rev Genet. 2021 Jan;22(1):19-37. doi: 10.1038/s41576-020-0268-2. Epub 2020 Aug 28. Nat Rev Genet. 2021. PMID: 32860016 Review.
-
Proteomic Profiling of Early Secreted Proteins in Response to Lipopolysaccharide-Induced Vascular Endothelial Cell EA.hy926 Injury.Biomedicines. 2023 Nov 15;11(11):3065. doi: 10.3390/biomedicines11113065. Biomedicines. 2023. PMID: 38002065 Free PMC article.
-
Discrepancies between High-Resolution Native and Glycopeptide-Centric Mass Spectrometric Approaches: A Case Study into the Glycosylation of Erythropoietin Variants.J Am Soc Mass Spectrom. 2021 Aug 4;32(8):2099-2104. doi: 10.1021/jasms.1c00060. Epub 2021 Apr 15. J Am Soc Mass Spectrom. 2021. PMID: 33856811 Free PMC article.
-
Exploring the glycosylation of mucins by use of O-glycodomain reporters recombinantly expressed in glycoengineered HEK293 cells.J Biol Chem. 2022 Apr;298(4):101784. doi: 10.1016/j.jbc.2022.101784. Epub 2022 Mar 2. J Biol Chem. 2022. PMID: 35247390 Free PMC article.
References
-
- Dziegielewska K. M., Møllgård K., Reynolds M. L., and Saunders N. R. (1987) A fetuin-related glycoprotein (α2HS) in human embryonic and fetal development. Cell Tissue Res. 248, 33–41 - PubMed
-
- Jahnen-dechent LBW. (2013) The Role of Fetuin-A in Physiological and Pathological Mineralization. Calcif. Tissue Int. 93, 355–364 - PubMed
Publication types
MeSH terms
Substances
LinkOut - more resources
Full Text Sources
Research Materials
Miscellaneous

