. 2019 May 15;20(10):2399.
doi: 10.3390/ijms20102399.

HER2-Specific Targeted Toxin DARPin-LoPE: Immunogenicity and Antitumor Effect on Intraperitoneal Ovarian Cancer Xenograft Model

Affiliations

HER2-Specific Targeted Toxin DARPin-LoPE: Immunogenicity and Antitumor Effect on Intraperitoneal Ovarian Cancer Xenograft Model

Evgeniya A Sokolova et al. Int J Mol Sci. .

Abstract

High immunogenicity and systemic toxicity are the main obstacles limiting the clinical use of the therapeutic agents based on Pseudomonas aeruginosa exotoxin A. In this work, we studied the immunogenicity, general toxicity and antitumor effect of the targeted toxin DARPin-LoPE composed of HER2-specific DARPin and a low immunogenic exotoxin A fragment lacking immunodominant human B lymphocyte epitopes. The targeted toxin has been shown to effectively inhibit the growth of HER2-positive human ovarian carcinoma xenografts, while exhibiting low non-specific toxicity and side effects, such as vascular leak syndrome and liver tissue degradation, as well as low immunogenicity, as was shown by specific antibody titer. This represents prospects for its use as an agent for targeted therapy of HER2-positive tumors.

Keywords: DARPin; HER2; Pseudomonas exotoxin A; far-red fluorescent protein; immunogenicity; ovarian carcinoma; targeted therapy.


Conflict of interest statement

The authors declare no conflict of interest.

Figures
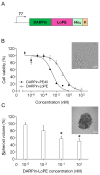
Figure 1
Figure 1
Targeted toxin DARPin-LoPE and its cytotoxicity against human carcinoma 2D and 3D models in vitro. (A) Gene construct encoding DARPin-LoPE. DARPin (dark green), HER2-specific DARPin9.29; LoPE (purple), truncated Pseudomonas exotoxin A deprived of domains Ia, Ib, most of domain II and human B cells epitopes; His6 (light green), C-terminal hexahistidine tag; K (orange), KDEL sequence. The fusion gene is under control of the T7 promoter; (B) Relative viability of the HER2-positive human ovarian adenocarcinoma cells SKOV3.ip1 in 2D monolayer culture (MTT assay) after a 72 h treatment with different concentrations of DARPin-PE40 (black circles) or DARPin-LoPE (transparent triangles); (C) Relative volume of 3D spheroids of the HER2-positive human ovarian adenocarcinoma cells SKOV-kat after a 96 h treatment with different concentrations of DARPin-LoPE. The data are represented as mean ± SEM. “*” indicates a value that significantly differs from the respective control value at p < 0.05 (Dunnett’s test, n = 6).
Figure 2
Figure 2
Scheme of the study of DARPin-LoPE and DARPin-PE40 general toxicity and immunogenicity. “0” denotes the analysis of the parameters studied in animals before the treatment course started. The day of the first injection of the targeted toxins was set as day 1. Treatment with the targeted toxins was performed in two courses of four injections every other day, with a break of one month between courses, i.e., on days 1, 3, 5, 7 (first course) and 40, 42, 44 and 46 (second course). The leucocytes were analyzed by flow cytometry on days 8 and 17 after the start of each course (i.e., on days 8, 17, 47 and 56, marked in red). The activity of alanine aminotransferase (ALT) and aspartate aminotransferase (AST) in the serum was measured on days 6 and 18 after the start of each course (i.e., on days 6, 18, 45 and 57, marked in blue). The antibody titer test was performed two and three weeks after the first treatment course ended, and two and five weeks after the second treatment course ended (i.e., on days 20, 27, 60 and 80, marked in green). Animals were euthanized on day 90, and organs were taken for histological study (marked in black).
Figure 3
Figure 3
Mean weight of mice in different groups. The days of the targeted toxins injections are indicated with arrows (4 injections per course, 2 courses). PBS, mice treated with phosphate-buffered saline (control group); DARPin-LoPE 4 × 10 µg, mice treated with 10 µg DARPin-LoPE for 4 doses every other day (40 µg per course, 80 µg total); DARPin-LoPE 4 × 20 µg, mice treated with 20 µg DARPin-LoPE for 4 doses every other day (80 µg per course, 160 µg total); DARPin-PE40 4 × 10 µg, mice treated with 10 µg DARPin-PE40 for 4 doses every other day (40 µg per course, 80 µg total). The data are represented as mean ± SEM. “*” indicates a value that significantly differs from the respective control value at p < 0.05 (Student’s test with Bonferroni correction, n = 5).
Figure 4
Figure 4
Hematoxilin and eosin staining of organ sections of mice in different groups. Degenerative tissue lesions upon treatment with the targeted toxins are indicated with arrows. In mice treated with 4 × 10 μg DARPin-PE40 the portion of the white pulp of spleen is increased in a zone of periarteriolar sheaths. In mice treated with 4 × 10 μg DARPin-PE40 or 4 × 20 μg DARPin-LoPE the peribronchovascular space is dilatated in the lungs, as well as hemorrhage and necrosis sites are observed in kidneys. For spleen images scale bar is 200 µm, magnification ×100; for lung, kidney, heart and liver scale bar is 100 µm, magnification ×200.
Figure 5
Figure 5
Dynamics of titers of antibodies specific to the targeted toxins. The day of the first injection of the targeted toxins was set as day 1. 0 is for the measurements of antibody titers in mice serum before the first treatment course started. PBS, mice treated with phosphate-buffered saline (control group); DARPin-LoPE 4 × 10 µg, mice treated with 10 µg DARPin-LoPE for 4 doses every other day (40 µg per course, 80 µg total); DARPin-LoPE 4 × 20 µg, mice treated with 20 µg DARPin-LoPE for 4 doses every other day (80 µg per course, 160 µg total); DARPin-PE40 4 × 10 µg, mice treated with 10 µg DARPin-PE40 for 4 doses every other day (40 µg per course, 80 µg total).“*” indicates a value that significantly differs from the respective control (PBS) value at p < 0.05; “#” indicates a value that significantly differs from the respective values in groups DARPin-LoPE 4 × 10 µg and DARPin-LoPE 4 × 20 µg at p < 0.05 (Student’s test with Bonferroni correction, n = 5). The data are represented as mean ± SEM.
Figure 6
Figure 6
Fluorescent human ovarian carcinoma cells SKOVip-kat and their response to DARPin-LoPE treatment in vitro. (A) Visualization of SKOVip-kat cells expressing protein Katushka (red) in transmitted light (on the top) and by confocal microscopy (on the bottom). Image size 135 × 135 µm; (B) Analysis of surface content of the HER2 protein on SKOVip-kat cells stained with FITC-labeled anti-HER2 antibody (red filling) or with FITC-labeled isotypic control (blue filling) and analyzed by flow cytometry; (C) Relative viability of SKOVip-kat cells in 2D monolayer culture (MTT assay) after a 72 h treatment with different concentrations of DARPin-LoPE. The data are represented as mean ± SEM.
Figure 7
Figure 7
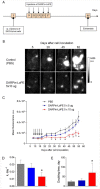
In vivo study of DARPin-LoPE against SKOVip-kat fluorescent tumor xenografts in athymic mice. (A) The scheme of the experiment. The day of i.p. inoculation of 4 × 10⁶ SKOVip-kat cells to animals was set as day 1; (B) Sequential in vivo fluorescence images of the peritoneum of control mice (injection of PBS) and mice treated with 5 × 10 µg DARPin-LoPE. In vivo 2D fluorescence images were acquired using whole-body fluorescence imaging setup with planar epi-illumination geometry. Image size 3 × 5 cm; (C) Tumor progression measured by in vivo fluorescence whole-body imaging in animals treated with PBS (control, black curve), 5 × 5 µg DARPin-LoPE (blue curve) or 5 × 10 µg DARPin-LoPE (red curve). The days of the targeted toxin injections are indicated with arrows; (D) Tumor growth rate coefficient (k) in different groups of animals; (E) Tumor doubling time in different groups of animals. The data are represented as mean ± SEM. “*” indicates a value that significantly differs from the respective control value at p < 0.05 (Dunnett’s test, n = 5–8).

Similar articles

Cited by

References

    1. Kutova O.M., Guryev E.L., Sokolova E.A., Alzeibak R., Balalaeva I.V. Targeted Delivery to Tumors: Multidirectional Strategies to Improve Treatment Efficiency. Cancers. 2019;11:68. doi: 10.3390/cancers11010068. - DOI - PMC - PubMed
    1. Madhumathi J., Verma R.S. Therapeutic targets and recent advances in protein immunotoxins. Curr. Opin. Microbiol. 2012;15:300–309. doi: 10.1016/j.mib.2012.05.006. - DOI - PubMed
    1. Serna N., Sanchez-Garcia L., Unzueta U., Diaz R., Vazquez E., Mangues R., Villaverde A. Protein-Based Therapeutic Killing for Cancer Therapies. Trends Biotechnol. 2018;36:318–335. doi: 10.1016/j.tibtech.2017.11.007. - DOI - PubMed
    1. Pluckthun A. Designed ankyrin repeat proteins (DARPins): Binding proteins for research, diagnostics, and therapy. Annu. Rev. Pharmacol. Toxicol. 2015;55:489–511. doi: 10.1146/annurev-pharmtox-010611-134654. - DOI - PubMed
    1. Shapira A., Benhar I. Toxin-based therapeutic approaches. Toxins. 2010;2:2519–2583. doi: 10.3390/toxins2112519. - DOI - PMC - PubMed

MeSH terms