. 2019 Jul 1;218(7):2232-2246.
doi: 10.1083/jcb.201810118. Epub 2019 May 15.

Rab46 integrates Ca2+ and histamine signaling to regulate selective cargo release from Weibel-Palade bodies

Affiliations

Rab46 integrates Ca2+ and histamine signaling to regulate selective cargo release from Weibel-Palade bodies

Katarina T Miteva et al. J Cell Biol. .

Abstract

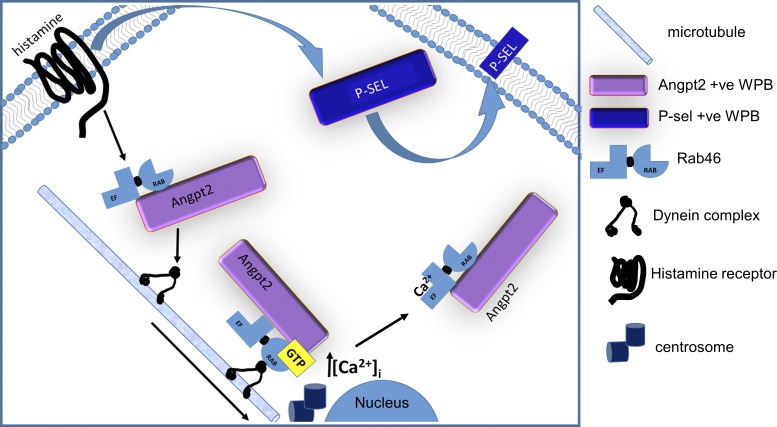
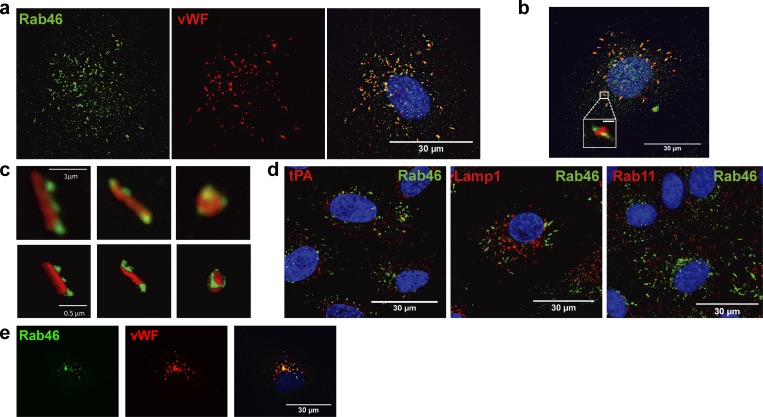
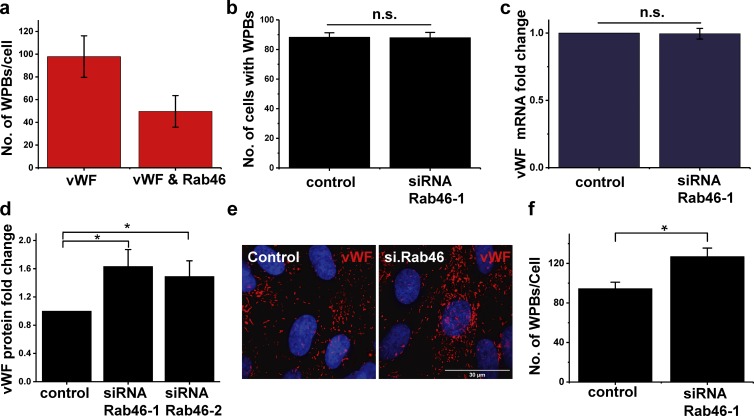
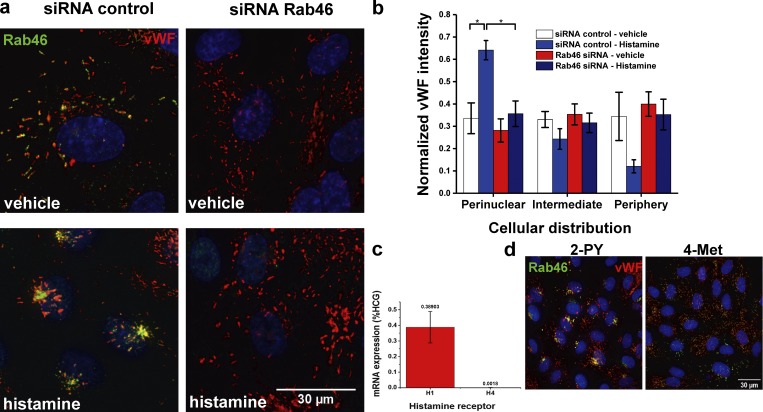
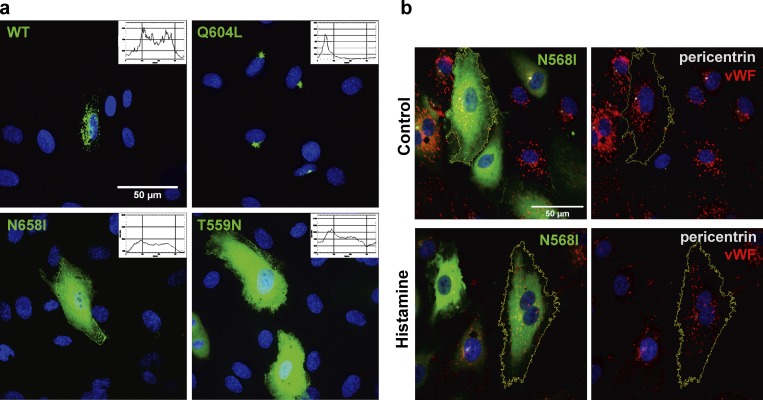
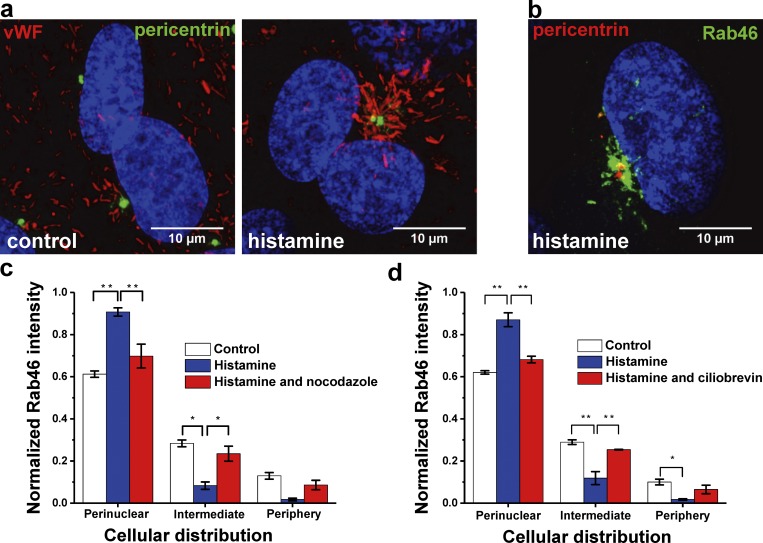
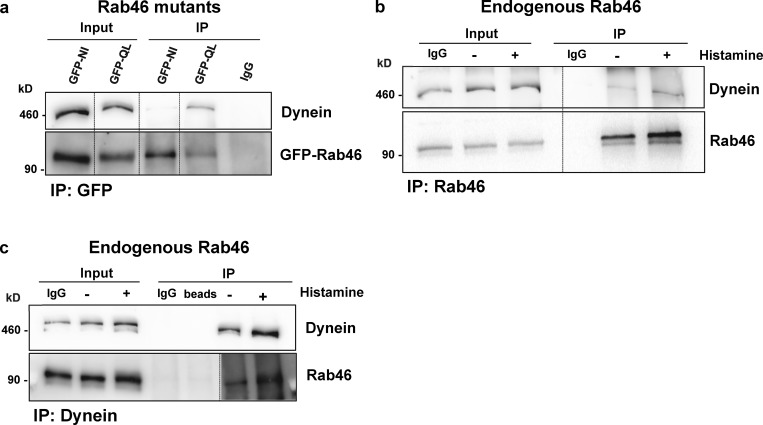
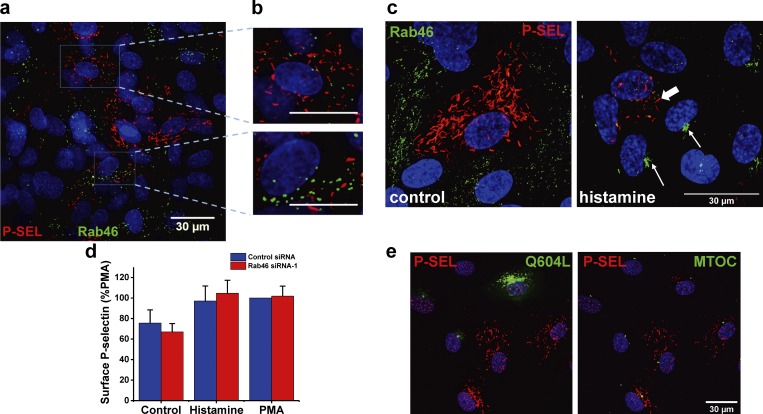
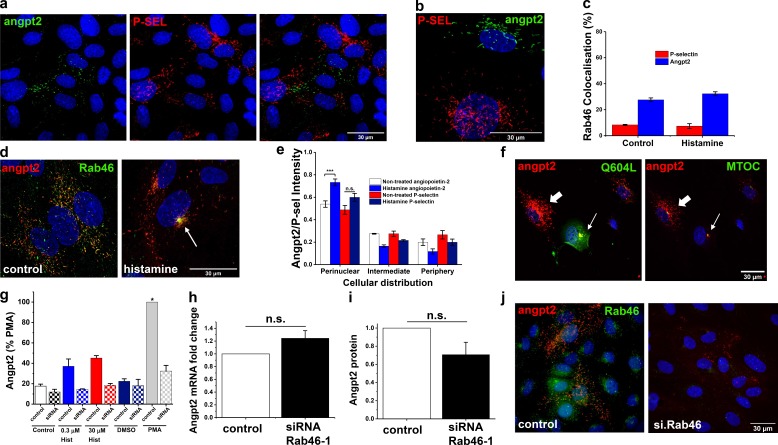
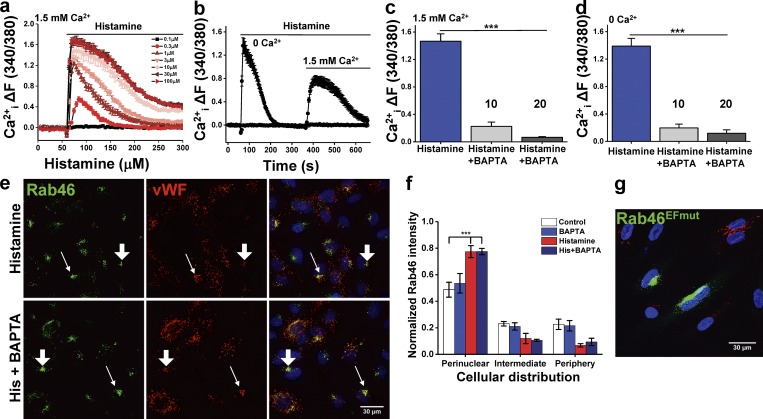
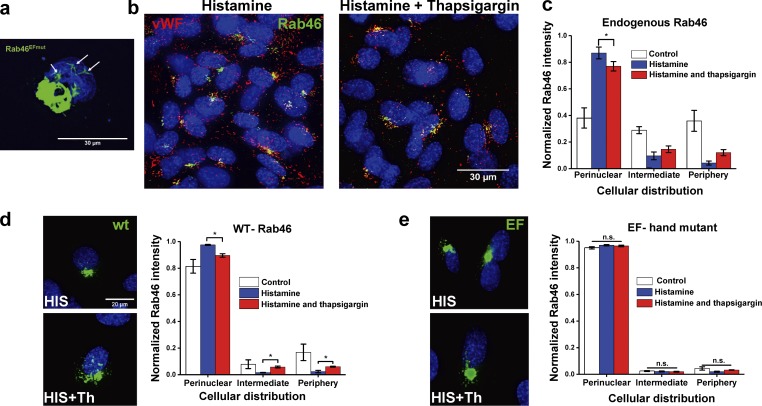
Endothelial cells selectively release cargo stored in Weibel-Palade bodies (WPBs) to regulate vascular function, but the underlying mechanisms are poorly understood. Here we show that histamine evokes the release of the proinflammatory ligand, P-selectin, while diverting WPBs carrying non-inflammatory cargo away from the plasma membrane to the microtubule organizing center. This differential trafficking is dependent on Rab46 (CRACR2A), a newly identified Ca2+-sensing GTPase, which localizes to a subset of P-selectin-negative WPBs. After acute stimulation of the H1 receptor, GTP-bound Rab46 evokes dynein-dependent retrograde transport of a subset of WPBs along microtubules. Upon continued histamine stimulation, Rab46 senses localized elevations of intracellular calcium and evokes dispersal of microtubule organizing center-clustered WPBs. These data demonstrate for the first time that a Rab GTPase, Rab46, integrates G protein and Ca2+ signals to couple on-demand histamine signals to selective WPB trafficking.


Figures

None
Graphical abstract
Figure 1.
Figure 1.
Rab46 localizes to WPBs. (a and b) Immunofluorescent images showing subcellular localization of endogenous Rab46 (green) and vWF (red) in HUVECs (a) and HMCECs (b). Boxed area (b) shows enlargement of WPBs showing cigar-shaped organelle localized to Rab46 vesicles. Scale bar in boxed area = 1 µm. (c) High-resolution Airyscan imaging and 3D reconstruction (bottom) showing single WPBs (vWF, red) where Rab46 (green) is juxtaposed to vWF. (d) Confocal microscopy images showing subcellular localization of Rab46 with tissue plasminogen activator (tPA) vesicles (left), Lamp1 as lysosomal marker (middle), and Rab11-positive recycling endosomes (right). Merged images are used to show colocalization of Rab46 to WPBs and other vesicles. (e) HUVECs transfected with WT Rab46 (green, anti-Rab46) demonstrate Rab46 localized to WPBs (red, anti-vWF). Maximum-intensity projections from DeltaVision or confocal microscopy z stack are shown. Number of independent biological repeats/technical repeats = 3/6. Scale bar = 30 µm.
Figure 2.
Figure 2.
Rab46 localizes to a subpopulation of WPBs and increases intracellular vWF content after depletion. (a) The number of vWF-positive WPBs per cell were quantified from images and compared with the number of WPBs that were also positive for Rab46 staining (see Materials and methods). Quantification of the number of WPBs per cell associated with Rab46 (49 ± 13 WPBs of 98 ± 18) per cell (number of independent biological repeats/technical repeats = 3/5). (b) To quantify the percentage of cells that contain WPBs, we counted the number of vWF-positive vesicles observed in images. We quantified the number of cells positive for vWF in HUVECs when cells were depleted of Rab46 by targeted siRNA (siRNA Rab46-1) or a control siRNA (number of independent biological repeats/technical repeats = 3/18). (c) Quantitative PCR change in cycle threshold (ΔCT) analysis of HUVECs transfected with Rab46 siRNA-1 demonstrates no difference in the expression of vWF mRNA compared with cells transfected with control siRNA (n = 3). (d) Densitometry analysis from a Western blot of vWF band intensity in HUVECs transfected with two different siRNAs specific for Rab46 is shown as fold-change relative to housekeeping genes (siRNA Rab46-1, 1.63 ± 0.23; siRNA Rab46-2, 1.49 ± 0.22; n = 6). (e) Example images used to quantify cells stained for vWF as a marker for WPBs in the presence or absence of Rab46 (siRNA-1). (f) The number of WPBs per cell quantified as WPB counting described in Materials and methods, where cells were depleted of Rab46 versus siRNA control (control, 95 ± 6; siRNA Rab46-1, 128 ± 8). Number of independent biological repeats/technical repeats = 3/18. Graphs show mean ± SEM. n.s., not significant. *, P < 0.05 by Student’s t test.
Figure 3.
Figure 3.
Histamine-induced Rab46-dependent perinuclear clustering of WPBs. (a) Representative images of HUVECs transfected with Rab46 siRNA-1 or control siRNA in control conditions (vehicle) or after 10-min histamine treatment (30 µM). Immunostaining of Rab46 (green) and vWF (red) shows perinuclear cluster of Rab46 and vWF in siRNA control cells upon histamine stimulation (bottom left). Perinuclear trafficking of WPBs is completely abolished in Rab46-depleted cells (bottom right). Scale bar = 30 µm. (b) Quantitative analysis of vWF cellular distribution in siRNA control cells and Rab46-depleted cells upon histamine stimulation. Results were grouped into three areas: perinuclear, intermediate, and periphery. The plot shows vWF signal intensity of each particle in the respective area where the mean (± SEM) was noted as percentage of the total signal intensity. Number of independent biological repeats/technical repeats = 3/36. *, P < 0.05 by two-way ANOVA. (c and d) Graph of quantitative PCR change in cycle threshold (ΔCT) analysis (± SEM) of histamine receptor mRNA expression compared with housekeeping control genes (HCG; n = 3; c) and representative images of cells immunostained for Rab46 (green) and vWF (red) and stimulated with 100 µM of the H1R agonist 2-PY or 100 µM of the H4R agonist 4-Met (d). Scale bar = 30 µm.
Figure 4.
Figure 4.
Subcellular localization of WT and Rab46 nucleotide binding mutants. (a) Representative image of HUVECs expressing WT Rab46 and a representative intensity plot with a random distribution (top left). Representative image of constitutively active form of Rab46 (Q604L) with its intensity plot where the peak indicates clustering (top right). Representative images of the nucleotide-free mutant (N658I; bottom left) and the inactive GDP-bound form of Rab46 (T559N; bottom right) expressed in HUVECs and their representative intensity plots showing homogeneous green distribution indicating a cytosolic localization. Plots were generated using the Oval profile method in ImageJ. Number of independent biological repeats/technical repeats = 3/28. (b) Histamine does not induce perinuclear clustering of cells overexpressing the inactive N658I Rab46 mutant. Cells treated with vehicle or 30 µM histamine (10 min) and immunostained for Rab46 (green), vWF (red), and pericentrin (white) as a marker of the MTOC. Example cells outlined in yellow. Number of independent biological repeats/technical repeats = 3/15. Scale bar = 50 µm.
Figure 5.
Figure 5.
The integrity of microtubules and dynein is necessary for Rab46-dependent trafficking of WPBs to the MTOC. (a) Airyscan images of HUVECs stained with vWF (red) and pericentrin (green). Control cells on the left and 30 µM histamine–treated cells on the right showing reorientation of WPBs toward the MTOC. (b) High-resolution Airyscan image of cells treated with 30 µM histamine (10 min) and then immunostained with Rab46 (green) and pericentrin (red) showing Rab46 clustering at the MTOC. Maximum-intensity projections from confocal microscopy z stack are shown. (c and d) Mean data showing the cellular distribution of Rab46 upon histamine stimulation in cells pretreated with nocodazole (c) or ciliobrevin (d) and respective control cells. The plots quantify Rab46 signal intensity in the respective area where the mean (± SEM) is noted as a percentage of the total signal intensity. Number of independent biological repeats/technical repeats = 3/18; *, P < 0.05; **, P < 0.01 by one-way ANOVA.
Figure 6.
Figure 6.
Rab46 interacts with the DHC. (a) GFP-tag active and inactive forms of Rab46 (Q604L and N658I, respectively) were overexpressed in HUVECs, and immunoprecipitation (IP) was performed using an anti-GFP antibody. Western blot analysis shows that the active form of Rab46 (Q604L) binds to dynein. (b) Immunoprecipitation of endogenous Rab46 in HUVECs performed using an anti-Rab46 antibody; coprecipitation of DHC was assessed by immunoblotting for DHC. (c) Reverse immunoprecipitation of endogenous Rab46 performed using anti-DHC antibody; coprecipitation was assessed by immunoblotting for Rab46. Rab46 is shown at an increased exposure and overlaid on the blot. Blots are representative of three independent experiments.
Figure 7.
Figure 7.
Histamine-evoked cell surface expression of P-selectin. (a) Images of HUVECs immunostained for P-selectin (P-SEL; red) and Rab46 (green). The blue boxes represent the areas magnified in b. (b) P-selectin and Rab46 in distinct WPBs in the same cell. Scale bars = 30 µm. (c) Airyscan images of HUVECs immunostained for P-selectin (P-SEL; red) and Rab46 (green) in response to control or 5-min treatment with 30 µM histamine. Thin white arrows, clusters of Rab46-positive WPBs; thick arrow, cell surface P-selectin. Scale bar = 30 µm. (d) ELISA measurements of cell surface P-selectin expression in HUVECs transfected with either control or Rab46 siRNA-1. HUVECs were stimulated with vehicle, 30 µM histamine, or 1 µM PMA. Plot indicates mean ± SEM percentage of maximal control siRNA response (PMA). Number of independent biological repeats/technical repeats = 3/9. (e) Constitutively active Rab46 does not localize P-selectin at the MTOC. Cells overexpressing the constitutively active Q604L Rab46 mutant (green), P-selectin (red; left image), and pericentrin as a marker for the MTOC (red; right image). n = 3.
Figure 8.
Figure 8.
Histamine induces differential trafficking of P-selectin–negative WPBs that contain angpt2. (a) P-selectin (red) and angpt2 (green) reside in mutually exclusive WPBs. (b) Representative high-resolution Airyscan image shows P-selectin (red) and angpt2 (green) distribution in WPBs. (c) Quantification of percentage Rab46 colocalization to P-selectin– and angpt2-positive WPBs in control and 30 µM histamine–treated HUVECs. The plot indicates the mean ± SEM; number of independent biological repeats/technical repeats = 3/18–30. (d) Images of HUVECs immunostained for endogenous angpt2 (red) and Rab46 (green) in response to control or 5-min 30 µM histamine treatment. Arrow depicts coclusters of Rab46 and angpt2. Scale bar = 30 µm, applies to both images. (e) P-selectin, angpt2, and Rab46 cellular distribution in response to 5-min treatment with 30 µM histamine. Plot represents mean ± SEM normalized intensity in the respective area; number of independent biological repeats/technical repeats = 5/28–40. (f) Angpt2 (red) localizes to pericentrin (green; white arrow) in the absence of stimulation when expressed in cells overexpressing constitutively active Q604L Rab46 (green). Angpt2 does not cluster in cells not overexpressing Q604L (white thick arrow). (g) ELISA-based analysis of angpt2 secretion shown as a percentage of the PMA response in cells treated with siRNA control or Rab46 siRNA-1. Quantification was performed on supernatants collected from HUVECs treated with vehicle, 0.3 µM histamine, 30 µM histamine, or 1 µM PMA. Number of independent biological repeats/technical repeats = 3/6. (h) ΔPCR change in cycle threshold (ΔCT) analysis of HUVECs transfected with Rab46 siRNA-1 demonstrates no difference in the expression of angpt2 mRNA compared with control siRNA (n = 3). (i) Western blot densitometry of angpt2 band intensity in HUVECs transfected with siRNA specific for Rab46 is shown as fold-change relative to housekeeping genes (siRNA Rab46-1, 0.7 ± 0.14; n = 3). (j) Representative images depicting loss of angpt2 localization to WPBs when cells have been depleted of Rab46 (siRNA Rab46-1). Scale bar = 30 µm. n.s., not significant. ***, P < 0.001 by one- or two-way ANOVA as appropriate.
Figure 9.
Figure 9.
Acute histamine treatment–induced perinuclear localization of WPBs is independent of Ca2+. (a) Dose response of histamine-induced Ca2+ mobilization. Representative traces of change (Δ) in intracellular Ca2+ evoked by histamine in HUVECs loaded with the Ca2+ indicator Fura-2-AM. Number of independent biological repeats/technical repeats = 5/30. (b) Histamine evokes a biphasic SOCE response in HUVECs. In the absence of extracellular Ca2+, the first phase reflects the release of Ca2+ from intracellular stores, while the addition of 1.5 mM extracellular Ca2+ to the recording solution evokes a second phase that reflects the influx of extracellular Ca2+. Number of independent biological repeats/technical repeats = 5/36. (c) Mean data of peak intracellular Ca2+ evoked by histamine in HUVECs pretreated with vehicle or 10 or 20 µM AM-BAPTA in the presence of 1.5 mM extracellular Ca2+. Number of independent biological repeats/technical repeats = 3/9. (d) Mean data of peak intracellular Ca2+ evoked by histamine in HUVECs pretreated with vehicle or 10 or 20 µM AM-BAPTA in the absence of extracellular Ca2+. Number of independent biological repeats/technical repeats = 3/9. (e) Representative images of HUVECs immunostained for vWF (red) and Rab46 (green) in response to 30 µM histamine (10 min) ± pretreatment with 10 µM AM-BAPTA. Scale bar = 30 µm. (f) Mean data of Rab46 cellular distribution in response to 30 µM histamine treatment for 5 min in HUVECs pretreated with either vehicle or 10 µM AM-BAPTA. The plot represents mean ± SEM normalized intensity in the respective area; number of independent biological repeats/technical repeats = 3/18–30. (g) Representative image of HUVECs expressing a mutant of Rab46 mutant that cannot bind Ca2+ (Rab46EFmut, green) costained with vWF (red). Scale bar = 30 µm. ***, P < 0.001 by one-way ANOVA.
Figure 10.
Figure 10.
Intracellular Ca2+ evokes Rab46-dependent WPB dispersal from the MTOC. (a) Example of EF-hand and multimitotic spindles. Immunostaining of HUVECs overexpressing a mutation of Rab46 that cannot bind Ca2+ (Rab46EFmut, green), where Rab46 is localized to multiple spindle-like compartments (arrows). Scale bar = 30 µm. (b) Representative images of HUVECs treated with 30 µM histamine for 10 min alone or followed by thapsigargin (1 µM) and stained for endogenous Rab46 (green) and vWF (red). (c) Quantitative analysis of endogenous Rab46 dispersal shown in b, showing cellular distribution of Rab46. (d and e) Representative images and quantitative analysis of histamine-stimulated cells overexpressing WT (d) and EF-hand Rab46 mutant (e) ± thapsigargin (Th) showing Rab46 intensity distribution into three different cellular areas after stimulation with histamine or histamine followed by thapsigargin. Scale bar = 20 µm, applies to all images in d and e. The plots show Rab46 signal intensity in the respective areas, where the mean (± SEM) was noted as percentage of the total signal intensity. Number of independent biological repeats/technical repeats = 3/30. *, P < 0.05; n.s., not significant by one-way ANOVA.

Similar articles

Cited by

References

    1. Alfonso F., and Angiolillo D.J.. 2013. Targeting p-selectin during coronary interventions: the elusive link between inflammation and platelets to prevent myocardial damage. J. Am. Coll. Cardiol. 61:2056–2059. 10.1016/j.jacc.2013.03.004 - DOI - PubMed
    1. Babich V., Meli A., Knipe L., Dempster J.E., Skehel P., Hannah M.J., and Carter T.. 2008. Selective release of molecules from Weibel-Palade bodies during a lingering kiss. Blood. 111:5282–5290. 10.1182/blood-2007-09-113746 - DOI - PubMed
    1. Biesemann A., Gorontzi A., Barr F., and Gerke V.. 2017. Rab35 protein regulates evoked exocytosis of endothelial Weibel-Palade bodies. J. Biol. Chem. 292:11631–11640. 10.1074/jbc.M116.773333 - DOI - PMC - PubMed
    1. Bonfanti R., Furie B.C., Furie B., and Wagner D.D.. 1989. PADGEM (GMP140) is a component of Weibel-Palade bodies of human endothelial cells. Blood. 73:1109–1112. - PubMed
    1. Brandherm I., Disse J., Zeuschner D., and Gerke V.. 2013. cAMP-induced secretion of endothelial von Willebrand factor is regulated by a phosphorylation/dephosphorylation switch in annexin A2. Blood. 122:1042–1051. 10.1182/blood-2012-12-475251 - DOI - PubMed

Publication types

MeSH terms