. 2019 May 31;9(5):180262.
doi: 10.1098/rsob.180262.

Osteocyte TSC1 promotes sclerostin secretion to restrain osteogenesis in mice

Affiliations

Osteocyte TSC1 promotes sclerostin secretion to restrain osteogenesis in mice

Wen Liu et al. Open Biol. .

Abstract

Osteocytes secrete the glycoprotein sclerostin to inhibit bone formation by osteoblasts, but how sclerostin production is regulated in osteocytes remains unclear. Here, we show that tuberous sclerosis complex 1 (TSC1) in osteocytes promotes sclerostin secretion through inhibition of mechanistic target of rapamycin complex 1 (mTORC1) and downregulation of Sirt1. We generated mice with DMP1-Cre-directed Tsc1 gene deletion ( Tsc1 CKO) to constitutively activate mTORC1 in osteocytes. Although osteocyte TSC1 disruption increased RANKL expression and osteoclast formation, it markedly reduced sclerostin production in bone, resulting in severe osteosclerosis with enhanced bone formation in mice. Knockdown of TSC1 activated mTORC1 and decreased sclerostin, while rapamycin inhibited mTORC1 and increased sclerostin mRNA and protein expression levels in MLO-Y4 osteocyte-like cells. Furthermore, mechanical loading activated mTORC1 and prevented sclerostin expression in osteocytes. Mechanistically, TSC1 promotes sclerostin production and prevents osteogenesis through inhibition of mTORC1 and downregulation of Sirt1, a repressor of the sclerostin gene Sost. Our findings reveal a role of TSC1/mTORC1 signalling in the regulation of osteocyte sclerostin secretion and bone formation in response to mechanical loading in vitro. Targeting TSC1 represents a potential strategy to increase osteogenesis and prevent bone loss-related diseases.

Keywords: Sirt1; TSC1; mTORC1; osteocyte; osteogenesis; sclerostin.


Conflict of interest statement

The authors declare that they have no conflicts of interest with the contents of this article.

Figures
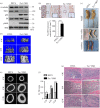
Figure 1.
Figure 1.
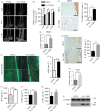
Deletion of TSC1 in osteocytes markedly increased bone mass in mice. (a) Western blot analysis of pS6 (Ser235/236), pS6K and, TSC1 in femora of 10-week-old control (DTCL) and Tsc1 CKO mice. pS6, phospho-S6, pS6K, phospho-S6 K. (b) Immunohistochemical staining of pS6 (Ser235/236) in distal femora of 10-week-old Tsc1 CKO mice. The boxed area is magnified below. Scale bars, 100 µm. Quantification (below) shows the pS6-positive cell numbers (N. pS6+) between DTCL and Tsc1 CKO mice (t-test, p < 0.0001, n = 6). (c) Images of 10-week-old Tsc1 CKO mice, length, femur and tibia, vertebral column. No difference in Tsc1 CKO mice was detected when compared with control mice. The scale bars represent 1 cm (n = 6). Data are represented as mean ± s.d., and ***p < 0.001. (d) Representative images of micro-CT analyses of the structure of metaphyseal trabecular bone and cortical bone in the distal femora in 4-, 8- and 12-week-old control (DTCL) and Tsc1 CKO mice (n = 6). (e) Representative micro-CT two-dimensional images of cortical bone of 4-, 8- and 12-week-old control and Tsc1 CKO mice. Scale bar, 1 mm (n = 6). (f) Cortical bone mass in the distal femora in 4-, 8- and 12-week-old control and Tsc1 CKO mice (t-test, 4 weeks: p = 0.0475, 8 weeks: p = 0.0078, 12 weeks: p = 0.0001, n = 6). (g) H&E staining of long bone from 4-, 8- and 12-week-old Tsc1 CKO and control mice. The scale bars represent 100 µm (n = 6).
Figure 2.
Figure 2.
Deletion of TSC1 in osteocytes stimulates osteogenesis and bone formation in mice. (a) Micro-CT reconstruction of distal femora from 4-, 8- and 12-week-old control (DTCL) and Tsc1 CKO mice. The scale bar represents 1 mm (n = 6). (b) BMD of trabecular bone in the distal femora from 4-, 8- and 12-week-old control (DTCL) and Tsc1 CKO mice (t-test, 4 weeks: p = 0.0083, 8 weeks: p = 0.0257, 12 weeks: p = 0.0284). BMD, bone mineral density (n = 6). (c) Immunohistochemical staining and quantification of DMP1 in decalcified sections of distal femora from 10-week-old control (DTCL) and Tsc1 CKO mice (t-test, p = 0.0037). Numbers of DMP1 (N. DMP1+). The scale bars represent 50 µm (n = 6). (d) mRNA expression of DMP1 in femora from DTCL and Tsc1 CKO mice (t-test, p = 0.0002, n = 6). (e) Calcein double labelling of cortical bone in distal femora from 10-week-old control (DTCL) and Tsc1 CKO mice. The boxed area is magnified in the panel below. The scale bars represent 100 µm and 50 µm (n = 6). (f) Mineral apposition rate (MAR) (t-test, p = 0.0062). (g) Immunohistochemical staining and quantification analysis of OCN in distal femora from 10-week-old control and Tsc1 CKO mice (t-test, p = 0.0008). Numbers of OCN (N. OCN+). The scale bars represent 50 µm (n = 6). (h) mRNA level of osteocalcin (OCN) in DTCL and Tsc1 CKO mice (t-test, p = 0.0008). (i) Enzyme-linked immunosorbent assay (ELISA) detection of serum OCN levels in control (DTCL) and Tsc1 CKO mice (t-test, p = 0.0009, 12-week-old males, n = 6). (j) ELISA detection of serum P1NP levels in control and Tsc1 CKO mice (t-test, p = 0.001, 12-week-old mice, n = 6). (k) ELISA detection of serum CTX-1 levels in control and Tsc1 CKO mice (t-test, p = 0.029, 12-week-old mice, n = 6). (l) Western blot analysis of the expression levels of OCN protein in trabecular bone lysates from control and Tsc1 CKO mice. All experiments were repeated independently three times. Data are represented as mean ± s.d., *p < 0.05, **p < 0.01 and ***p < 0.001.
Figure 3.
Figure 3.
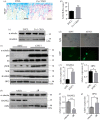
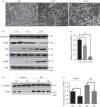
Activation of mTORC1 in osteocytes stimulates RANKL expression and osteoclast formation in mice. (a) Representative images of TRAP staining of femora from 10-week-old control (DTCL) and Tsc1 CKO mice. The scale bars represent 50 µm. (b) Number of TRAP-positive osteoclasts (t-test, p = 0.0017, n = 6). (c) Western blotting analysis of RANKL in bone lysates from DTCL and Tsc1 CKO mice (n = 6). (dg) MLO-Y4 cells were infected with control shRNA lentivirus (shNC) and TSC1 shRNA lentivirus (ΔTSC1) for 72 h. (d) Representative images of lentivirus infection of MLO-Y4 cells. Scale bars, 50 µm. Western blot analysis of pS6, pS6K, RANKL and OPG (e) in MLO-Y4 cells infected with TSC1 shRNA lentivirus. qPCR analysis for (f) RANKL and (g) OPG mRNA levels (t-test, RANKL: p = 0.0054, OPG: p = 0.0171, n = 6). (hj) MLO-Y4 cells were treated with 1 nM rapamycin (ΔR) and DMSO (vehicle) for 48 h, then cell lysates were subjected to immunoblotting (h) and qPCR analysis for (i) RANKL and (j) OPG protein and mRNA levels, respectively (t-test, RANKL: p = 0.0003, OPG: p = 0.0220, n = 6). All experiments were repeated independently three times. Data are represented as mean ± s.d., *p < 0.05, **p < 0.01 and ***p < 0.001.
Figure 4.
Figure 4.
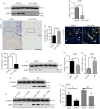
TSC1 inhibits sclerostin expression in osteocytes in an mTORC1-dependent manner. (a,b) The expression of (a) SOST protein and (b) mRNA (t-test, p = 0.0005) in bone lysates from 10-week-old control (DTCL) and Tsc1 CKO mice (n = 6). (c) Immunohistochemical staining and quantification analysis of SOST in decalcified sections from the distal femora of 10-week-old male control (DTCL) and Tsc1 CKO mice (t-test, p = 0.0014). The boxed area is magnified in the panel below. The scale bars represent 100 µm and 50 µm. SOST-positive cell numbers (N. SOST+) between Tsc1 CKO and control mice were analysed by cell counting. (d) Quantification analysis and immunofluorescence staining of β-catenin in decalcified sections from the distal femora of 10-week-old male control (DTCL) and Tsc1 CKO mice (t-test, p = 0.0078). The image is magnified on the top right corner. TB, trabecular bone. The scale bar represents 50 µm (n = 6). (e,f) MLO-Y4 cells were infected with TSC1 shRNA lentivirus (ΔTSC1) for 72 h and then subjected to (e) immunoblotting and (f) qPCR analysis for SOST protein and mRNA levels, respectively (t-test, p = 0.0052). (g,h) MLO-Y4 cells were treated with vehicle and 1 nM rapamycin (ΔR) for 48 h and then subjected to (g) immunoblotting and (h) q-PCR analysis for SOST protein and mRNA levels, respectively (t-test, p = 0.0029). (i,j) MLO-Y4 cells were infected with NC and TSC1 shRNA lentivirus for 72 h, then treated with vehicle or 1 nM rapamycin for 48 h and subjected to (i) immunoblotting and (j) q-PCR analysis for SOST protein and mRNA levels, respectively (non-parametric statistical test, V group, p = 0.0281; ΔR group, p = 0.0496, n = 6). All experiments were repeated independently three times. Data are represented as mean ± s.d., *p < 0.05, **p < 0.01 and ***p < 0.001.
Figure 5.
Figure 5.
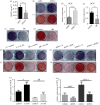
Osteocyte TSC1 prevents osteogenesis through increasing sclerostin secretion. (a) ELISA analysis of SOST in conditioned medium (CM) from MLO-Y4 cells infected with TSC1 or NC shRNA lentivirus for 72 h (t-test, p = 0.0001, n = 6). (bd) MC3T3-E1 cells were incubated with CM from MLO-Y4 cells infected with TSC1 shRNA lentivirus (ΔTSC1) and subjected to osteogenesis, and (b) ALP staining, (c) Alizarin red staining and (d) qPCR analysis of OCN (t-test, p = 0.0009, n = 6). (eg) MC3T3-E1 cells were incubated with CM from MLO-Y4 cells treated with vehicle (V) and 1 nM of rapamycin (ΔR) and subjected to osteogenesis and (e) ALP staining, (f) Alizarin red staining and (g) qPCR analysis of OCN (t-test, p = 0.0038, n = 6). (hj) MC3T3-E1 cells were incubated with CM from MLO-Y4 cells treated with 1 nM rapamycin and anti-sclerostin antibody (scl-Ab, 50 ng ml−1), as indicated, and subjected to osteogenesis and (h) ALP staining, (i) Alizarin red staining and (j) qPCR analysis of OCN (non-parametric statistical test, V group, p = 0.0003; ΔR group, p = 0.0005, n = 6). (km) MC3T3-E1 cells were incubated with CM from MLO-Y4 cells infected with shNC and ΔTSC1, with or without addition of recombinant sclerostin protein (rhSCL), as indicated (50 ng ml−1), and subjected to osteogenesis and (k) ALP staining, (l) Alizarin red staining and (m) qPCR analysis of OCN. Data were analysed by a non-parametric statistical test; shNC group, p = 0.0008; ΔTSC1 group, p = 0.0005, n = 6. All experiments were repeated independently three times. Data are represented as mean ± s.d., **p < 0.01 and ***p < 0.001.
Figure 6.
Figure 6.
Mechanical loading activates mTORC1 to prevent sclerostin expression in osteocytes. (a) Representative images of the stretch-loaded MLO-Y4 cells for 0, 12 and 24 h. The scale bar represents 100 µm. 0 h: no-loaded group/control group; 12 h: stretch-loaded for 12 h; 24 h: stretch-loaded for 24 h. (b) Western blot analysis of SOST, pS6 and pS6K expression in MLO-Y4 cells stretch-loaded for 0, 12 or 24 h. (c) mRNA levels of SOST in stretch-loaded MLO-Y4 cells (one-way ANOVA with Bonferroni multiple comparison, 0 h versus 12 h, p = 0.0077; 0 h versus 24 h, p = 0.0003, n = 6). (d,e) MLO-Y4 cells were stretch-loaded and treated with 1 nM rapamycin for 24 h, then cell lysates were subjected to (d) western blotting or (e) qPCR analysis for SOST (non-parametric statistical test, vehicle group, p = 0.0246; ΔR group, p = 0.0473, n = 6). All experiments were repeated independently three times. NL, no-loaded; SL, stretch-loaded. Data are represented as mean ± s.d., *p < 0.05, **p < 0.01 and ***p < 0.001.
Figure 7.
Figure 7.
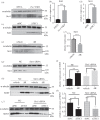
TSC1 promotes sclerostin expression in osteocytes partially through Sirt1. (a) Bone lysates from 10-week-old control and Tsc1 CKO mice were subjected to western blot analysis for Sirt1. (b) mRNA expression of Sirt1 in femora of 10-week-old control (DTCL) and Tsc1 CKO mice (t-test, p = 0.0005, n = 6). (c) Western blot analysis of Sirt1 expression in MLO-Y4 cells infected with TSC1 shRNA lentivirus. (d) mRNA levels of Sirt1 in MLO-Y4 cells infected with NC and TSC1 shRNA lentivirus (t-test, p = 0.0009, n = 6). (e) Western blot analysis of Sirt1 in MLO-Y4 cells treated with vehicle (V) and 1 nM of rapamycin for 48 h (ΔR). (f) mRNA levels of Sirt1 in MLO-Y4 cells treated with 1 nM rapamycin for 48 h (ΔR) (t-test, p = 0.0008, n = 6). (g) MLO-Y4 cells were transfected with Sirt1 or NC siRNA, (h) then treated with 1 nM rapamycin (ΔR) for 48 h, and cell lysates were subjected to western blot analysis for SOST. (i) mRNA level of SOST was assayed by qPCR (non-parametric statistical test, NC group, p = 0.0027; Sirt1 siRNA group, p = 0.0402). (j) MLO-Y4 cells infected with TSC1 shRNA lentivirus (ΔTSC1) for 72 h, subsequently transfected with Sirt1 or NC siRNA for another 48 h, then SOST expression was detected by western blotting. (k) mRNA level of SOST was assayed by qPCR (non-parametric statistical test, NC group, p = 0.0033; Sirt1 siRNA group, p = 0.0021). All experiments were repeated independently three times. Data are represented as mean ± s.d., *p < 0.05, **p < 0.01 and ***p < 0.001.
Figure 8.
Figure 8.
TSC1 prevents osteogenesis partially through promoting sclerostin secretion in osteocytes. A schematic model depicting the role of osteocyte TSC1 in the regulation of SOST and coordination of osteoclasts and osteoblasts.

Similar articles

Cited by

References

    1. Katayama Y. 2016. Osteocytes and osteonetwork. Clin. Calcium 26, 1111–1118. - PubMed
    1. Dallas SL, Bonewald LF. 2010. Dynamics of the transition from osteoblast to osteocyte. Ann. N. Y. Acad. Sci. 1192, 437–443. (10.1111/j.1749-6632.2009.05246.x) - DOI - PMC - PubMed
    1. Bonewald LF. 2011. The amazing osteocyte. J. Bone Miner. Res. 26, 229–238. (10.1002/jbmr.320) - DOI - PMC - PubMed
    1. Manolagas SC. 2000. Birth and death of bone cells: basic regulatory mechanisms and implications for the pathogenesis and treatment of osteoporosis. Endocr. Rev. 21, 115–137. (10.1210/edrv.21.2.0395) - DOI - PubMed
    1. Marotti G. 1996. The structure of bone tissues and the cellular control of their deposition. Ital. J. Anat. Embryol. 101, 25–79. - PubMed

Publication types

MeSH terms

LinkOut - more resources