. 2019 May 13;15(5):e1007061.
doi: 10.1371/journal.pcbi.1007061. eCollection 2019 May.

The ability of transcription factors to differentially regulate gene expression is a crucial component of the mechanism underlying inversion, a frequently observed genetic interaction pattern

Affiliations

The ability of transcription factors to differentially regulate gene expression is a crucial component of the mechanism underlying inversion, a frequently observed genetic interaction pattern

Saman Amini et al. PLoS Comput Biol. .

Abstract

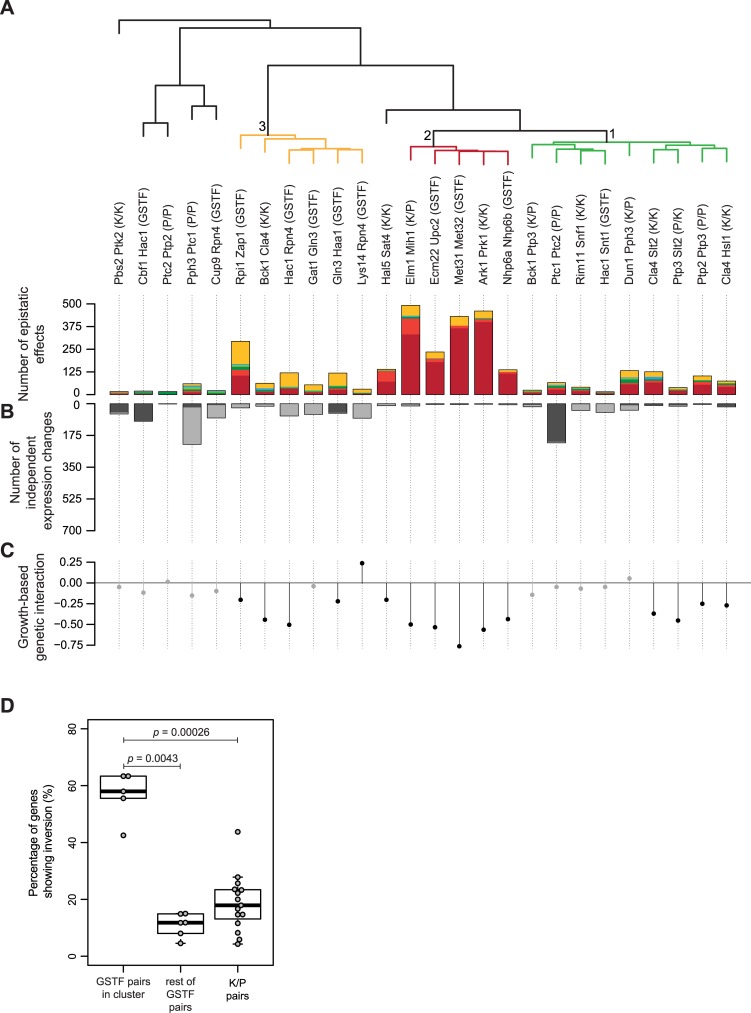
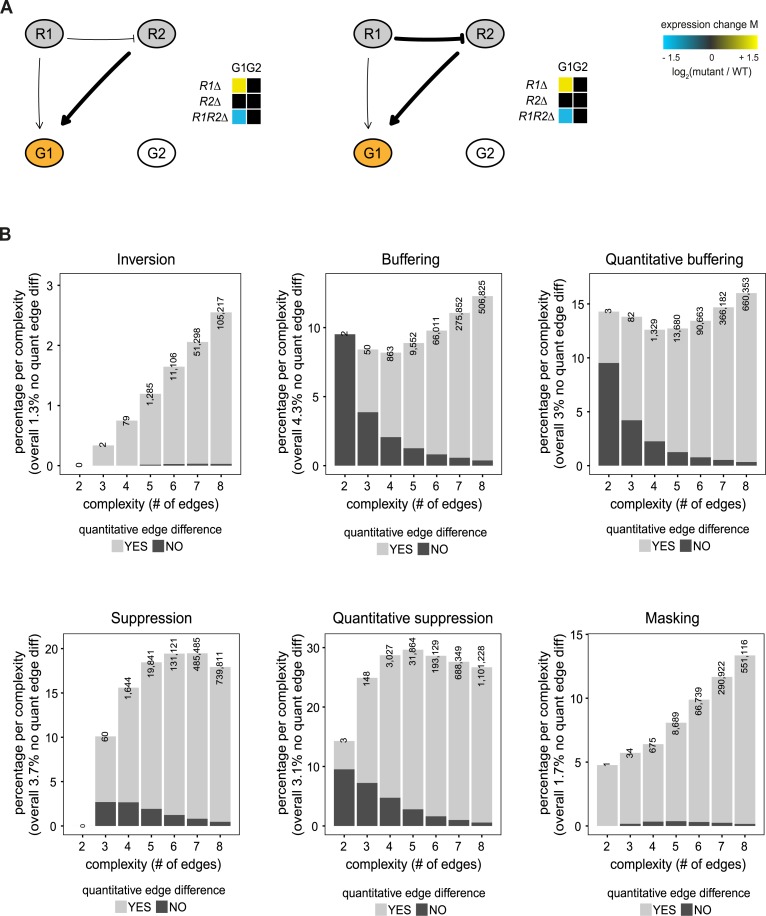
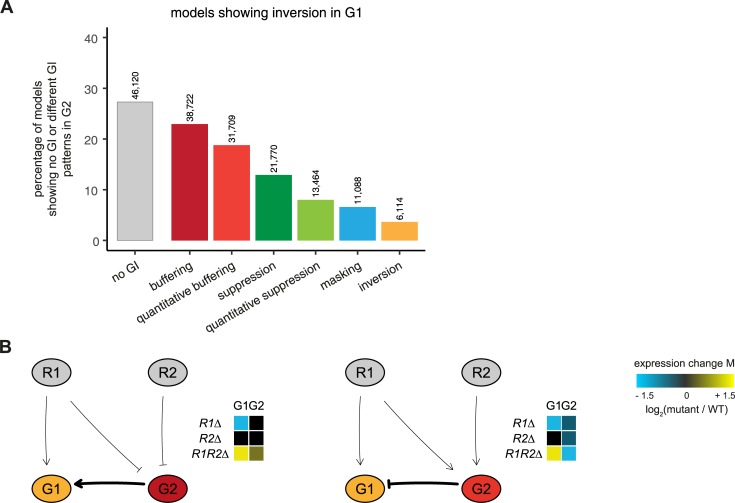
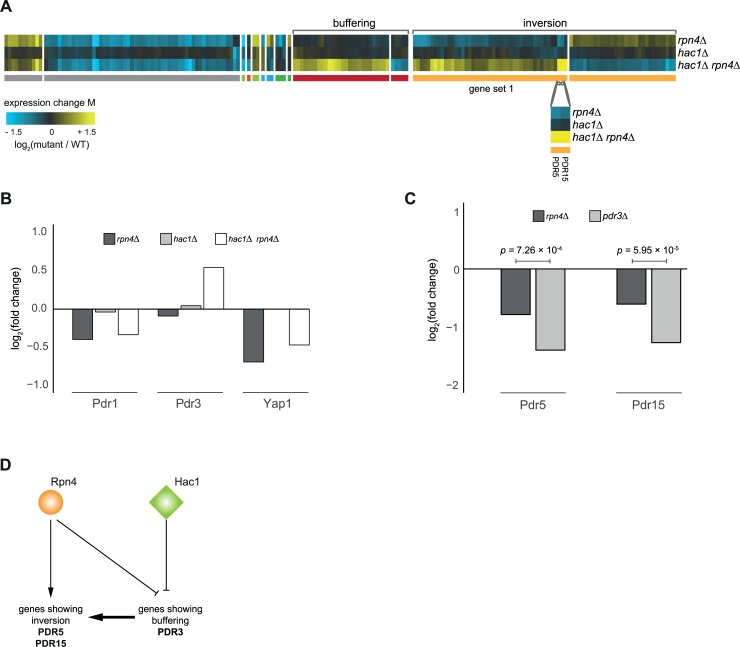
Genetic interactions, a phenomenon whereby combinations of mutations lead to unexpected effects, reflect how cellular processes are wired and play an important role in complex genetic diseases. Understanding the molecular basis of genetic interactions is crucial for deciphering pathway organization as well as understanding the relationship between genetic variation and disease. Several hypothetical molecular mechanisms have been linked to different genetic interaction types. However, differences in genetic interaction patterns and their underlying mechanisms have not yet been compared systematically between different functional gene classes. Here, differences in the occurrence and types of genetic interactions are compared for two classes, gene-specific transcription factors (GSTFs) and signaling genes (kinases and phosphatases). Genome-wide gene expression data for 63 single and double deletion mutants in baker's yeast reveals that the two most common genetic interaction patterns are buffering and inversion. Buffering is typically associated with redundancy and is well understood. In inversion, genes show opposite behavior in the double mutant compared to the corresponding single mutants. The underlying mechanism is poorly understood. Although both classes show buffering and inversion patterns, the prevalence of inversion is much stronger in GSTFs. To decipher potential mechanisms, a Petri Net modeling approach was employed, where genes are represented as nodes and relationships between genes as edges. This allowed over 9 million possible three and four node models to be exhaustively enumerated. The models show that a quantitative difference in interaction strength is a strict requirement for obtaining inversion. In addition, this difference is frequently accompanied with a second gene that shows buffering. Taken together, these results provide a mechanistic explanation for inversion. Furthermore, the ability of transcription factors to differentially regulate expression of their targets provides a likely explanation why inversion is more prevalent for GSTFs compared to kinases and phosphatases.


Conflict of interest statement

The authors have declared that no competing interests exist.

Figures

Fig 1
Fig 1. Genetic interaction profiles of GSTF and kinase/phosphatase pairs.
(A) Cartoon depicting expression changes in single and double mutants with different genetic interaction patterns color coded underneath. At the bottom, the direction of expression differences between the observed expression change (MxΔyΔ) and expected (M+M) is stated. Color scale from yellow for an increase in expression levels compared to WT (adjusted p-value ≤ 0.01, log2(FC) > 0), black for unchanged expression and blue for a decrease in expression levels compared to WT (adjusted p-value ≤ 0.01, log2(FC) < 0) as described before [17]. (B) Expression changes compared to WT (horizontal) in GSTF single and double mutants (vertical). Different colors underneath the gene expression profiles represent different genetic interaction patterns as indicated in A. Gray depicts gene expression changes not part of a genetic interaction pattern. Pairs are sorted based on the number of genetic interaction effects, increasing from bottom to top. (C) Expression changes compared to WT (horizontal) in kinase and phosphatase single and double mutants (vertical). Layout and ordering as in B.
Fig 2
Fig 2. Hierarchical clustering of slow growth corrected genetic interaction profiles is better suited to discern underlying mechanisms.
(A) Hierarchical clustering of all pairs according to their genetic interaction effects after slow growth correction. Average linkage clustering was applied to group pairs with similar genetic interaction patterns. The number of occurrences for each genetic interaction pattern (Fig 1A) was used and the identity of individual genes was disregarded. Similarity between pairs was calculated using cosine correlation. Branch depicted in red, label 2, indicates pairs that are dominated by buffering. Branch depicted in orange, label 3, indicates pairs dominated by inversion. Branch depicted in green, label 1, indicates pairs explained by mixed epistasis. The number of genetic interaction effects underlying the clustering are shown as bar plots below the dendrogram (colors as in Fig 1A). (B) Number of genes showing no genetic interaction pattern but significantly changing in one of the mutants compared to WT (adjusted p-value ≤ 0.01, FC > 1.5). Dark gray for the first named gene, light gray for the second named gene. (C) Growth-based genetic interaction scores depicted by solid circles. Significant genetic interaction scores are shown in black, gray otherwise. Ordering of pairs is the same as in A and B. (D) Boxplot highlighting the difference between the percentage of genes showing inversion for GSTF pairs within the orange branch (Fig 2A), GSTF pairs outside this cluster and K/P pairs. Adjusted p-values are based on a two-sided Mann-Whitney test.
Fig 3
Fig 3. Schematic overview of Petri net simulation pipeline.
Schematic overview of the pipeline implemented for performing Petri net simulations. The left panels show from top to bottom the different steps performed when running the simulation pipeline. The right panels show the different data representations used throughout the pipeline. The right panel above the dashed line indicates a series of steps where edge weight matrices are used. The right panel below the dashed line indicates steps where models or Petri net notation are used.
Fig 4
Fig 4. A quantitative edge difference is the minimum requirement for observing inversion.
(A) Petri net simulation results for the only two models with three nodes that result in inversion (indicated in orange) for the G1 node. Heat maps indicate the log2(FC) of the number of tokens in simulated deletion mutants (single and double mutant) relative to the WT situation. Thicker lines indicate edges with a strong effect. (B) For each genetic interaction pattern (inversion, buffering, quantitative buffering, suppression, quantitative suppression and masking), the percentage of models showing that particular genetic interaction pattern is shown, split up per complexity (number of edges). The percentage per complexity is calculated as the number of models showing a particular genetic interaction pattern for a certain complexity, divided by the total number of models for that complexity. Bar plots are subdivided into two types of models, models that have quantitative differences between edge weights (bright gray) and models that have no quantitative differences between edge weights (dark gray). The number of models showing the particular genetic interaction pattern per complexity is shown on top of each bar plot.
Fig 5
Fig 5. Inversion is frequently accompanied by buffering.
(A) Bar plots showing the percentage of models that either have no genetic interaction (gray, left bar) or a different genetic interaction pattern in node G2 when node G1 is displaying inversion. The number of models per category is shown on top of each bar plot. Color scheme of the genetic interaction patterns as in Fig 1A. (B) Petri net simulation results for two models with four nodes with node G1 always displaying inversion and node G2 displaying either buffering (left) or quantitative buffering (right). Heat maps as in Fig 4A.
Fig 6
Fig 6. Gln3 and Gat1 might differentially regulate mitochondrial-to-nuclear signaling.
(A) Expression changes compared to WT (horizontal) in gat1Δ, gln3Δ, and gat1Δ gln3Δ mutants (vertical) after slow growth correction. Different colors underneath the gene expression profiles represent different genetic interaction patterns as indicated in Fig 1A. Gray depicts gene expression changes not part of a genetic interaction pattern. Nuclear encoded mitochondrial respiratory genes are denoted with a dot. (B) Proposed model to explain the inversion pattern between Gat1 and Gln3 based on the Petri net simulation result in Fig 4A.
Fig 7
Fig 7. Pdr3 acts as an intermediate gene for observing inversion in PDR5 and PDR15.
(A) Expression changes compared to WT (horizontal) in rpn4Δ, hac1Δ, and hac1Δ rpn4Δ mutants (vertical) after slow growth correction. Different colors underneath the gene expression profiles represent different genetic interaction patterns as indicated in Fig 1A. Gray depicts gene expression changes not part of a genetic interaction pattern. (B) Expression changes of Pdr1, Pdr3 and Yap1 compared to WT in rpn4Δ, hac1Δ and hac1Δ rpn4Δ mutants. (C) Expression changes of Pdr5 and Pdr15 compared to WT in rpn4Δ and pdr3Δ mutants. Adjusted P values are obtained from a limma analysis comparing gene expression changes between rpn4Δ and pdr3Δ mutants. (D) Proposed model to explain the inversion pattern between Hac1 and Rpn4 based on the Petri net simulation result in Fig 5B.
Fig 8
Fig 8. Combination of buffering by induced dependency and proposed model for inversion.
Carton depiction of proposed model for genetic interaction between Rpn4 and Hac1. Red arrows indicate the consequence of disrupted genes and pathways. The dashed rectangle indicates a previously proposed model, “buffering by induced dependency”, to explain genes showing buffering for Hac1-Rpn4. A thicker arrow represents a stronger activation strength.

Similar articles

Cited by

References

    1. Badano JL, Katsanis N. Beyond Mendel: an evolving view of human genetic disease transmission. Nat Rev Genet. 2002;3: 779–789. 10.1038/nrg910 - DOI - PubMed
    1. Cooper DN, Krawczak M, Polychronakos C, Tyler-Smith C, Kehrer-Sawatzki H. Where genotype is not predictive of phenotype: towards an understanding of the molecular basis of reduced penetrance in human inherited disease. Hum Genet. 2013;132: 1077–1130. 10.1007/s00439-013-1331-2 - DOI - PMC - PubMed
    1. Baryshnikova A, Costanzo M, Myers CL, Andrews B, Boone C. Genetic interaction networks: toward an understanding of heritability. Annu Rev Genomics Hum Genet. 2013;14: 111–133. 10.1146/annurev-genom-082509-141730 - DOI - PubMed
    1. Phillips PC. Epistasis—the essential role of gene interactions in the structure and evolution of genetic systems. Nat Rev Genet. 2008;9: 855–867. 10.1038/nrg2452 - DOI - PMC - PubMed
    1. Wei W-H, Hemani G, Haley CS. Detecting epistasis in human complex traits. Nat Rev Genet. 2014;15: 722–733. 10.1038/nrg3747 - DOI - PubMed

Publication types

Substances

Grants and funding

PK acknowledges the financial support of the Netherlands Organisation for Scientific Research (NWO); grant number 864.11.010; https://www.nwo.nl/en. The funders had no role in study design, data collection and analysis, decision to publish, or preparation of the manuscript.

LinkOut - more resources