Force balances between interphase centrosomes as revealed by laser ablation
- PMID: 31067156
- PMCID: PMC6727758
- DOI: 10.1091/mbc.E19-01-0034
Force balances between interphase centrosomes as revealed by laser ablation
Abstract
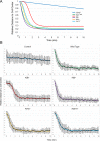
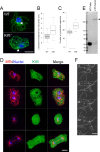
Numerous studies have highlighted the self-centering activities of individual microtubule (MT) arrays in animal cells, but relatively few works address the behavior of multiple arrays that coexist in a common cytoplasm. In multinucleated Dictyostelium discoideum cells, each centrosome organizes a radial MT network, and these networks remain separate from one another. This feature offers an opportunity to reveal the mechanism(s) responsible for the positioning of multiple centrosomes. Using a laser microbeam to eliminate one of the two centrosomes in binucleate cells, we show that the unaltered array is rapidly repositioned at the cell center. This result demonstrates that each MT array is constantly subject to centering forces and infers a mechanism to balance the positions of multiple arrays. Our results address the limited actions of three kinesins and a cross-linking MAP that are known to have effects in maintaining MT organization and suggest a simple means used to keep the arrays separated.
Figures


Similar articles
-
Organization of microtubule assemblies in Dictyostelium syncytia depends on the microtubule crosslinker, Ase1.Cell Mol Life Sci. 2016 Feb;73(4):859-68. doi: 10.1007/s00018-015-2026-8. Epub 2015 Aug 23. Cell Mol Life Sci. 2016. PMID: 26298292 Free PMC article.
-
Dynein intermediate chain mediated dynein-dynactin interaction is required for interphase microtubule organization and centrosome replication and separation in Dictyostelium.J Cell Biol. 1999 Dec 13;147(6):1261-74. doi: 10.1083/jcb.147.6.1261. J Cell Biol. 1999. PMID: 10601339 Free PMC article.
-
Pushing forces drive the comet-like motility of microtubule arrays in Dictyostelium.Mol Biol Cell. 2005 Jul;16(7):3334-40. doi: 10.1091/mbc.e05-01-0057. Epub 2005 Apr 27. Mol Biol Cell. 2005. PMID: 15857957 Free PMC article.
-
Centrosome function: sometimes less is more.Traffic. 2009 May;10(5):472-81. doi: 10.1111/j.1600-0854.2009.00880.x. Epub 2009 Jan 24. Traffic. 2009. PMID: 19192251 Review.
-
Phase Transitioning the Centrosome into a Microtubule Nucleator.Biochemistry. 2018 Jan 9;57(1):30-37. doi: 10.1021/acs.biochem.7b01064. Epub 2017 Dec 19. Biochemistry. 2018. PMID: 29256606 Free PMC article. Review.
Cited by
-
Centering and Shifting of Centrosomes in Cells.Cells. 2020 May 29;9(6):1351. doi: 10.3390/cells9061351. Cells. 2020. PMID: 32485978 Free PMC article. Review.
-
Genetic Material Manipulation and Modification by Optical Trapping and Nanosurgery-A Perspective.Front Bioeng Biotechnol. 2020 Sep 18;8:580937. doi: 10.3389/fbioe.2020.580937. eCollection 2020. Front Bioeng Biotechnol. 2020. PMID: 33072730 Free PMC article. Review.
-
Centrosome Positioning in Migrating Dictyostelium Cells.Cells. 2022 May 29;11(11):1776. doi: 10.3390/cells11111776. Cells. 2022. PMID: 35681473 Free PMC article.
-
Bioenergetics of the Dictyostelium Kinesin-8 Motor Isoform.Biomolecules. 2020 Apr 7;10(4):563. doi: 10.3390/biom10040563. Biomolecules. 2020. PMID: 32272590 Free PMC article.
-
Dictyostelium Cell Fixation: Two Simple Tricks.Methods Protoc. 2020 Jul 1;3(3):47. doi: 10.3390/mps3030047. Methods Protoc. 2020. PMID: 32630359 Free PMC article.
References
-
- Berns MW, Aist J, Edwards J, Strahs K, Girton J, McNeill P, Rattner JB, Kitzes M, Hammer-Wilson M, Liaw LH, et al (1981). Laser microsurgery in cell and developmental biology. Science , 505–513. - PubMed
-
- Bieling P, Telley IA, Surrey T. (2010). A minimal midzone protein module controls formation and length of antiparallel microtubule overlaps. Cell , 420–432. - PubMed
-
- Bingham JB, King SJ, Schroer TA. (1998). Purification of dynactin and dynein from brain tissue. Methods Enzymol , 171–184. - PubMed
Publication types
MeSH terms
Substances
Grants and funding
LinkOut - more resources
Full Text Sources
Molecular Biology Databases

