

Automated image analysis of NSCLC biopsies to predict response to anti-PD-L1 therapy
- PMID: 31060602
- PMCID: PMC6501300
- DOI: 10.1186/s40425-019-0589-x
Automated image analysis of NSCLC biopsies to predict response to anti-PD-L1 therapy
Abstract
Background: Immune checkpoint therapies (ICTs) targeting the programmed cell death-1 (PD1)/programmed cell death ligand-1 (PD-L1) pathway have improved outcomes for patients with non-small cell lung cancer (NSCLC), particularly those with high PD-L1 expression. However, the predictive value of manual PD-L1 scoring is imperfect and alternative measures are needed. We report an automated image analysis solution to determine the predictive and prognostic values of the product of PD-L1+ cell and CD8+ tumor infiltrating lymphocyte (TIL) densities (CD8xPD-L1 signature) in baseline tumor biopsies.
Methods: Archival or fresh tumor biopsies were analyzed for PD-L1 and CD8 expression by immunohistochemistry. Samples were collected from 163 patients in Study 1108/NCT01693562, a Phase 1/2 trial to evaluate durvalumab across multiple tumor types, including NSCLC, and a separate cohort of 199 non-ICT- patients. Digital images were automatically scored for PD-L1+ and CD8+ cell densities using customized algorithms applied with Developer XD™ 2.7 software.
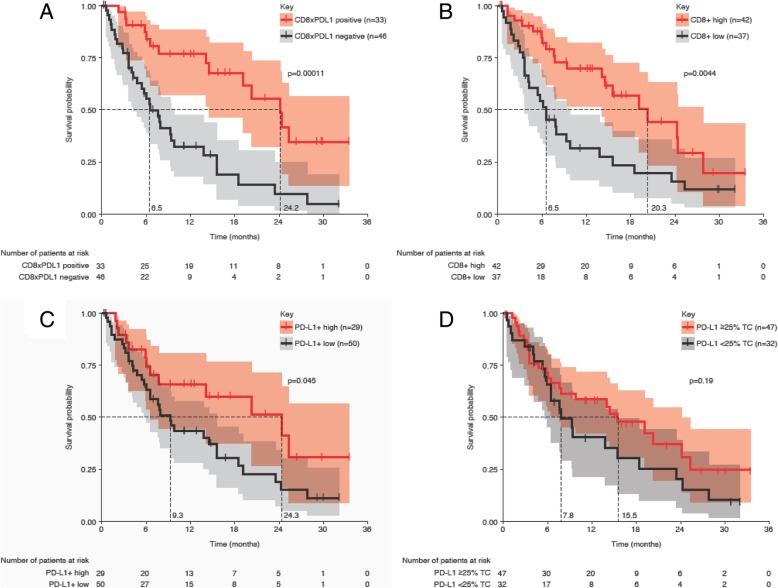
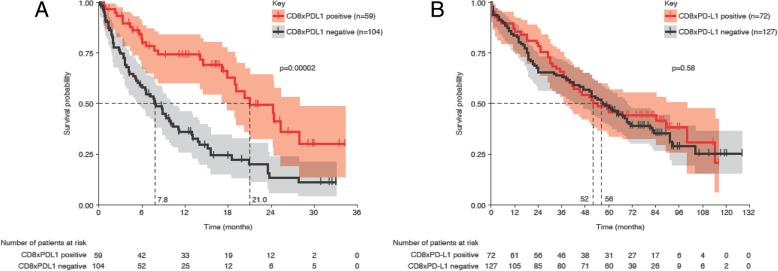
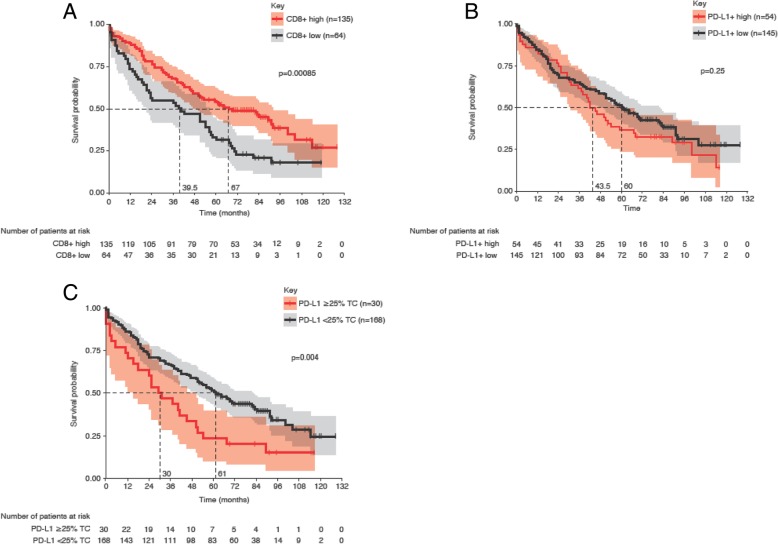
Results: For patients who received durvalumab, median overall survival (OS) was 21.0 months for CD8xPD-L1 signature-positive patients and 7.8 months for signature-negative patients (p = 0.00002). The CD8xPD-L1 signature provided greater stratification of OS than high densities of CD8+ cells, high densities of PD-L1+ cells, or manually assessed tumor cell PD-L1 expression ≥25%. The CD8xPD-L1 signature did not stratify OS in non-ICT patients, although a high density of CD8+ cells was associated with higher median OS (high: 67 months; low: 39.5 months, p = 0.0009) in this group.
Conclusions: An automated CD8xPD-L1 signature may help to identify NSCLC patients with improved response to durvalumab therapy. Our data also support the prognostic value of CD8+ TILS in NSCLC patients who do not receive ICT.
Trial registration: ClinicalTrials.gov identifier: NCT01693562 . Study code: CD-ON-MEDI4736-1108. Interventional study (ongoing but not currently recruiting). Actual study start date: August 29, 2012. Primary completion date: June 23, 2017 (final data collection date for primary outcome measure).
Keywords: Biomarker; CD8; Cancer immune checkpoint therapy; Image analysis; Immunohistochemistry; NSCLC; PD-L1.
Conflict of interest statement
Ethics approval and consent to participate
Clinical study NCT01693562, from which data in this report were obtained, was carried out in accordance with the Declaration of Helsinki and Good Clinical Practice guidelines. The study protocol, amendments, and participant informed consent document were approved by the appropriate institutional review boards.
Consent for publication
No individual data were used in this study.
Competing interests
SAH, MCR, KR, BWH, and KES are employees of AstraZeneca and own stock and/or stock options in AstraZeneca. THT, AS, LR, TW, TH, MW, and GS are employees of Definiens AG. SA at the time of this study was an employee of Definiens AG.
Publisher’s Note
Springer Nature remains neutral with regard to jurisdictional claims in published maps and institutional affiliations.
Figures

Similar articles
-
Measuring multiple parameters of CD8+ tumor-infiltrating lymphocytes in human cancers by image analysis.J Immunother Cancer. 2018 Mar 6;6(1):20. doi: 10.1186/s40425-018-0326-x. J Immunother Cancer. 2018. PMID: 29510739 Free PMC article. Clinical Trial.
-
Development of a programmed cell death ligand-1 immunohistochemical assay validated for analysis of non-small cell lung cancer and head and neck squamous cell carcinoma.Diagn Pathol. 2016 Oct 8;11(1):95. doi: 10.1186/s13000-016-0545-8. Diagn Pathol. 2016. PMID: 27717372 Free PMC article. Clinical Trial.
-
Tumor mutational load, CD8+ T cells, expression of PD-L1 and HLA class I to guide immunotherapy decisions in NSCLC patients.Cancer Immunol Immunother. 2020 May;69(5):771-777. doi: 10.1007/s00262-020-02506-x. Epub 2020 Feb 12. Cancer Immunol Immunother. 2020. PMID: 32047958 Free PMC article.
-
PD-L1 expression in advanced NSCLC: Insights into risk stratification and treatment selection from a systematic literature review.Lung Cancer. 2017 Oct;112:200-215. doi: 10.1016/j.lungcan.2017.08.005. Epub 2017 Aug 10. Lung Cancer. 2017. PMID: 29191596 Review.
-
[Efficacy of PD-1/PD-L1 immune checkpoint inhibitors and PD-L1 testing in thoracic cancers].Ann Pathol. 2017 Feb;37(1):61-78. doi: 10.1016/j.annpat.2016.12.009. Epub 2017 Feb 3. Ann Pathol. 2017. PMID: 28162296 Review. French.
Cited by
-
Assessing dynamic metabolic heterogeneity in non-small cell lung cancer patients via ultra-high sensitivity total-body [18F]FDG PET/CT imaging: quantitative analysis of [18F]FDG uptake in primary tumors and metastatic lymph nodes.Eur J Nucl Med Mol Imaging. 2022 Nov;49(13):4692-4704. doi: 10.1007/s00259-022-05904-8. Epub 2022 Jul 11. Eur J Nucl Med Mol Imaging. 2022. PMID: 35819498
-
Programmed Death-Ligand 1 Expression in Breast Cancer Patients: Clinicopathological Associations from a Single-Institution Study.Breast Cancer (Dove Med Press). 2021 Nov 13;13:603-615. doi: 10.2147/BCTT.S333123. eCollection 2021. Breast Cancer (Dove Med Press). 2021. PMID: 34803400 Free PMC article.
-
The expression landscape of JAK1 and its potential as a biomarker for prognosis and immune infiltrates in NSCLC.BMC Bioinformatics. 2021 Sep 29;22(1):471. doi: 10.1186/s12859-021-04379-y. BMC Bioinformatics. 2021. PMID: 34587898 Free PMC article.
-
Advances in the Lung Cancer Immunotherapy Approaches.Vaccines (Basel). 2022 Nov 19;10(11):1963. doi: 10.3390/vaccines10111963. Vaccines (Basel). 2022. PMID: 36423060 Free PMC article. Review.
-
Prediction performance comparison of biomarkers for response to immune checkpoint inhibitors in advanced non-small cell lung cancer.Thorac Cancer. 2024 May;15(13):1050-1059. doi: 10.1111/1759-7714.15295. Epub 2024 Mar 25. Thorac Cancer. 2024. PMID: 38528429 Free PMC article.
References
Publication types
MeSH terms
Substances
Associated data
LinkOut - more resources
Full Text Sources
Medical
Research Materials
Miscellaneous