Apigenin and hesperidin augment the toxic effect of doxorubicin against HepG2 cells
- PMID: 31053173
- PMCID: PMC6499973
- DOI: 10.1186/s40360-019-0301-2
Apigenin and hesperidin augment the toxic effect of doxorubicin against HepG2 cells
Abstract
Background: Hepatocellular carcinoma (HCC) is one of the most common malignancies, with an increasing incidence. Despite the fact that systematic chemotherapy with a doxorubicin provides only marginal improvements in survival of the HCC patients, the doxorubicin is being used in transarterial therapies or combined with the target drug - sorafenib. The aim of the study was to evaluate the effect of natural flavonoids on the cytotoxicity of the doxorubicin against human hepatocellular carcinoma cell line HepG2.
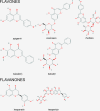
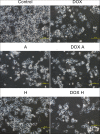
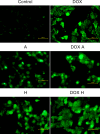
Methods: The effect of apigenin and its glycosides - cosmosiin, rhoifolin; baicalein and its glycosides - baicalin as well as hesperetin and its glycosides - hesperidin on glycolytic genes expression of HepG2 cell line, morphology and cells' viability at the presence of doxorubicin have been tested. In an attempt to elucidate the mechanism of observed results, the fluorogenic probe for reactive oxygen species (ROS), the DNA oxidative damage, the lipid peroxidation and the double strand breaks were evaluated. To assess impact on the glycolysis pathway, the mRNA expression for a hexokinase 2 (HK2) and a lactate dehydrogenase A (LDHA) enzymes were measured. The results were analysed statistically with the one-way analysis of variance (ANOVA) and post hoc multiple comparisons.
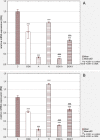
Results: The apigenin and the hesperidin revealed the strongest effect on the toxicity of doxorubicin. Both flavonoids simultaneously changed the expression of the glycolytic pathway genes - HK2 and LDHA, which play a key role in the Warburg effect. Although separate treatment with doxorubicin, apigenin and hesperidin led to a significant oxidative DNA damage and double strand breaks, simultaneous administration of doxorubicin and apigenin or hesperidin abolished these damage with the simultaneous increase in the doxorubicin toxicity.
Conclusion: The obtained results indicate the existence of a very effective cytotoxic mechanism in the HepG2 cells of the combined effect of doxorubicin and apigenin (or hesperidin), not related to the oxidative stress. To explain this synergy mechanism, further research is needed, The observed intensification of the cytotoxic effect of doxorubicin by this flavonoids may be a promising direction of the research on the therapy of hepatocellular carcinoma, especially in a chemoembolization.
Keywords: Apigenin; Doxorubicin; Flavonoids; Hepatocellular carcinoma; Hesperidin.
Conflict of interest statement
Ethics approval and consent to participate
Not applicable
Consent for publication
Not applicable
Competing interests
The authors declare that they have no competing interests.
Publisher’s Note
Springer Nature remains neutral with regard to jurisdictional claims in published maps and institutional affiliations.
Figures


Similar articles
-
Apigenin and Hesperidin Downregulate DNA Repair Genes in MCF-7 Breast Cancer Cells and Augment Doxorubicin Toxicity.Molecules. 2020 Sep 26;25(19):4421. doi: 10.3390/molecules25194421. Molecules. 2020. PMID: 32993087 Free PMC article.
-
Investigation of possible effects of apigenin, sorafenib and combined applications on apoptosis and cell cycle in hepatocellular cancer cells.Gene. 2020 May 5;737:144428. doi: 10.1016/j.gene.2020.144428. Epub 2020 Feb 8. Gene. 2020. PMID: 32045658
-
Protective effect of myricetin, apigenin, and hesperidin pretreatments on cyclophosphamide-induced immunosuppression.Immunopharmacol Immunotoxicol. 2021 Jun;43(3):353-369. doi: 10.1080/08923973.2021.1916525. Epub 2021 Apr 27. Immunopharmacol Immunotoxicol. 2021. PMID: 33905277
-
Hesperidin from Citrus seed induces human hepatocellular carcinoma HepG2 cell apoptosis via both mitochondrial and death receptor pathways.Tumour Biol. 2016 Jan;37(1):227-37. doi: 10.1007/s13277-015-3774-7. Epub 2015 Jul 21. Tumour Biol. 2016. PMID: 26194866 Free PMC article.
-
The Role of Flavonoids as a Cardioprotective Strategy against Doxorubicin-Induced Cardiotoxicity: A Review.Molecules. 2022 Feb 15;27(4):1320. doi: 10.3390/molecules27041320. Molecules. 2022. PMID: 35209107 Free PMC article. Review.
Cited by
-
Pharmacokinetic herb-drug interactions between Aidi injection and doxorubicin in rats with diethylnitrosamine-induced hepatocellular carcinoma.BMC Pharmacol Toxicol. 2021 Sep 6;22(1):48. doi: 10.1186/s40360-021-00515-9. BMC Pharmacol Toxicol. 2021. PMID: 34488896 Free PMC article.
-
Natural Product-Based Glycolysis Inhibitors as a Therapeutic Strategy for Epidermal Growth Factor Receptor-Tyrosine Kinase Inhibitor-Resistant Non-Small Cell Lung Cancer.Int J Mol Sci. 2024 Jan 9;25(2):807. doi: 10.3390/ijms25020807. Int J Mol Sci. 2024. PMID: 38255882 Free PMC article. Review.
-
Phytochemicals as Regulators of Tumor Glycolysis and Hypoxia Signaling Pathways: Evidence from In Vitro Studies.Pharmaceuticals (Basel). 2022 Jun 28;15(7):808. doi: 10.3390/ph15070808. Pharmaceuticals (Basel). 2022. PMID: 35890106 Free PMC article. Review.
-
Natural products targeting glycolysis in cancer.Front Pharmacol. 2022 Nov 1;13:1036502. doi: 10.3389/fphar.2022.1036502. eCollection 2022. Front Pharmacol. 2022. PMID: 36386122 Free PMC article.
-
Ameliorative Effects of Rhoifolin in Scopolamine-Induced Amnesic Zebrafish (Danio rerio) Model.Antioxidants (Basel). 2020 Jul 3;9(7):580. doi: 10.3390/antiox9070580. Antioxidants (Basel). 2020. PMID: 32635149 Free PMC article.
References
MeSH terms
Substances
LinkOut - more resources
Full Text Sources
Miscellaneous

