Hdac4 Interactions in Huntington's Disease Viewed Through the Prism of Multiomics
- PMID: 31040226
- PMCID: PMC6692770
- DOI: 10.1074/mcp.RA118.001253
Hdac4 Interactions in Huntington's Disease Viewed Through the Prism of Multiomics
Abstract
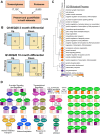
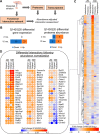
Huntington's disease (HD) is a monogenic disorder, driven by the expansion of a trinucleotide (CAG) repeat within the huntingtin (Htt) gene and culminating in neuronal degeneration in the brain, predominantly in the striatum and cortex. Histone deacetylase 4 (Hdac4) was previously found to contribute to the disease progression, providing a potential therapeutic target. Hdac4 knockdown reduced accumulation of misfolded Htt protein and improved HD phenotypes. However, the underlying mechanism remains unclear, given its independence on deacetylase activity and the predominant cytoplasmic Hdac4 localization in the brain. Here, we undertook a multiomics approach to uncover the function of Hdac4 in the context of HD pathogenesis. We characterized the interactome of endogenous Hdac4 in brains of HD mouse models. Alterations in interactions were investigated in response to Htt polyQ length, comparing mice with normal (Q20) and disease (Q140) Htt, at both pre- and post-symptomatic ages (2 and 10 months, respectively). Parallel analyses for Hdac5, a related class IIa Hdac, highlighted the unique interaction network established by Hdac4. To validate and distinguish interactions specifically enhanced in an HD-vulnerable brain region, we next characterized endogenous Hdac4 interactions in dissected striata from this HD mouse series. Hdac4 associations were polyQ-dependent in the striatum, but not in the whole brain, particularly in symptomatic mice. Hdac5 interactions did not exhibit polyQ dependence. To identify which Hdac4 interactions and functions could participate in HD pathogenesis, we integrated our interactome with proteome and transcriptome data sets generated from the striata. We discovered an overlap in enriched functional classes with the Hdac4 interactome, particularly in vesicular trafficking and synaptic functions, and we further validated the Hdac4 interaction with the Wiskott-Aldrich Syndrome Protein and SCAR Homolog (WASH) complex. This study expands the knowledge of Hdac4 regulation and functions in HD, adding to the understanding of the molecular underpinning of HD phenotypes.
Keywords: Hdac4; Hdac5; Huntington's Disease; Label-free quantification; Multiomics; Neurodegenerative diseases*; Omics; Protein-Protein Interactions*; Systems biology*; WASH complex.
© 2019 Federspiel et al.
Figures




Similar articles
-
Developing HDAC4-Selective Protein Degraders To Investigate the Role of HDAC4 in Huntington's Disease Pathology.J Med Chem. 2022 Sep 22;65(18):12445-12459. doi: 10.1021/acs.jmedchem.2c01149. Epub 2022 Sep 13. J Med Chem. 2022. PMID: 36098485 Free PMC article.
-
HTT-OMNI: A Web-based Platform for Huntingtin Interaction Exploration and Multi-omics Data Integration.Mol Cell Proteomics. 2022 Oct;21(10):100275. doi: 10.1016/j.mcpro.2022.100275. Epub 2022 Aug 3. Mol Cell Proteomics. 2022. PMID: 35932982 Free PMC article.
-
Protein changes in synaptosomes of Huntington's disease knock-in mice are dependent on age and brain region.Neurobiol Dis. 2020 Jul;141:104950. doi: 10.1016/j.nbd.2020.104950. Epub 2020 May 19. Neurobiol Dis. 2020. PMID: 32439598
-
Epigenetics of Huntington's Disease.Adv Exp Med Biol. 2017;978:277-299. doi: 10.1007/978-3-319-53889-1_15. Adv Exp Med Biol. 2017. PMID: 28523552 Review.
-
Transcriptional dysregulation of coding and non-coding genes in cellular models of Huntington's disease.Biochem Soc Trans. 2009 Dec;37(Pt 6):1270-5. doi: 10.1042/BST0371270. Biochem Soc Trans. 2009. PMID: 19909260 Review.
Cited by
-
Evaluation of 5-(Trifluoromethyl)-1,2,4-oxadiazole-Based Class IIa HDAC Inhibitors for Huntington's Disease.ACS Med Chem Lett. 2021 Feb 11;12(3):380-388. doi: 10.1021/acsmedchemlett.0c00532. eCollection 2021 Mar 11. ACS Med Chem Lett. 2021. PMID: 33738065 Free PMC article.
-
Circ-Ddx60 contributes to the antihypertrophic memory of exercise hypertrophic preconditioning.J Adv Res. 2023 Apr;46:113-121. doi: 10.1016/j.jare.2022.06.005. Epub 2022 Jun 16. J Adv Res. 2023. PMID: 35718079 Free PMC article.
-
Unlocking the epigenetic symphony: histone acetylation's impact on neurobehavioral change in neurodegenerative disorders.Epigenomics. 2024 Mar;16(5):331-358. doi: 10.2217/epi-2023-0428. Epub 2024 Feb 7. Epigenomics. 2024. PMID: 38321930 Review.
-
Mitochondria and Peroxisome Remodeling across Cytomegalovirus Infection Time Viewed through the Lens of Inter-ViSTA.Cell Rep. 2020 Jul 28;32(4):107943. doi: 10.1016/j.celrep.2020.107943. Cell Rep. 2020. PMID: 32726614 Free PMC article.
-
Cytoplasmic HDAC4 regulates the membrane repair mechanism in Duchenne muscular dystrophy.J Cachexia Sarcopenia Muscle. 2022 Apr;13(2):1339-1359. doi: 10.1002/jcsm.12891. Epub 2022 Feb 15. J Cachexia Sarcopenia Muscle. 2022. PMID: 35170869 Free PMC article.
References
-
- Bates G. P., Dorsey R., Gusella J. F., Hayden M. R., Kay C., Leavitt B. R., Nance M., Ross C. A., Scahill R. I., Wetzel R., Wild E. J., and Tabrizi S. J. (2015) Huntington disease. Nat. Rev. Dis. Primers 1, 15005. - PubMed
-
- Waldvogel H. J., Kim E. H., Tippett L. J., Vonsattel J. P., and Faull R. L. (2015) The Neuropathology of Huntington's Disease. Curr. Top. Behav. Neurosci. 22, 33–80 - PubMed
-
- (1993) A novel gene containing a trinucleotide repeat that is expanded and unstable on Huntington's disease chromosomes. The Huntington's Disease Collaborative Research Group. Cell 72, 971–983 - PubMed
-
- Ross C. A., and Tabrizi S. J. (2011) Huntington's disease: from molecular pathogenesis to clinical treatment. Lancet Neurol. 10, 83–98 - PubMed
Publication types
MeSH terms
Substances
LinkOut - more resources
Full Text Sources
Medical
Molecular Biology Databases
Research Materials

