

Distinct Requirements for HIV-1 Accessory Proteins during Cell Coculture and Cell-Free Infection
- PMID: 31027334
- PMCID: PMC6563509
- DOI: 10.3390/v11050390
Distinct Requirements for HIV-1 Accessory Proteins during Cell Coculture and Cell-Free Infection
Abstract
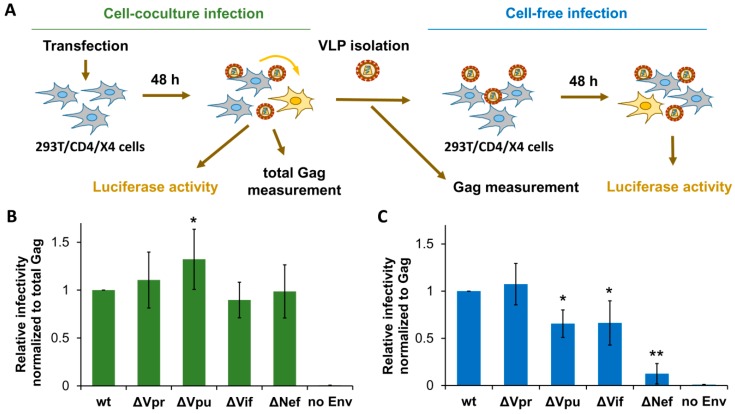
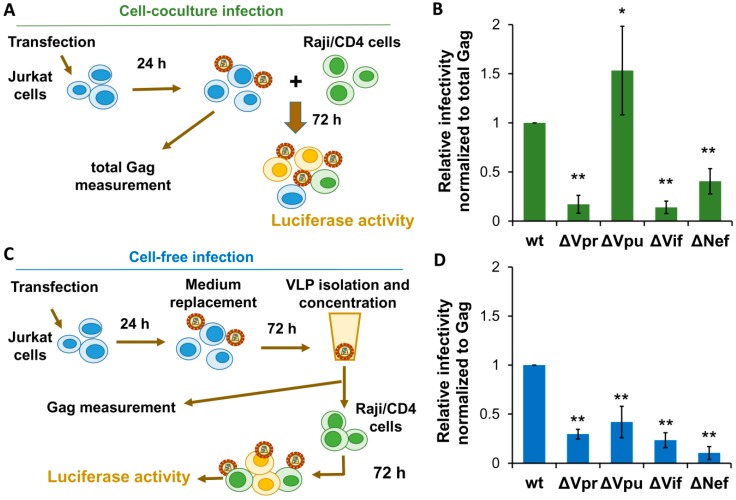
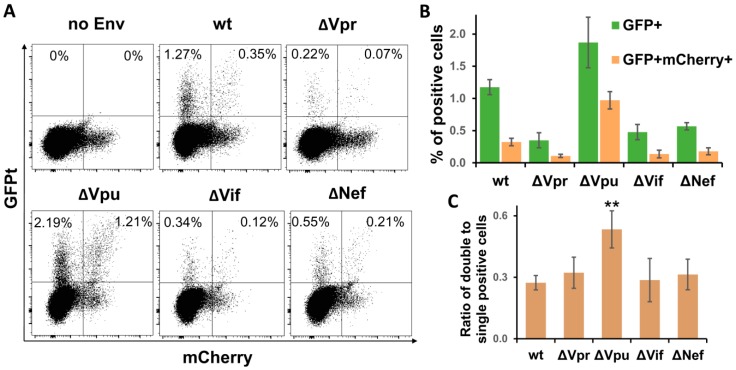
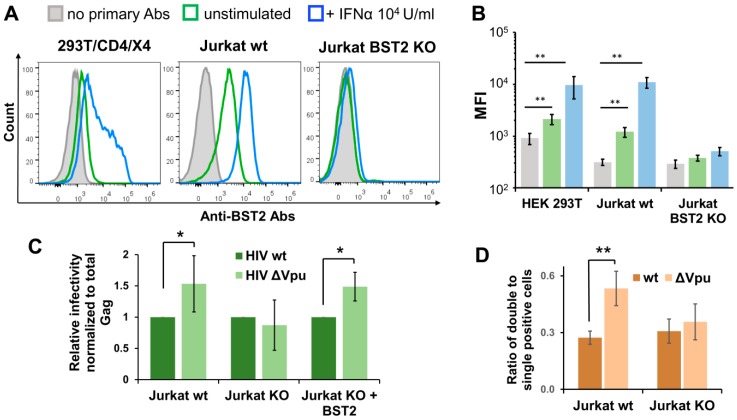
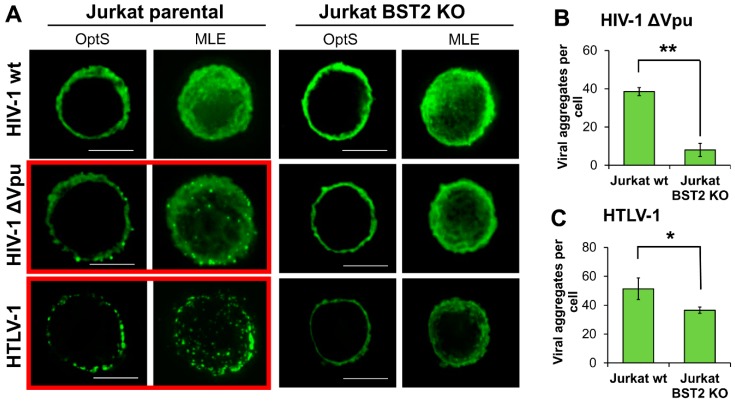
The role of accessory proteins during cell-to-cell transmission of HIV-1 has not been explicitly defined. In part, this is related to difficulties in measuring virus replication in cell cocultures with high accuracy, as cells coexist at different stages of infection and separation of effector cells from target cells is complicated. In this study, we used replication-dependent reporter vectors to determine requirements for Vif, Vpu, Vpr, or Nef during one cycle of HIV-1 cell coculture and cell-free infection in lymphoid and nonlymphoid cells. Comparative analysis of HIV-1 replication in two cell systems showed that, irrespective of transmission way, accessory proteins were generally less required for virus replication in 293T/CD4/X4 cells than in Jurkat-to-Raji/CD4 cell cocultures. This is consistent with a well-established fact that lymphoid cells express a broad spectrum of restriction factors, while nonlymphoid cells are rather limited in this regard. Remarkably, Vpu deletion reduced the level of cell-free infection, but enhanced the level of cell coculture infection and increased the fraction of multiply infected cells. Nef deficiency did not influence or moderately reduced HIV-1 infection in nonlymphoid and lymphoid cell cocultures, respectively, but strongly affected cell-free infection. Knockout of BST2-a Vpu antagonizing restriction factor-in Jurkat producer cells abolished the enhanced replication of HIV-1 ΔVpu in cell coculture and prevented the formation of viral clusters on cell surface. Thus, BST2-tethered viral particles mediated cell coculture infection more efficiently and at a higher level of multiplicity than diffusely distributed virions. In conclusion, our results demonstrate that the mode of transmission may determine the degree of accessory protein requirements during HIV-1 infection.
Keywords: BST2; CRISPR-Cas9 knockout; HIV-1; Nef; Vpu; accessory proteins; cell-to-cell infection; restriction factors.
Conflict of interest statement
The authors declare no conflict of interest.
Figures
Similar articles
-
Dual regulation of L-selectin (CD62L) by HIV-1: Enhanced expression by Vpr in contrast with cell-surface down-modulation by Nef and Vpu.Virology. 2018 Oct;523:121-128. doi: 10.1016/j.virol.2018.07.031. Epub 2018 Aug 14. Virology. 2018. PMID: 30119013
-
HIV-1 Nef and Vpu Interfere with L-Selectin (CD62L) Cell Surface Expression To Inhibit Adhesion and Signaling in Infected CD4+ T Lymphocytes.J Virol. 2015 May;89(10):5687-700. doi: 10.1128/JVI.00611-15. Epub 2015 Mar 11. J Virol. 2015. PMID: 25822027 Free PMC article.
-
Detection of the HIV-1 Accessory Proteins Nef and Vpu by Flow Cytometry Represents a New Tool to Study Their Functional Interplay within a Single Infected CD4+ T Cell.J Virol. 2022 Mar 23;96(6):e0192921. doi: 10.1128/jvi.01929-21. Epub 2022 Jan 26. J Virol. 2022. PMID: 35080425 Free PMC article.
-
HIV-1 accessory proteins--ensuring viral survival in a hostile environment.Cell Host Microbe. 2008 Jun 12;3(6):388-98. doi: 10.1016/j.chom.2008.04.008. Cell Host Microbe. 2008. PMID: 18541215 Review.
-
Making Sense of Multifunctional Proteins: Human Immunodeficiency Virus Type 1 Accessory and Regulatory Proteins and Connections to Transcription.Annu Rev Virol. 2017 Sep 29;4(1):241-260. doi: 10.1146/annurev-virology-101416-041654. Annu Rev Virol. 2017. PMID: 28961413 Free PMC article. Review.
Cited by
-
Lentiviral Vectors for T Cell Engineering: Clinical Applications, Bioprocessing and Future Perspectives.Viruses. 2021 Aug 2;13(8):1528. doi: 10.3390/v13081528. Viruses. 2021. PMID: 34452392 Free PMC article. Review.
-
Application of CRISPR/Cas Genomic Editing Tools for HIV Therapy: Toward Precise Modifications and Multilevel Protection.Front Cell Infect Microbiol. 2022 May 25;12:880030. doi: 10.3389/fcimb.2022.880030. eCollection 2022. Front Cell Infect Microbiol. 2022. PMID: 35694537 Free PMC article. Review.
-
Cell type-specific delivery by modular envelope design.Nat Commun. 2023 Aug 23;14(1):5141. doi: 10.1038/s41467-023-40788-8. Nat Commun. 2023. PMID: 37612276 Free PMC article.
-
HIV-1 and HTLV-1 Transmission Modes: Mechanisms and Importance for Virus Spread.Viruses. 2022 Jan 14;14(1):152. doi: 10.3390/v14010152. Viruses. 2022. PMID: 35062355 Free PMC article. Review.
-
Engineering T-Cell Resistance to HIV-1 Infection via Knock-In of Peptides from the Heptad Repeat 2 Domain of gp41.mBio. 2022 Feb 22;13(1):e0358921. doi: 10.1128/mbio.03589-21. Epub 2022 Jan 25. mBio. 2022. PMID: 35073736 Free PMC article.
References
-
- Stremlau M., Perron M., Lee M., Li Y., Song B., Javanbakht H., Diaz-Griffero F., Anderson D.J., Sundquist W.I., Sodroski J. Specific recognition and accelerated uncoating of retroviral capsids by the trim5alpha restriction factor. Proc. Nat. Acad. Sci. USA. 2006;103:5514–5519. doi: 10.1073/pnas.0509996103. - DOI - PMC - PubMed
Publication types
MeSH terms
Substances
LinkOut - more resources
Full Text Sources
Research Materials
