

Barley yield formation under abiotic stress depends on the interplay between flowering time genes and environmental cues
- PMID: 31024028
- PMCID: PMC6484077
- DOI: 10.1038/s41598-019-42673-1
Barley yield formation under abiotic stress depends on the interplay between flowering time genes and environmental cues
Abstract
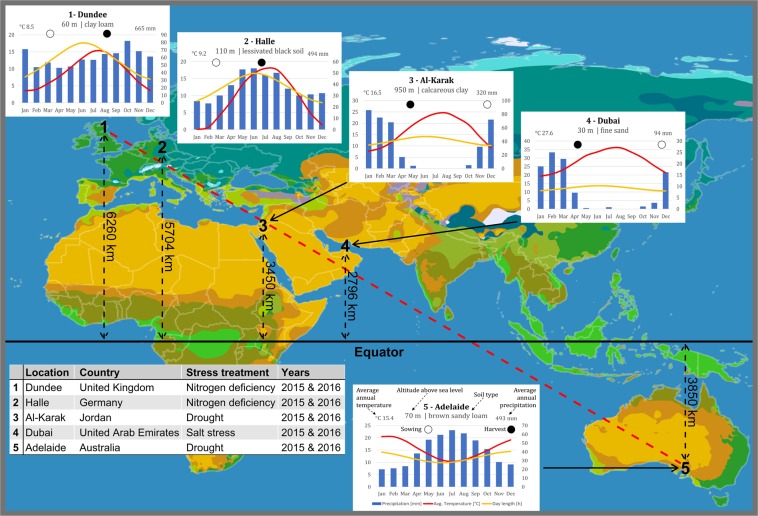
Since the dawn of agriculture, crop yield has always been impaired through abiotic stresses. In a field trial across five locations worldwide, we tested three abiotic stresses, nitrogen deficiency, drought and salinity, using HEB-YIELD, a selected subset of the wild barley nested association mapping population HEB-25. We show that barley flowering time genes Ppd-H1, Sdw1, Vrn-H1 and Vrn-H3 exert pleiotropic effects on plant development and grain yield. Under field conditions, these effects are strongly influenced by environmental cues like day length and temperature. For example, in Al-Karak, Jordan, the day length-sensitive wild barley allele of Ppd-H1 was associated with an increase of grain yield by up to 30% compared to the insensitive elite barley allele. The observed yield increase is accompanied by pleiotropic effects of Ppd-H1 resulting in shorter life cycle, extended grain filling period and increased grain size. Our study indicates that the adequate timing of plant development is crucial to maximize yield formation under harsh environmental conditions. We provide evidence that wild barley alleles, introgressed into elite barley cultivars, can be utilized to support grain yield formation. The presented knowledge may be transferred to related crop species like wheat and rice securing the rising global food demand for cereals.
Conflict of interest statement
The authors declare no competing interests.
Figures

Similar articles
-
Association of barley photoperiod and vernalization genes with QTLs for flowering time and agronomic traits in a BC2DH population and a set of wild barley introgression lines.Theor Appl Genet. 2010 May;120(8):1559-74. doi: 10.1007/s00122-010-1276-y. Epub 2010 Feb 13. Theor Appl Genet. 2010. PMID: 20155245 Free PMC article.
-
Genomic dissection of plant development and its impact on thousand grain weight in barley through nested association mapping.J Exp Bot. 2016 Apr;67(8):2507-18. doi: 10.1093/jxb/erw070. Epub 2016 Mar 1. J Exp Bot. 2016. PMID: 26936829 Free PMC article.
-
Variation at the vernalisation genes Vrn-H1 and Vrn-H2 determines growth and yield stability in barley (Hordeum vulgare) grown under dryland conditions in Syria.Theor Appl Genet. 2013 Nov;126(11):2803-24. doi: 10.1007/s00122-013-2173-y. Epub 2013 Aug 6. Theor Appl Genet. 2013. PMID: 23918065
-
Major flowering time genes of barley: allelic diversity, effects, and comparison with wheat.Theor Appl Genet. 2021 Jul;134(7):1867-1897. doi: 10.1007/s00122-021-03824-z. Epub 2021 May 9. Theor Appl Genet. 2021. PMID: 33969431 Free PMC article. Review.
-
Drought and salt tolerances in wild relatives for wheat and barley improvement.Plant Cell Environ. 2010 Apr;33(4):670-85. doi: 10.1111/j.1365-3040.2009.02107.x. Epub 2010 Feb 5. Plant Cell Environ. 2010. PMID: 20040064 Review.
Cited by
-
A Comparison of Different Stomatal Density Phenotypes of Hordeum vulgare under Varied Watering Regimes Reveals Superior Genotypes with Enhanced Drought Tolerance.Plants (Basel). 2023 Aug 1;12(15):2840. doi: 10.3390/plants12152840. Plants (Basel). 2023. PMID: 37570994 Free PMC article.
-
Validation of SNP markers for selection of semi-dwarf and peduncle extrusion in barley.Mol Breed. 2023 Apr 13;43(4):30. doi: 10.1007/s11032-023-01371-7. eCollection 2023 Apr. Mol Breed. 2023. PMID: 37313525 Free PMC article.
-
Manipulating GA-Related Genes for Cereal Crop Improvement.Int J Mol Sci. 2022 Nov 14;23(22):14046. doi: 10.3390/ijms232214046. Int J Mol Sci. 2022. PMID: 36430524 Free PMC article. Review.
-
Identifying developmental QTL alleles with favorable effect on grain yield components under late-terminal drought in spring barley MAGIC population.Plant Direct. 2023 Aug 2;7(8):e516. doi: 10.1002/pld3.516. eCollection 2023 Aug. Plant Direct. 2023. PMID: 37538189 Free PMC article.
-
Genome-wide association study of agronomical and root-related traits in spring barley collection grown under field conditions.Front Plant Sci. 2023 Jan 24;14:1077631. doi: 10.3389/fpls.2023.1077631. eCollection 2023. Front Plant Sci. 2023. PMID: 36760640 Free PMC article.
References
-
- Samson J, Berteaux D, McGill BJ, Humphries MM. Geographic disparities and moral hazards in the predicted impacts of climate change on human populations. Global Ecology and Biogeography. 2011;20:532–544. doi: 10.1111/j.1466-8238.2010.00632.x. - DOI
-
- Field, C. B. et al. Detection and attribution of observed impacts. In: Climate Change 2014: Impacts, Adaptation, and Vulnerability. Part A: Global and Sectoral Aspects. Contribution of Working Group II to the Fifth Assessment Report of the Intergovernmental Panel on Climate Change. IPCC, 2014.
-
- Zhou, M. X. In Genetics and Improvement of Barley Malt Quality, edited by G. Zhang & C. Li (Springer-Verlag Berlin Heidelberg, Berlin, Heidelberg), pp. 1–17 (2010).
Publication types
MeSH terms
LinkOut - more resources
Full Text Sources
