Pten controls B-cell responsiveness and germinal center reaction by regulating the expression of IgD BCR
- PMID: 31015337
- PMCID: PMC6545559
- DOI: 10.15252/embj.2018100249
Pten controls B-cell responsiveness and germinal center reaction by regulating the expression of IgD BCR
Abstract
In contrast to other B-cell antigen receptor (BCR) classes, the function of IgD BCR on mature B cells remains largely elusive as mature B cells co-express IgM, which is sufficient for development, survival, and activation of B cells. Here, we show that IgD expression is regulated by the forkhead box transcription factor FoxO1, thereby shifting the responsiveness of mature B cells towards recognition of multivalent antigen. FoxO1 is repressed by phosphoinositide 3-kinase (PI3K) signaling and requires the lipid phosphatase Pten for its activation. Consequently, Pten-deficient B cells expressing knock-ins for BCR heavy and light chain genes are unable to upregulate IgD. Furthermore, in the presence of autoantigen, Pten-deficient B cells cannot eliminate the autoreactive BCR specificity by secondary light chain gene recombination. Instead, Pten-deficient B cells downregulate BCR expression and become unresponsive to further BCR-mediated stimulation. Notably, we observed a delayed germinal center (GC) reaction by IgD-deficient B cells after immunization with trinitrophenyl-ovalbumin (TNP-Ova), a commonly used antigen for T-cell-dependent antibody responses. Together, our data suggest that the activation of IgD expression by Pten/FoxO1 results in mature B cells that are selectively responsive to multivalent antigen and are capable of initiating rapid GC reactions and T-cell-dependent antibody responses.
Keywords: B‐cell differentiation; FoxO1; Pten; immune response; tolerance.
© 2019 The Authors. Published under the terms of the CC BY 4.0 license.
Conflict of interest statement
The authors declare that they have no conflict of interest.
Figures

Representative analysis of B220 and IgM surface expression in bone marrow (left) and spleen cells (right) of mice from the indicated genotypes.
Representative flow cytometric analysis of splenocytes from mice of the indicated genotypes (pre‐gated on B cells: B220+/CD19+) for surface expression of IgM and the 3‐83 idiotype (54.1). Shown data are representative of 11–35 individual mice per genotype.
PCR fragments amplified with specific primers for Vκ and Jκ5 from genomic DNA of purified splenic B cells from Pten f/f × 3‐83 ki and Pten f/f × mb1‐cre × 3‐83 ki mice on the respective backgrounds. Genomic tail DNA from a 3‐83 ki mouse and DNA from purified splenic B cells of a control (ctrl) mouse were used as controls. PCR for the splicing factor Srp20 served as a loading control. Kb and Kd indicate the respective background of the mice (H2‐Kb: +Ag).

- A
Intracellular expression of IgM (Ig‐μHC ic) in bone marrow (left) and spleen cells (right) was determined by flow cytometry and compared between the populations of B cells (green, identified by B220 and CD19 expression) and non‐B cells (gray). Numbers in the histograms indicate the percentages of the positive populations. Figures are representative of 11–35 individual mice per genotype.
- B
Intracellular Ca2+ influx was measured in CD90.2/Thy1.2− splenocytes derived from mice of the indicated genotypes following stimulation with 10 μg/ml α‐κLC antibody. Figures are representative of at least three individual mice per genotype.
- C
Serum IgM concentrations measured in mice of the indicated genotypes. Mean ± SD, symbols represent IgM concentrations from individual mice (n). Statistical significance was calculated by using the Kruskal–Wallis test (see also Appendix Table S1), n.s. = not significant; ****P ≤ 0.0001.
- D, E
Absolute numbers of B cells in bone marrow (D) and spleens (E) from mice of the respective genotypes, determined by B220/CD19 surface expression. Mean ± SD, symbols indicate the numbers of B cells in individual mice (n). Statistical significance was calculated by using the Kruskal–Wallis test (see also Appendix Tables S2 and S3), n.s. = not significant; *P ≤ 0.05; ***P ≤ 0.001; ****P ≤ 0.0001.
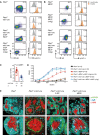
- A, B
Splenocytes from mice of the indicated genotypes, (A) Pten f/f, Pten f/f × mb1‐cre, and Pten f/f × mb1‐cre 3‐83 ki mice on the respective backgrounds, (B) Pten f/f × MD4 tg and Pten f/f × mb1‐cre × MD4 tg mice in presence and absence of antigen (ML5 tg), were analyzed by flow cytometry. B cells were pre‐gated by B220 and CD19 expression, and the IgM/IgD surface expression (dot plots, left) was determined. Histograms (right) show a comparison of intracellular IgD expression (Ig‐δHC ic) between the splenic populations of B cells (orange, identified by B220 and CD19 expression) and non‐B cells (gray). Numbers in the histograms indicate the percentages of the positive populations. Data are representative of 11–35 individual mice per genotype.
- C
Quantification of surface IgD mean fluorescence intensity (MFI) in Pten f/f × MD4‐transgenic mice in the presence (mb1‐cre +/+) and absence (mb1‐cre +/ki) of Pten. Single dots represent the average MFI of four independent measurements per mouse (n), mean ± SD. Statistical significance was calculated by using an unpaired two‐tailed t‐test.
- D
Serum anti‐HEL IgM titers. Sera from MD4 tg mice of the indicated genotypes were adjusted to an IgM concentration of 500 μg/ml and applied in triplicates to HEL‐coated plates in dilution steps of 1:3, mean ± SEM. Statistical significance was calculated by using the Kruskal–Wallis test (see also Appendix Table S4). Statements of significance in the figure refer to the comparison between Pten f/f × MD4 tg (filled red squares) and Pten f/f × MD4 tg × MD5 tg sera (filled orange triangles), **P ≤ 0.01; ***P ≤ 0.001.
- E
Immunohistochemistry of sections from spleens of Pten f/f, Pten f/ × mb1‐cre, Pten f/f × mb1‐cre × 3‐83 ki , and Pten f/f × mb1‐cre × MD4 tg mice for CD169 (green), CD5 (red), and IgM (cyan) at 10× magnification. Pictures in the second row show enlarged areas indicated by the white squares, respectively. Double arrows indicate the distance between T cell (red) and marginal zone (green). Shown pictures are representative of 2–3 mice per genotype (see also Appendix Fig S2).
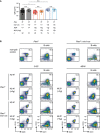
Serum IgM levels in Pten‐deficient MD4‐transgenic mice, compared to data from Pten f/f and Pten f/f × mb1‐cre controls, already shown in Fig 2C. Horizontal lines represent the mean ± SD, and symbols indicate serum IgM concentrations from individual mice (n). Statistical significance was calculated by using the Kruskal–Wallis test, n.s. = not significant, *P ≤ 0.05.
Mice of the indicated genotypes were sacrificed, and splenic B cells (pre‐gated by B220 and CD19 expression) were analyzed for surface expression of CD21 and CD23. Shown data are representative of 11–35 individual mice per genotype.
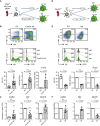
- A
Schematic overview of the transduction procedure: Purified Pten f/f × mb1‐cre × MD4 tg‐derived mature splenic B cells were cultured in the presence of LPS 2.5 μg/ml for 1.5 days and subjected to retroviral transduction with expression vectors encoding the constitutively active FoxO1 (FoxO1‐A3) or the empty vector (EV), respectively.
- B
Three days posttransduction, the surface expression of IgM/IgD (dot plots, top), IgD, and CD23 (histograms, bottom) was measured by flow cytometry and compared between EV‐ and FoxO1‐A3‐transduced cells. Fluorescence minus one (FMO) stainings, lacking α‐IgD or α‐CD23 antibodies, respectively, served as controls (ctrl). Bar diagrams below flow cytometric data display the percentages of IgD+ cells (n = 12; left) and MFI of CD23 (as relative units, RU), normalized to the MFI measured in the respective EV‐transduced cells (n = 12; middle). Fcer2 transcript levels were measured by quantitative reverse transcriptase (qRT)–PCR (right; n = 4). Mean ± SD, symbols indicate data from individual mice. Statistical significance of IgD expression was determined by applying the Wilcoxon matched‐pairs signed rank test for CD23 and by applying the one‐sample two‐tailed t‐test for Fcer2 expression.
- C
Cstf64 (n = 8), Ell2 (n = 8), and Zfp318 (n = 11) expression levels were measured at 3 days posttransduction by qRT–PCR. FoxO1‐A3‐ and EV‐transduced splenic B cells from Fig 4B were FACS‐purified according to the gating strategy shown in Fig EV2B. Mean ± SD, symbols indicate the expression in individual mice. Statistical significance was calculated by using the one‐sample two‐tailed t‐test.
- D
Schematic overview of transduction procedure: Purified FoxO1 f/f‐derived mature splenic B cells were cultured in the presence of 2.5 μg/ml LPS for 1.5 days and subjected to retroviral transduction with expression vectors encoding either cre or EV, respectively.
- E, F
Identical to Fig 4B and C using cells described in Fig 4D, E: IgD (n = 6), CD23 (n = 4), and Fcer2 (n = 4). F: Cstf64 (n = 4), Ell2 (n = 4), and Zfp318 (n = 4).

- A
Splenic B‐1 B cells were isolated, and IgD− cells were purified by MACS‐based‐negative selection. The enrichment efficiency was assessed by flow cytometric analysis of IgM/IgD surface expression.
- B, C
Enriched B‐1 B cells shown in Fig EV2A were cultured in the presence of 2.5 μg/ml LPS for 1.5 days and subjected to retroviral transduction with expression vectors encoding the constitutively active FoxO1 (FoxO1‐A3) or the empty vector (EV). Three days following transduction, cells were gated as shown in (B) and the surface expression of IgM/IgD (dot plots, left panel), IgD, and CD23 (histograms, right panel, numbers indicate the MFI) was measured by flow cytometry and compared between EV‐ and FoxO1‐A3‐transduced cells (C).
- D
Quantified percentages of IgD+ cells (left; n = 7) and MFI of CD23 (right, n = 6), mean ± SD. Symbols indicate data from individual mice. Statistical significance was calculated by using the Wilcoxon matched‐pairs signed rank test.
- E
Ighd (Ig‐δHC) expression in cells from Fig EV2C, measured by qRT–PCR, mean ± SD. Symbols indicate expression in individual mice (n = 4). Statistical significance was calculated by using the one‐sample two‐tailed t‐test.
- F
Expression vectors encoding cre or the EV were introduced into FoxO1 f/f‐derived mature splenic B cells, respectively. Three days upon transduction, intracellular FoxO1 expression was measured by flow cytometry and compared between EV‐ and cre‐transduced cells. Staining only with the secondary antibody served as control (ctrl).
- G
Quantified MFI of IgM (n = 6) in cells from Fig 4E, mean ± SD. Symbols indicate data from individual mice. Statistical significance was calculated by using the paired Wilcoxon test.
- H
Ighm (Ig‐μHC) and Cd79b (Ig‐β) expression levels measured at 3 days posttransduction by qRT–PCR in cre‐ and EV‐transduced FoxO1 f/f‐derived mature splenic B cells, mean ± SD. Symbols indicate the expression in individual mice (n = 4). Statistical significance was calculated by using the one‐sample two‐tailed t‐test.
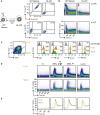
Establishment of BCR‐deficient Ramos cells: Schematic overview of BCR HC and LC gene deletion in Ramos cells by CRISPR/Cas (left). Flow cytometric analysis of BCR surface expression in WT and HC/LC‐deficient (HL‐KO) Ramos cells (right).
Comparison of intracellular Ca2+ influx measured in WT and HL‐KO Ramos cells upon stimulation with 10 μg/ml of α‐human μHC (top) or λLC (bottom) antibody, respectively.
Representative surface expression of IgM, IgD, Ig‐κLC, and HEL‐binding in splenic CD21lo/CD23+ (follicular (Fo.B), orange) and CD21hi/CD23lo/− (marginal zone (MZ.B), green) B cells from MD4 tg mice, as compared to non‐B cells (gray).
Representative intracellular Ca2+ influx measured in CD21hi/CD23lo/− (MZ.B) and CD21lo/CD23+ (Fo.B) B cells. Cells were purified by MACS (negative selection), then stained for CD21 and CD23, and subjected to Ca2+ measurement upon stimulation with either multivalent HEL (complex cHEL), monovalent (soluble sHEL; both at a concentration of 1 μg/ml), or 10 μg/ml α‐mouse κLC antibody, respectively. n.t. = non‐treated. Data are representative of three individual mice.
Overlaid MFI of the calcium influx kinetics displayed in the plots from Fig EV3D: green MZ.B; orange Fo.B.
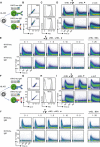
- A
Schematic overview of reconstitution of BCR‐deficient Ramos (HL‐KO) cells with murine HEL‐specific BCR of IgM (HH10‐mu IgM) or IgD (HH10‐mu IgD) isotype, respectively.
- B
Representative flow cytometric analysis of Ramos cells reconstituted with HH10‐mu IgM or HH10‐mu IgD, respectively. Cells were stained with α‐murine μHC, δHC, and κLC antibodies, respectively. EV‐transduced HL‐KO cells, expressing GFP only, were used as negative control (gray).
- C
Representative flow cytometric analysis of HEL‐binding in reconstituted Ramos cells after staining with fluorescently labeled HEL. EV‐transduced HL‐KO cells, expressing GFP only, were used as negative control (gray).
- D
Representative intracellular Ca2+ influx in HH10‐mu IgM‐ and HH10‐mu IgD‐expressing cells upon stimulation with multivalent HEL (complex cHEL), monovalent (soluble sHEL; both at a concentration of 1 μg/ml), or 10 μg/ml α‐mouse κLC antibody, respectively.
- E
Representative intracellular Ca2+ influx of HH10‐mu IgM‐ (top) and HH10‐mu IgD‐ (bottom) expressing cells upon stimulation with indicated ratios of 1 μg/ml cHEL and sHEL, and a 1:25 mixture of cHEL with bovine serum albumin (BSA), where 1 = 1 μg/ml.
- F
Schematic overview of reconstitution of BCR‐deficient Ramos (HL‐KO) cells with HH10‐specific human IgM (HH10‐hu IgM) or IgD (HH10‐hu IgD) BCR isotype, respectively.
- G–J
Identical to Fig 5B–E using HH10‐hu IgM‐ and HH10‐hu IgD‐expressing cells instead of HH10‐mu IgM‐ and HH10‐mu IgD‐expressing cells, respectively. Data shown in B–E and G–J are representative of at least three independent experiments.

Quantification of surface IgM (top) and IgD (bottom) MFI in B cells from mice of the indicated genotypes. Single dots represent the average MFI of four independent measurements per mouse (n), mean ± SD. IgD expression of Pten f/f × MD4 tg and Pten f/f × mb1‐cre × MD4 tg B cells already shown in Fig 3C. Statistical significance was calculated by using the Kruskal–Wallis test (see also Appendix Table S5), n.s. = not significant; **P ≤ 0.01; ***P ≤ 0.001; ****P ≤ 0.0001.
Representative intracellular Ca2+ influx measured in Thy1.2− splenocytes, derived from mice of the indicated genotypes, upon stimulation with cHEL, monovalent sHEL (both at a concentration of 1 μg/ml) or 10 μg/ml α‐mouse κLC antibody, respectively. Line diagrams below the dot plots show the overlaid MFI of the Ca2+ influx kinetics displayed in the plots above.
Quantification of intracellular Ca2+ influx from Fig 6B. The median area under the curve of the Ca2+ influx kinetics was calculated, and single dots represent data from individual mice, mean ± SD. Statistical significance was calculated by applying the Mann–Whitney U‐test (see also Appendix Table S6), n.s. = not significant, **P ≤ 0.01.
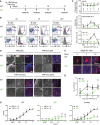
Schematic overview of the procedure of mouse immunization with 2,4,6‐trinitrophenyl hapten conjugated to ovalbumin (TNP‐Ova) and analysis of germinal center (GC) reactions at different time intervals. Control animals were injected intraperitoneally (i.p.) with PBS and quantified as day 0 of immunization.
Analysis of GC B cells in splenic B220+ B cells from wild‐type (WT, top) and IgD−/− (bottom) animals after 4, 7, and 10 days (left to right) postimmunization. Percentages of follicular B cells (Fo.B; CD38+/CD95−) and GC B cells (CD38−/CD95+) are depicted in the plots. GC B cells (CD38−/CD95+) were further analyzed for GL‐7 expression, compared to Fo.B cells and quantified.
Quantification of Fo.B cells (top, percentages) and CD38−/CD95+/GL‐7+ GC cells (percentages and absolute numbers, bottom panels) in WT (black) and IgD−/− (green) animals after 4, 7, 10, and 14 days postimmunization, mean ± SD (numbers of animals indicated in the top plot). Statistical significance was analyzed by a two‐tailed unpaired t‐test.
Analysis of GC in spleen sections from WT and IgD−/− animals after 4, 7, and 10 days postimmunization. Representative images of 2 × 2 mm sections stained with DAPI (nuclei blue) and peanut agglutinin (PNA red) are shown for the indicated time points. Scale bar represents 500 μm. Dashed white or yellow lines mark distinct GC foci in the merged images.
Representative 800 × 800 μm regions of areas marked by yellow‐dashed lines within the images of D are shown as enlarged single GCs. As no distinct GC foci were observed in IgD−/− samples from days 4 and 7, an identical 800 × 800 μm region is shown in each case.
Quantification of number of GCs per mm2 area of spleen sections from WT (black) and IgD−/− (green) animals after 4, 7, and 10 days postimmunization. Data represent mean ± SD of two sections (from three animals per group and time point) and were analyzed by two‐tailed unpaired t‐test.
Total serum α‐TNP IgG. Sera from PBS‐ or TNP‐Ova‐immunized WT (left) and IgD−/− (middle) mice, collected at day 7 following immunization, were adjusted to an IgG concentration of 1 μg/ml and applied in duplicates and dilution steps of 1:3 to TNP‐coated plates, respectively, mean ± SEM. Right: Overlay of α‐TNP IgG titers from TNP‐Ova‐immunized WT and IgD−/− mice. Statistical significance was calculated by using the Mann–Whitney U‐test (see also Appendix Table S7), n.s. = not significant, *P ≤ 0.05, **P ≤ 0.01.

Schematic overview of immunization procedure of mice with sheep red blood cells (SRBC) and analysis of germinal center (GC) reactions at different time intervals. Control animals were injected intraperitoneally (i.p.) with PBS and quantified as 0 days of immunization.
Analysis of GC B cells in spleens from SRBC‐immunized WT or IgD−/− mice. Percentages of follicular B cells (Fo.B; CD38+/CD95−) and GC B cells (CD38−/CD95+) are depicted in the plots. GC B cells (CD38−/CD95+) were further analyzed for GL‐7 expression.
Quantification of follicular B cells (top, percentages) and CD38−/CD95+/GL‐7+ GC cells (percentages and absolute numbers, bottom panels) in WT (black) and IgD−/− (green) animals after 7 and 10 days postimmunization, mean ± SD (number of animals indicated in the top plot). Statistical significance was analyzed by a two‐tailed unpaired t‐test, n.s. = not significant.
Similar articles
-
PTEN-Regulated AID Transcription in Germinal Center B Cells Is Essential for the Class-Switch Recombination and IgG Antibody Responses.Front Immunol. 2018 Feb 28;9:371. doi: 10.3389/fimmu.2018.00371. eCollection 2018. Front Immunol. 2018. PMID: 29541074 Free PMC article.
-
IgM and IgD B cell receptors differentially respond to endogenous antigens and control B cell fate.Elife. 2018 Mar 9;7:e35074. doi: 10.7554/eLife.35074. Elife. 2018. PMID: 29521626 Free PMC article.
-
CXCR4 signaling and function require the expression of the IgD-class B-cell antigen receptor.Proc Natl Acad Sci U S A. 2017 May 16;114(20):5231-5236. doi: 10.1073/pnas.1621512114. Epub 2017 May 1. Proc Natl Acad Sci U S A. 2017. PMID: 28461496 Free PMC article.
-
Immunoglobulin D and its encoding genes: An updated review.Dev Comp Immunol. 2021 Nov;124:104198. doi: 10.1016/j.dci.2021.104198. Epub 2021 Jul 5. Dev Comp Immunol. 2021. PMID: 34237381 Review.
-
Control of B Cell Responsiveness by Isotype and Structural Elements of the Antigen Receptor.Trends Immunol. 2016 May;37(5):310-320. doi: 10.1016/j.it.2016.03.004. Epub 2016 Apr 1. Trends Immunol. 2016. PMID: 27052149 Review.
Cited by
-
Aberrant B Cell Signaling in Autoimmune Diseases.Cells. 2022 Oct 27;11(21):3391. doi: 10.3390/cells11213391. Cells. 2022. PMID: 36359789 Free PMC article. Review.
-
Multimericity Amplifies the Synergy of BCR and TLR4 for B Cell Activation and Antibody Class Switching.Front Immunol. 2022 May 19;13:882502. doi: 10.3389/fimmu.2022.882502. eCollection 2022. Front Immunol. 2022. PMID: 35663959 Free PMC article.
-
Primary Immune Responses and Affinity Maturation Are Controlled by IgD.Front Immunol. 2021 Aug 9;12:709240. doi: 10.3389/fimmu.2021.709240. eCollection 2021. Front Immunol. 2021. PMID: 34434193 Free PMC article.
-
Autoreactive antibodies control blood glucose by regulating insulin homeostasis.Proc Natl Acad Sci U S A. 2022 Feb 8;119(6):e2115695119. doi: 10.1073/pnas.2115695119. Proc Natl Acad Sci U S A. 2022. PMID: 35131852 Free PMC article.
-
Recent Advances in Lupus B Cell Biology: PI3K, IFNγ, and Chromatin.Front Immunol. 2021 Jan 14;11:615673. doi: 10.3389/fimmu.2020.615673. eCollection 2020. Front Immunol. 2021. PMID: 33519824 Free PMC article. Review.
References
-
- Allen CD, Ansel KM, Low C, Lesley R, Tamamura H, Fujii N, Cyster JG (2004) Germinal center dark and light zone organization is mediated by CXCR4 and CXCR5. Nat Immunol 5: 943–952 - PubMed
-
- Anderson KE, Coadwell J, Stephens LR, Hawkins PT (1998) Translocation of PDK‐1 to the plasma membrane is important in allowing PDK‐1 to activate protein kinase B. Curr Biol 8: 684–691 - PubMed
Publication types
MeSH terms
Substances
Grants and funding
LinkOut - more resources
Full Text Sources
Other Literature Sources
Molecular Biology Databases
Research Materials
Miscellaneous

