. 2019 Jun 20;74(6):1148-1163.e7.
doi: 10.1016/j.molcel.2019.03.025. Epub 2019 Apr 17.

TAF5L and TAF6L Maintain Self-Renewal of Embryonic Stem Cells via the MYC Regulatory Network

Affiliations

TAF5L and TAF6L Maintain Self-Renewal of Embryonic Stem Cells via the MYC Regulatory Network

Davide Seruggia et al. Mol Cell. .

Abstract

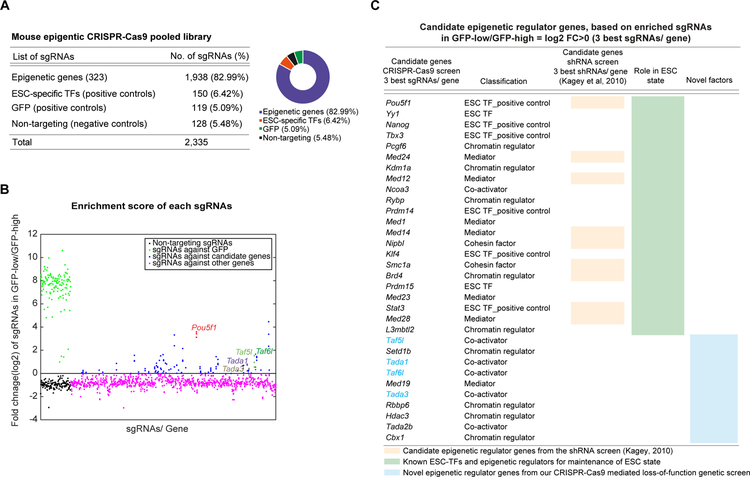
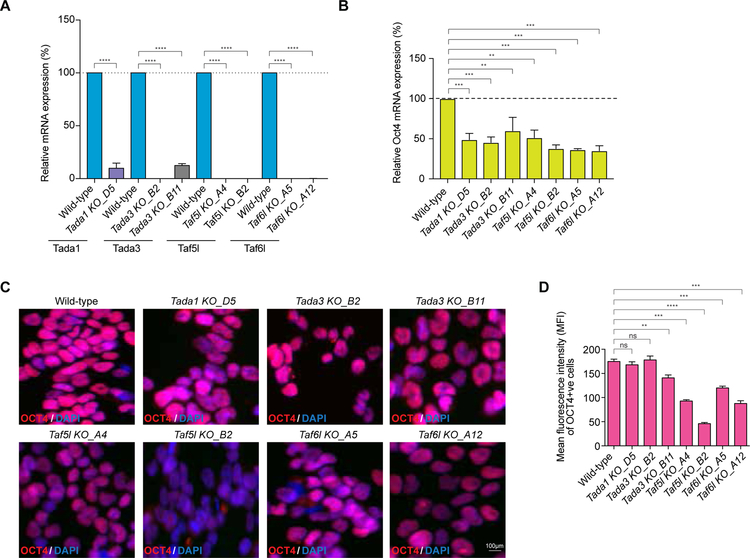
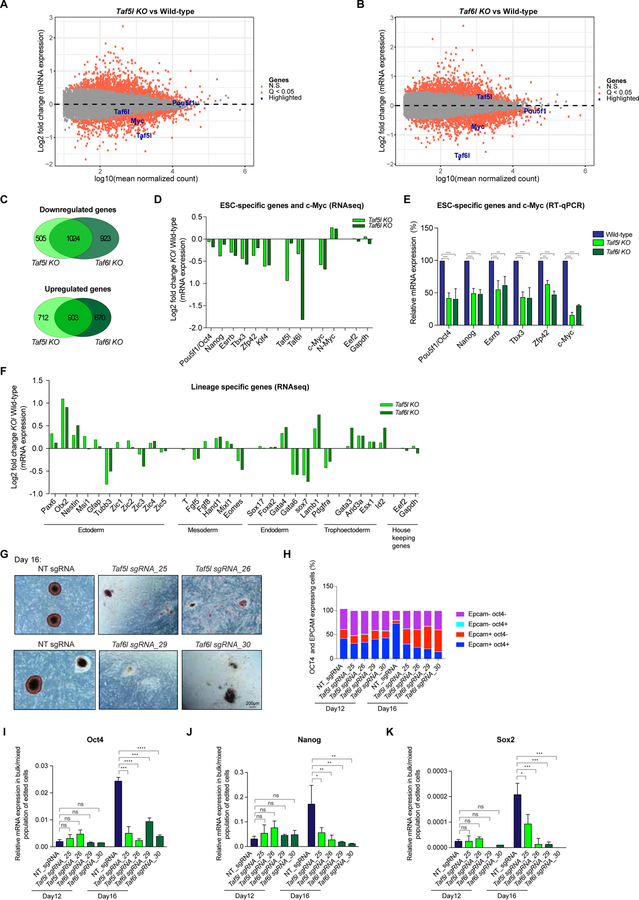
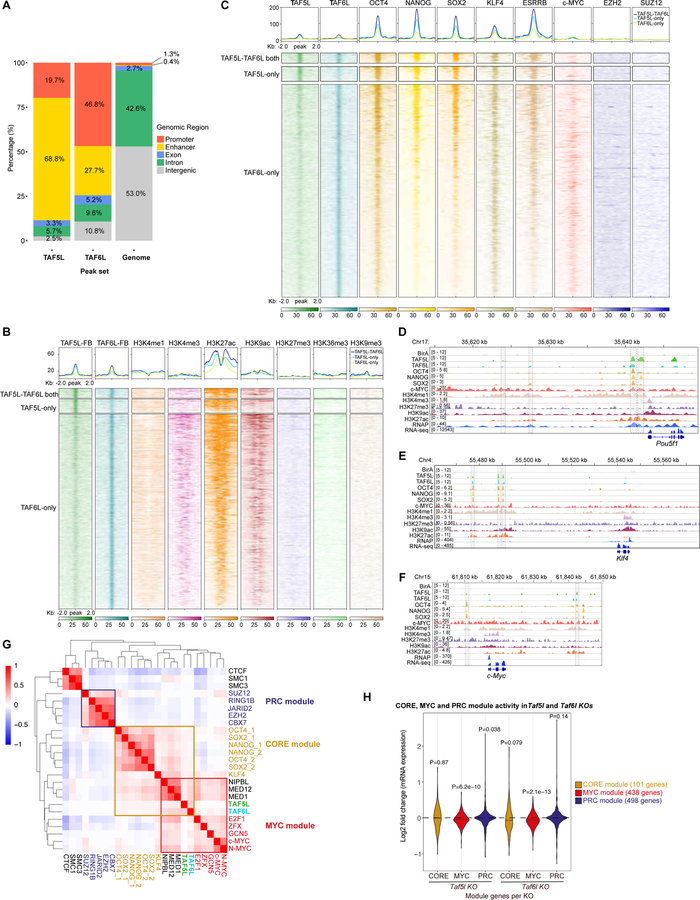
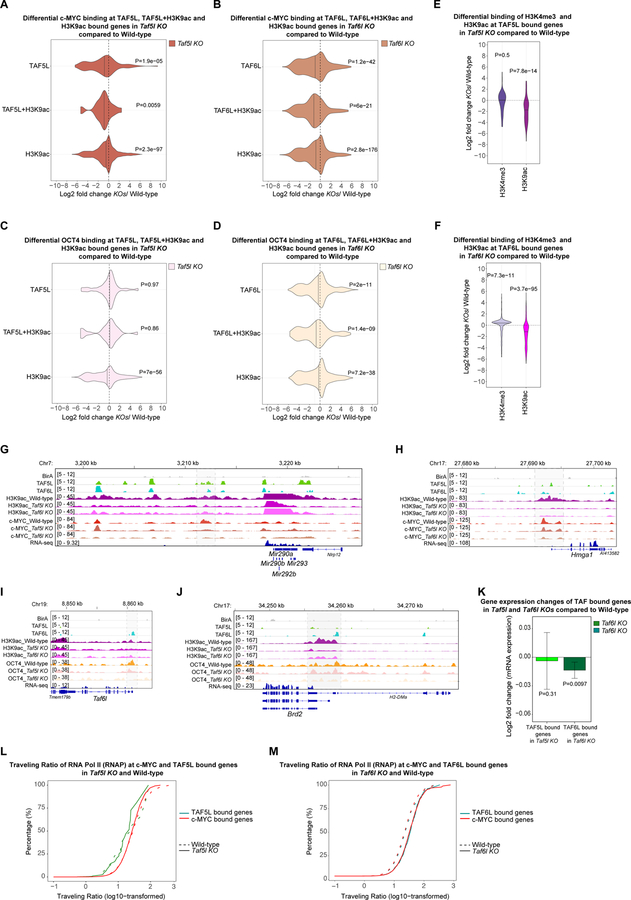
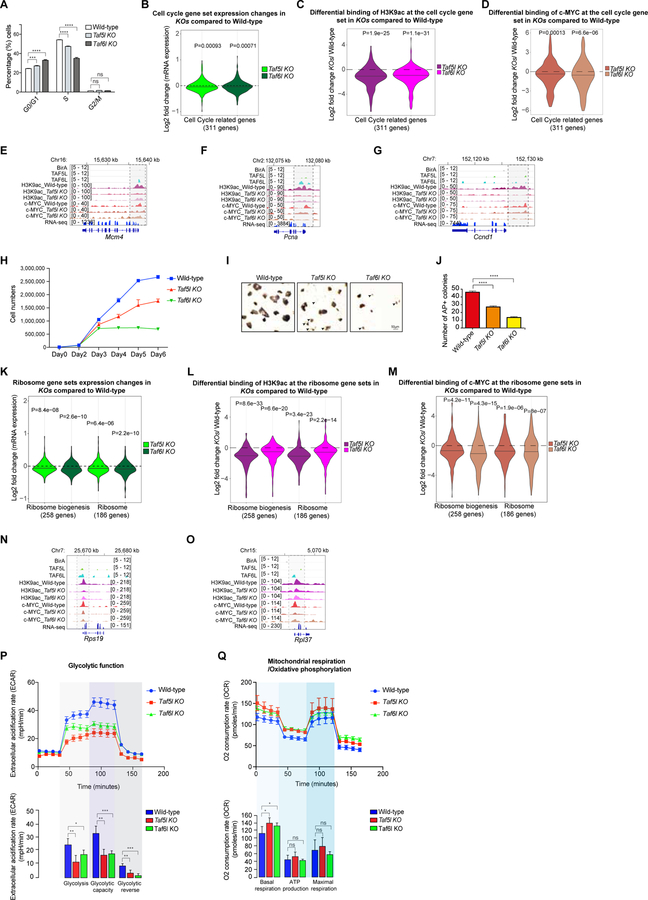
Self-renewal and pluripotency of the embryonic stem cell (ESC) state are established and maintained by multiple regulatory networks that comprise transcription factors and epigenetic regulators. While much has been learned regarding transcription factors, the function of epigenetic regulators in these networks is less well defined. We conducted a CRISPR-Cas9-mediated loss-of-function genetic screen that identified two epigenetic regulators, TAF5L and TAF6L, components or co-activators of the GNAT-HAT complexes for the mouse ESC (mESC) state. Detailed molecular studies demonstrate that TAF5L/TAF6L transcriptionally activate c-Myc and Oct4 and their corresponding MYC and CORE regulatory networks. Besides, TAF5L/TAF6L predominantly regulate their target genes through H3K9ac deposition and c-MYC recruitment that eventually activate the MYC regulatory network for self-renewal of mESCs. Thus, our findings uncover a role of TAF5L/TAF6L in directing the MYC regulatory network that orchestrates gene expression programs to control self-renewal for the maintenance of mESC state.

Keywords: CRISPR; ESC; MYC; OCT4; TAF5L; TAF6L.


Conflict of interest statement

The authors declare no conflicts of interest.

Figures

Figure 1
Figure 1. CRISPR-Cas9 mediated loss-of-function genetic screen identifies potential candidate epigenetic genes for the mESC state
(A) Mouse epigenetic CRISPR-Cas9 pooled library distribution. (B) Dot plot analysis shows enrichment scores of sgRNAs by comparing their frequency in the GFP-low cells over the GFP-high cells. Enrichment scores of the three-best individual sgRNAs per gene are represented. sgRNAs are ranked based on their corresponding target gene names, alphabetically from left to right on the X-axis. sgRNAs targeting GFP (positive controls, in green), non-targeting sgRNAs (negative controls, in black), and sgRNAs targeting all candidate genes (in blue) are shown. The sgRNAs targeting novel candidate epigenetic genes (Taf5l, Taf6l, Tada1 and Tada3) are labelled. The sgRNAs targeting Pou5f1/Oct4 (master regulator of mESCs, used as positive control; in red) provide high enrichment scores. (C) List of candidate epigenetic regulator and TF genes ranked by enrichment scores. Candidate genes that have been previously identified through either shRNA screens (orange column) or individual functional studies (green column) related to mESC state are shown. Novel candidate epigenetic genes are also presented (blue column); among them Taf5l, Taf6l, Tada1 and Tada3 were selected for further validation. Related to Figure S1.
Figure 2
Figure 2. Validation confirms TAF5L and TAF6L are the new epigenetic genes for the mESC state
(A) RT-qPCR data showing mRNA expression levels of Tada1, Tada3, Taf5l and Taf6l in their corresponding KOs compared to wild-type. mRNA levels were normalized to GAPDH. Paired sgRNAs were used to target exon/s at the N-terminal of Tada1, Tada3, Taf5l and Taf6l candidate epigenetic genes to create homozygous/biallelic deletion or KO clones. (B) Endogenous Oct4 mRNA expression levels in the Tada1, Tada3, Taf5l and Taf6l KOs. (C) Immunofluorescence staining of OCT4 in the Tada1, Tada3, Taf5l and Taf6l KOs. Scale bar is 100µm. (D) Quantification of mean fluorescence intensity (MFI) of OCT4 in the Tada1, Tada3, Taf5l and Taf6l KOs. Data are represented as mean ± SEM (n = 3); p-values were calculated using ANOVA. *p < 0.05; **p < 0.01; ***p < 0.001; ****p < 0.0001; and ns (non-significant). Related to Figure S2.
Figure 3
Figure 3. TAF5L and TAF6L are required for gene expression programs of mESC state; and for somatic cell reprogramming/iPSCs generation
(A, B) Scatter plots showing differentially expressed genes from Taf5l KO (A) and Taf6l KO (B), compared to wild-type mESCs. Orange dots are significantly up and downregulated genes in Taf5l and Taf6l KOs with a q-value <0.05. Grey dots are unaltered genes in KOs compared to wild-type. Genes of interest are labelled in the scatter plot. (C) Venn diagrams represent overlapped up or downregulated genes between Taf5l KO and Taf6l KO. (D) mRNA expression levels of mouse ESC-specific genes, c-Myc and N-Myc in Taf5l and Taf6l KOs compared to wild-type (from RNAseq). Eef2 and Gapdh used as internal controls. (E) mRNA expression levels of mouse ESC-specific genes and c-Myc in Taf5l and Taf6l KOs compared to wild-type (from RT-qPCR). mRNA levels were normalized to GAPDH. (F) mRNA expression levels of lineage-specific genes in Taf5l and Taf6l KOs compared to wild-type (from RNAseq). (G) AP staining of transgene-independent iPSC colonies following reprogramming (at day 16). Scale bar is 200µm. (H) FACS analysis showing quantification of relative percentages of OCT4 and EPCAM expressing cells after reprogramming at day 12 and day 16. (I-K) mRNA expression levels of ESC Core TFs– endogenous Oct4, Nanog, Sox2 in bulk/mixed populations of edited cells after reprogramming at day 12 and day 16, upon perturbation of Taf5l and Taf6l using sgRNAs. Non-targeting sgRNA used as control. Data are represented as mean ± SEM (n = 3); p-values were calculated using ANOVA. *p < 0.05; **p < 0.01; ***p < 0.001; ****p < 0.0001; and ns (non-significant). Related to Figure S3.
Figure 4
Figure 4. TAF5L and TAF6L belong to the MYC and CORE regulatory modules but mainly regulate the MYC module activity
(A) A bar chart shows the genome-wide binding distribution of TAF5L-FB and TAF6L-FB. (B) A heat map displaying co-occupancy between different active and repressive histone marks with TAF5L-TAF6L both, TAF5L-only and TAF6L-only binding regions. (C) A heat map representing co-occupied regions of ESC-TFs (OCT4, NANOG, SOX2, KLF4, ESRRB); components of the PRC2 complex (EZH2, SUZ12); and c-MYC binding sites with TAF5L-TAF6L both, TAF5L-only and TAF6L-only binding regions. (D-F) Genomic tracks of ChIP intensities of several factors, including TAF5L and TAF6L, and histone marks binding at Oct4/pou5f1, Klf4 and c-Myc gene loci. RNAseq tracks represent expression of these genes. (G) A target correlation map of binding loci shows the degree of co-occupancy between selected TFs and chromatin/epigenetic regulators; three clusters or modules are presented: CORE, MYC and PRC. The colour scale depicts the Pearson correlation coefficient, and the clustering tree is derived from hierarchical clustering. Red colour indicates more frequent co-occupancy between factors. (H) A violin plot representing changes in CORE, MYC and PRC module gene expression in Taf5l and Taf6l KOs compared to wild-type. Related to Figure S4.
Figure 5
Figure 5. Predominantly TAF5L/TAF6L modulate H3K9ac deposition and c-MYC recruitment at the TAF5L/TAF6L target genes to activate their gene expression through RNA Pol II pause release
(A) Differential binding of c-MYC at the TAF5L, TAF5L+H3K9ac and H3K9ac bound genes in Taf5l KO compared to wild-type. (B) Differential binding of c-MYC at the TAF6L, TAF6L+H3K9ac and H3K9ac bound genes in Taf6l KO compared to wild-type. (C) Differential binding of OCT4 at the TAF5L, TAF5L+H3K9ac and H3K9ac bound genes in Taf5l KO compared to wild-type. (D) Differential binding of OCT4 at the TAF6L, TAF6L+H3K9ac and H3K9ac bound genes in Taf6l KO compared to wild-type. (E) Differential binding of H3K9ac and H3K4me3 at the TAF5L bound genes in Taf5l KO compared to wild-type. (F) Differential binding of H3K9ac and H3K4me3 at the TAF6L bound genes in Taf6l KO compared to wild-type. (G, H) Genomic tracks of H3K9ac and c-MYC binding at miR 290–295 cluster and Hmga1 gene loci from wild-type, Taf5l and Taf6l KOs. Genomic tracks of BirA (control), TAF5L and TAF6L binding are presented at the same gene loci. Highlighted regions show changes of H3K9ac and c-MYC binding. (I, J) Genomic tracks of H3K9ac and OCT4 binding at Taf6l and Brd2 gene loci from wild-type, Taf5l and Taf6l KOs. Genomic tracks of BirA (control), TAF5L and TAF6L binding are presented at the same gene loci. Highlighted regions show changes of H3K9ac and OCT4 binding. (K) Gene expression changes of TAF5L and TAF6L bound genes in Taf5l and Taf6l KOs, respectively. (L) The traveling ratio (TR) of RNA Pol II (RNAP) at c-MYC and TAF5L bound genes in Taf5l KO and wild-type. (M) The traveling ratio (TR) of RNA Pol II (RNAP) at c-MYC and TAF6L bound genes in Taf6l KO and wild-type. Related to Figure S5.
Figure 6
Figure 6. TAF5L/TAF6L maintain self-renewal of mESCs through MYC regulatory module/network
(A) Quantitative analysis of different cell cycle phases from wild-type, Taf5l and Taf6l KOs. (B) Cell cycle gene set expression changes in Taf5l and Taf6l KOs compared to wild-type. (C, D) Differential binding of H3K9ac (C) c-MYC (D) at the cell cycle gene set in Taf5l and Taf6l KOs compared to wild-type. (E-G) Genomic tracks of H3K9ac and c-MYC binding at Mcm4, Pcna and Ccnd1 gene loci from wild-type, Taf5l and Taf6l KOs. Genomic tracks of BirA, TAF5L and TAF6L binding are presented at the same gene loci. RNAseq tracks show the expression of these genes in mESCs. Highlighted regions display changes of H3K9ac and c-MYC occupancy. (H) Cell proliferation assay from wild-type, Taf5l and Taf6l KOs (day0 to day6). (I) Alkaline phosphatase (AP)+ colonies from wild-type, Taf5l and Taf6l KO mESCs. Arrowheads indicate differentiating cells. Scale bar: 50µm. (J) Quantification of numbers of AP+ colonies (12-well scale). (K) Expression changes of two ribosome gene sets in Taf5l and Taf6l KOs compared to wild-type. (L, M) Differential binding of H3K9ac (L) and c-MYC (M) at the ribosomes gene sets in Taf5l and Taf6l KOs compared to wild-type. (N-O) Genomic tracks of H3K9ac and c-MYC binding at ribosome (Rps19 and Rpl37) gene loci from wild-type, Taf5l and Taf6l KOs. Genomic tracks of BirA, TAF5L and TAF6L binding are presented at the same loci. RNAseq tracks show the expression of these genes in mESCs. Highlighted regions show changes of H3K9ac and c-MYC occupancy. (P) Glycolytic function measurement using extracellular acidification rate (ECAR) from wild-type, Taf5l and Taf6l KOs. (Q) Oxidative phosphorylation activity presented based on oxygen consumption rate from wild-type, Taf5l and Taf6l KOs. Data are represented as mean ± SEM (n = 3); p-values were calculated using ANOVA. *p < 0.05; **p < 0.01; ***p < 0.001; ****p < 0.0001; and ns (non-significant). Related to Figure S6 and S7.
Figure 7
Figure 7. A model represents the detailed function of TAF5L and TAF6L in mESCs
The proposed model describes TAF5L and TAF6L transcriptionally activate c-Myc gene expression. Also, TAF5L/TAF6L regulate their target genes through H3K9ac deposition and c-MYC recruitment that eventually activate the MYC regulatory network for self-renewal of mESCs. Similarly, TAF5L and TAF6L transcriptionally activate Oct4 gene expression. Particularly, TAF6L modulate H3K9ac deposition and Oct4 recruitment at their target sites to activate ESC/CORE regulatory network that controls self-renewal and a low-level of pluripotency/differentiation of mESCs. Our findings suggest that TAF5L/TAF6L predominantly activates c-Myc and the MYC regulatory network over Oct4 and the CORE regulatory network to control mainly self-renewal for the maintenance of mESC state. TAF5L/TAF6L mediated gene activation of c-Myc and Oct4, and their corresponding activated MYC and CORE networks are shown. MYC network display in larger bold font (bright red), compared to CORE network (light orange)– represents predominant MYC network activity over CORE network. The thick arrowhead (red) depicts the activated MYC network that primarily directs the self-renewal of mESCs. Simultaneously, the thin arrowhead (light orange) illustrates an activated CORE network that controls a low-level of self-renewal and differentiation of mESCs.

Similar articles

Cited by

References

    1. Ashburner M, Ball CA, Blake JA, Botstein D, Butler H, Cherry JM, Davis AP, Dolinski K, Dwight SS, Eppig JT, et al. (2000). Gene ontology: tool for the unification of biology. The Gene Ontology Consortium. Nature Genetics 25, 25–29. - PMC - PubMed
    1. Bilodeau S, Kagey MH, Frampton GM, Rahl PB, and Young RA (2009). SetDB1 contributes to repression of genes encoding developmental regulators and maintenance of ES cell state. Genes Dev 23, 2484–2489. - PMC - PubMed
    1. Boyer LA, Plath K, Zeitlinger J, Brambrink T, Medeiros LA, Lee TI, Levine SS, Wernig M, Tajonar A, Ray MK, et al. (2006). Polycomb complexes repress developmental regulators in murine embryonic stem cells. Nature 441, 349–353. - PubMed
    1. Canver MC, Lessard S, Pinello L, Wu Y, Ilboudo Y, Stern EN, Needleman AJ, Galactéros F, Brugnara C, Kutlar A, et al. (2017). Variant-aware saturating mutagenesis using multiple Cas9 nucleases identifies regulatory elements at trait-associated loci. Nature Publishing Group 49, 625–634. - PMC - PubMed
    1. Cao Y, Guo WT, Tian S, He X, Wang XW, Liu X, Gu KL, Ma X, Huang D, Hu L, et al. (2015). miR-290/371-Mbd2-Myc circuit regulates glycolytic metabolism to promote pluripotency. The EMBO Journal 34, 609–623. - PMC - PubMed

Publication types

MeSH terms