. 2019 Jun 14;294(24):9402-9415.
doi: 10.1074/jbc.RA119.007504. Epub 2019 Apr 19.

The priming factor CAPS1 regulates dense-core vesicle acidification by interacting with rabconnectin3β/WDR7 in neuroendocrine cells

Affiliations

The priming factor CAPS1 regulates dense-core vesicle acidification by interacting with rabconnectin3β/WDR7 in neuroendocrine cells

Ellen Crummy et al. J Biol Chem. .

Abstract

Vacuolar-type H+-ATPases (V-ATPases) contribute to pH regulation and play key roles in secretory and endocytic pathways. Dense-core vesicles (DCVs) in neuroendocrine cells are maintained at an acidic pH, which is part of the electrochemical driving force for neurotransmitter loading and is required for hormonal propeptide processing. Genetic loss of CAPS1 (aka calcium-dependent activator protein for secretion, CADPS), a vesicle-bound priming factor required for DCV exocytosis, dissipates the pH gradient across DCV membranes and reduces neurotransmitter loading. However, the basis for CAPS1 binding to DCVs and for its regulation of vesicle pH has not been determined. Here, MS analysis of CAPS1 immunoprecipitates from brain membrane fractions revealed that CAPS1 associates with a rabconnectin3 (Rbcn3) complex comprising Dmx-like 2 (DMXL2) and WD repeat domain 7 (WDR7) proteins. Using immunofluorescence microscopy, we found that Rbcn3α/DMXL2 and Rbcn3β/WDR7 colocalize with CAPS1 on DCVs in human neuroendocrine (BON) cells. The shRNA-mediated knockdown of Rbcn3β/WDR7 redistributed CAPS1 from DCVs to the cytosol, indicating that Rbcn3β/WDR7 is essential for optimal DCV localization of CAPS1. Moreover, cell-free experiments revealed direct binding of CAPS1 to Rbcn3β/WDR7, and cell assays indicated that Rbcn3β/WDR7 recruits soluble CAPS1 to membranes. As anticipated by the reported association of Rbcn3 with V-ATPase, we found that knocking down CAPS1, Rbcn3α, or Rbcn3β in neuroendocrine cells impaired rates of DCV reacidification. These findings reveal a basis for CAPS1 binding to DCVs and for CAPS1 regulation of V-ATPase activity via Rbcn3β/WDR7 interactions.

Keywords: CAPS; H+-ATPase; WDR7; cellular regulation; dense-core vesicle; exocytosis; intracellular trafficking; organellar pH homeostasis; protein-protein interaction; rabconnectin3.


Conflict of interest statement

The authors declare that they have no conflicts of interest with the contents of this article

Figures
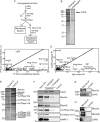
Figure 1.
Figure 1.
MS analysis of CAPS immunoprecipitates from vesicle-enriched brain membrane fraction. A, schematic of differential centrifugation steps to obtain crude vesicle/synaptosome preparation. B, representative Coomassie-stained SDS-PAGE of CAPS immunoprecipitates from membrane fraction without or with detergent solubilization. The arrow indicates CAPS1. C, scatterplot of total spectral counts of proteins coimmunoprecipitated with (y axis) and without (x axis) detergent solubilization. Proteins along the center line are equally abundant in both fractions, whereas proteins above the center line are highly enriched in CAPS1 immunoprecipitates from detergent-solubilized membranes. A subset of proteins are annotated. D, scatterplot of proteins coimmunoprecipitated from membrane-solubilized fraction using CAPS1 antibody (y axis) versus rabbit IgG control (x axis). Proteins along the center line are equally abundant in both fractions, whereas those enriched in CAPS1 immunoprecipitates (IP) are above the center line. A subset of proteins are annotated. E, Coomassie-stained proteins on SDS-PAGE from immunoprecipitates of detergent extracts with CAPS1 antibody (right lane) or control rabbit IgGs (left lane). LC-MS/MS identification of selected bands is shown. F, Western blot of CAPS and control immunoprecipitates confirmed LC-MS/MS identifications of Rbcn3α, Rbcn3β, and V1A1 and V0a1 domain subunits of V-ATPase. Note that vesicle proteins such as VAMP2 were de-enriched in CAPS1 immunoprecipitates of detergent-solubilized membranes. G, Rbcn3α antibodies (left) but not control IgGs (right) coimmunoprecipitate CAPS1. H, Rbcn3β antibodies (left) but not control IgGs (right) coimmunoprecipitate Rbcn3α and CAPS1. Results shown are representative of two to five independent experiments.
Figure 2.
Figure 2.
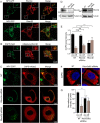
Rbcn3β knockdown disrupts CAPS1 localization to DCVs. A, confocal images of BON cells stably expressing NPY-GFP as DCV cargo that were fixed for antibody staining for Rbcn3α (top) or Rbcn3β (bottom). Inset boxes show enlargements. Representative images from three experiments are shown. Colocalization of Rbcn3α and Rbcn3β with NPY-GFP–containing DCVs based on Pearson correlation coefficient was 0.67 ± 0.09 (n = 8) for Rbcn3α and 0.52 ± 0.02 (n = 8) for Rbcn3β. B, confocal image of BON cells expressing EGFP-Rab3 and mNeptune-Rbcn3β. Inset boxes show enlargements. Representative images from three experiments are shown. Colocalization based on Pearson correlation coefficient was 0.53 ± 0.07 (n = 4). C, representative confocal images of BON cells stably expressing NPY-GFP and CAPS1-mKate2 and transfected with NT, Rbcn3α, or Rbcn3β siRNA pools. Pearson correlation coefficients for NPY-GFP and CAPS1-mKate2 localization were 0.73 ± 0.01 for cells transfected with NT siRNA pools, 0.58 ± 0.04 for cells transfected with siRNA pools targeting Rbcn3α, and 0.35 ± 0.03 for cells transfected with siRNA pools targeting Rbcn3β (values are the mean ± S.E. of five different cells from three independent experiments). Comparison of NT with Rbcn3β knockdown was highly significant at p < 0.0005. D, siRNA pools reduced Rbcn3α by 85% and reduced Rbcn3β by 70% as normalized to tubulin. E, quantification of CAPS1 on DCVs (On) and cytosolic CAPS1 (Off) for cells transfected with NT, Rbcn3α, or Rbcn3β siRNA pools. Values shown represent mean ± S.E. of five different cells from three independent experiments. ***, p < 0.0005. F, representative images of CAPS1 immunofluorescence in cells treated with nontargeting siRNA pools or a combination of individual siRNAs that target Rbcn3α and Rbcn3β. G, quantification of CAPS1 on membrane (On) and cytosolic CAPS1 (Off). Values shown are mean ± S.E. (n = 3; *, p < 0.05). n.s., not significant.
Figure 3.
Figure 3.
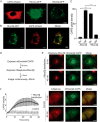
Rbcn3β expression in COS cells recruits CAPS1 to membrane structures. A, representative epifluorescence images of COS cells expressing CAPS1-mKate2, Rbcn3α-GFP, or Rbcn3β-GFP. B, representative confocal image of COS cells coexpressing Rbcn3β-GFP and CAPS1-mKate2 showing that CAPS1-mKate2 is recruited to Rbcn3β-containing membranes. C, studies were quantified by determining mean pixel intensity of CAPS1-mKate2 on Rbcn3β-GFP+ structures (On) or in cytosol (Off). Values represent means ± S.E. of triplicate cells in five independent experiments (****, p < 0.00005). D, sequential transfection scheme for investigating the recruitment of mEmerald-CAPS to mNeptune-Rbcn3β membrane structures. E, upper panels, epifluorescence images of mEmerald-CAPS–expressing COS cell (middle panels) after 4 h of mNeptune-Rbcn3β expression (upper panels) and 40 min later (lower panels). Lower panels, similar study to that shown in upper panels but with mNeptune expression. F, to quantify the ongoing recruitment of mEmerald-CAPS to mNeptune-Rbcn3β membranes, fluorescence was quantified within the indicated region of interest in E over 40 min for mNeptune-Rbcn3β– and mNeptune-expressing cells with 0-min background values subtracted. Values shown represent means ± S.E. of three independent studies (n = 3).
Figure 4.
Figure 4.
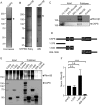
CAPS1 directly binds to Rbcn3β. A, Coomassie-stained SDS-PAGE showing CAPS1-TwinStrep purification from HEK cells. The arrow points to CAPS1-TwinStrep. B, SYPRO Ruby–stained SDS-PAGE showing Rbcn3β-GFP purification from HEK cells (left) and a Western blot (WB) of purified Rbcn3β-GFP (right) with Rbcn3β antibodies to show that several degradation bands were present. The arrow points to full-length Rbcn3β-GFP. C, Western blot showing binding of purified CAPS1-TwinStrep interacting with purified Rbcn3β-GFP. A representative of four similar studies is shown. D, scheme depicting CAPS1 domains and the HA-tagged CAPS1 fragments used for HA immunoprecipitations. C2, PH, DUF1041, and MHD domains are depicted. E, representative Western blot depicting pulldown of CAPS1-HA fragments and coimmunoprecipitation of Rbcn3β. 5% of the input fraction was loaded. In the concentrated input lanes for Rbcn3β, aggregation and degradation were reproducibly observed. F, relative Rbcn3β bound to CAPS1 fragments normalized to the amount of CAPS1 pulled down. Values shown represent means ± S.E. (n = 3). ****, p < 0.001; n.s., nonsignificant.
Figure 5.
Figure 5.
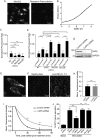
CAPS and Rbcn3β knockdown cause acidification defects. A, TIRF image at 405-nm excitation of PC12 cells loaded with compound FFN202 (left). FFN202 loading is decreased if cells are preincubated with 1 μm reserpine, a VMAT blocker (right). B, the 370:355 nm emission ratio of FFN202 increases with increasing buffer pH. Values shown represent means ± S.E. (n = 3) read from a plate reader. C, 370:355 nm fluorescence ratio of FFN202-loaded PC12 cells transfected with CAPS1, Rbcn3α, or Rbcn3β siRNA pools normalized to determinations with a nontargeting siRNA pool. Values are the mean ± S.E. (n = 3, 10 replicates each), and differences were nonsignificant (n.s.). D, 370:335 ratios of PC12 cells either loaded with FFN202 (untreated) or preincubated with 100 nm bafilomycin prior to FFN202 loading (recovered). Bafilomycin-treated cells were normalized to untreated cells in each condition. Values represent the mean ± S.E. (n = 3, 10 replicates each). *, p < 0.05; **, p < 0.005; ***, p < 0.0005. E, TIRF image of PC12 cells expressing NPY-GFP. F, lower magnification epifluorescence images of PC12 cells expressing NPY-GFP before (left) and after (right) addition of 50 mm NH4Cl. G, Western blot showing CAPS1 depletion in stable lentivirus shRNA CAPS1 knockdown PC12 cells with GAPDH loading control. H, ratio of NPY-GFP fluorescence before and after NH4Cl addition in multiple (>900) control and CAPS1 knockdown cells. Mean values ± S.E. are shown for five experiments. I, ratio of NPY-GFP fluorescence (±NH4Cl) in control or CAPS1 knockdown PC12 cells over 90 min as cells recovered from 1-h treatment with 100 nm bafilomycin. Fluorescence ratios were normalized to 1.0 at zero time. Values shown are means ± S.E. for determinations in >100 cells for each condition. *, p < 0.05; **, p < 0.005; ****, p < 0.00005. J, basal and ionomycin-stimulated NPY-Venus secretion in 10 min from BON cells was determined following transfection of the indicated siRNA pools. Mean values ± S.E. are shown. **, p < 0.01 (n = 3).

Similar articles

Cited by

References

    1. Nishi T., and Forgac M. (2002) The vacuolar (H+)-ATPases–nature's most versatile proton pumps. Nat. Rev. Mol. Cell Biol. 3, 94–103 10.1038/nrm729 - DOI - PubMed
    1. Paroutis P., Touret N., and Grinstein S. (2004) The pH of the secretory pathway: measurement, determinants, and regulation. Physiology 19, 207–215 10.1152/physiol.00005.2004 - DOI - PubMed
    1. Taupenot L., Harper K. L., and O'Connor D. T. (2005) Role of H+-ATPase-mediated acidification in sorting and release of the regulated secretory protein chromogranin A: evidence for a vesiculogenic function. J. Biol. Chem. 280, 3885–3897 10.1074/jbc.M408197200 - DOI - PubMed
    1. Sobota J. A., Bäck N., Eipper B. A., and Mains R. E. (2009) Inhibitors of the V0 subunit of the vacuolar H+-ATPase prevent segregation of lysosomal- and secretory-pathway proteins. J. Cell Sci. 122, 3542–3553 10.1242/jcs.034298 - DOI - PMC - PubMed
    1. Hummer B. H., de Leeuw N. F., Burns C., Chen L., Joens M. S., Hosford B., Fitzpatrick J. A. J., and Asensio C. S. (2017) HID-1 controls formation of large dense core vesicles by influencing cargo sorting and trans-Golgi network acidification. Mol. Biol. Cell 28, 3870–3880 10.1091/mbc.e17-08-0491 - DOI - PMC - PubMed

Publication types

MeSH terms

Substances