. 2019 Apr 18;15(4):e1007715.
doi: 10.1371/journal.ppat.1007715. eCollection 2019 Apr.

Distinct phenotype and function of circulating Vδ1+ and Vδ2+ γδT-cells in acute and chronic hepatitis B

Affiliations

Distinct phenotype and function of circulating Vδ1+ and Vδ2+ γδT-cells in acute and chronic hepatitis B

Kyong-Mi Chang et al. PLoS Pathog. .

Abstract

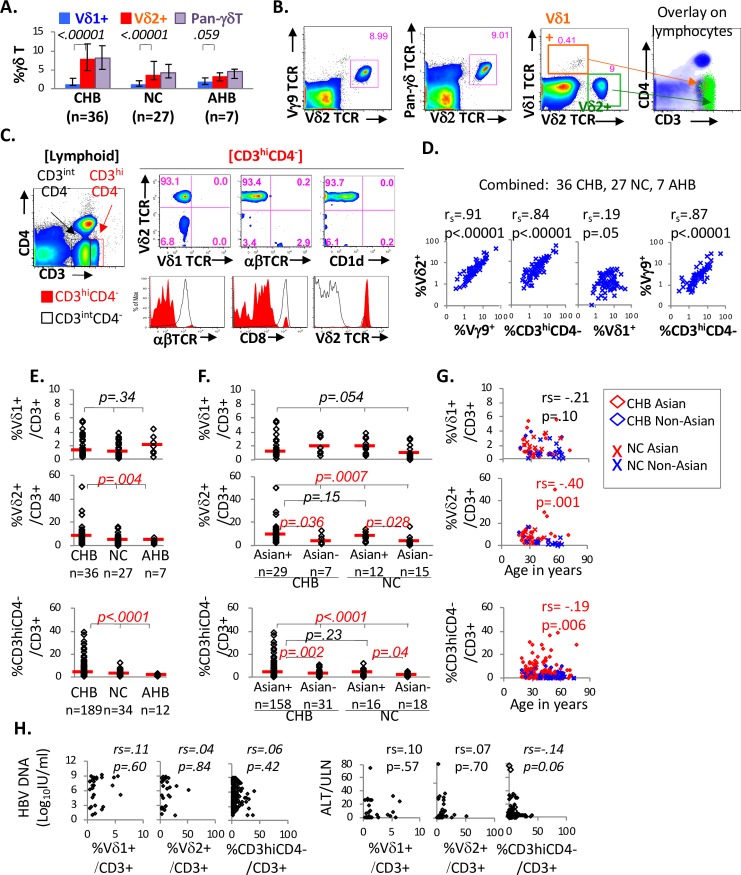
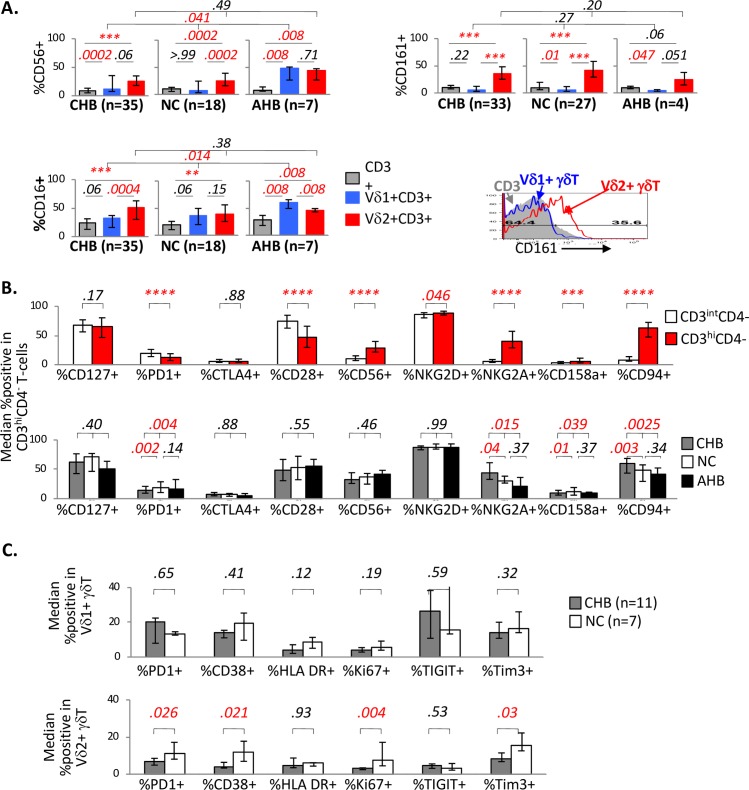
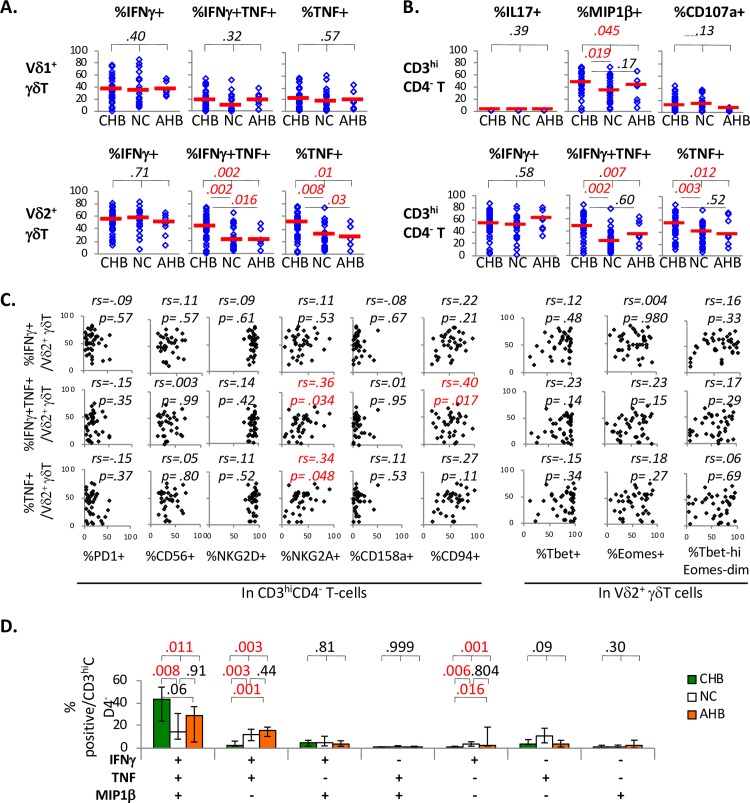
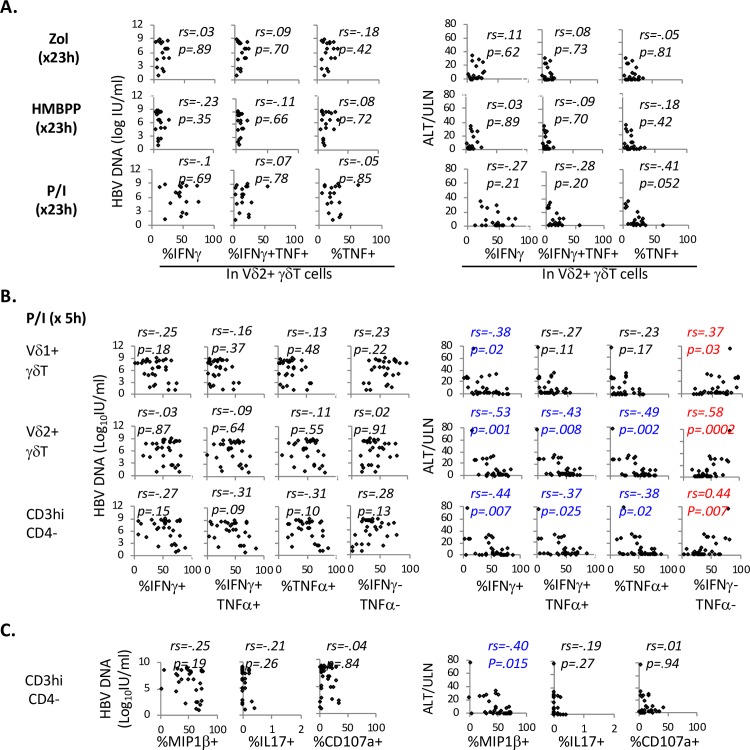
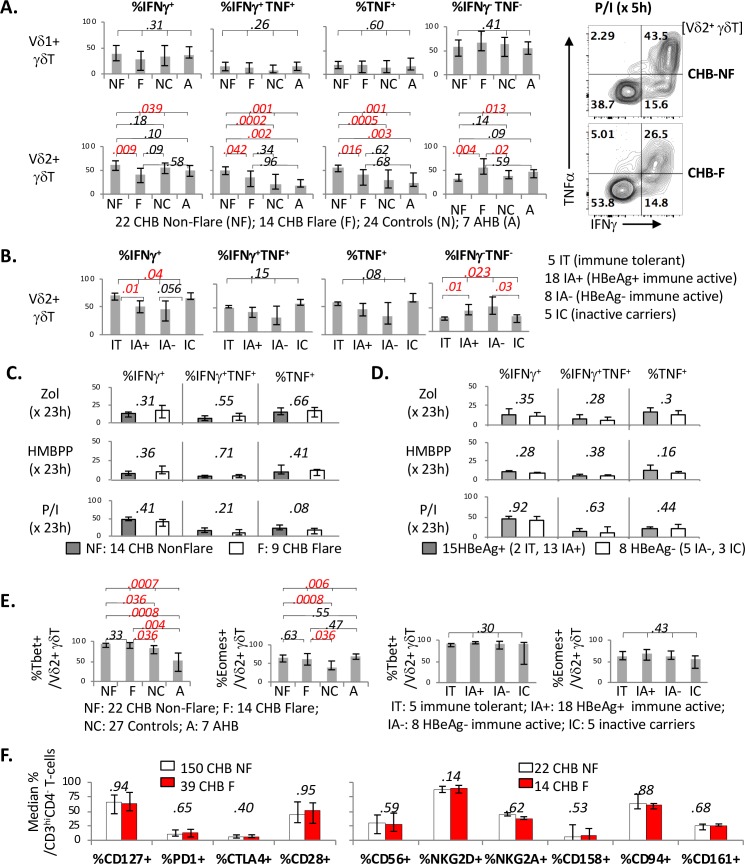
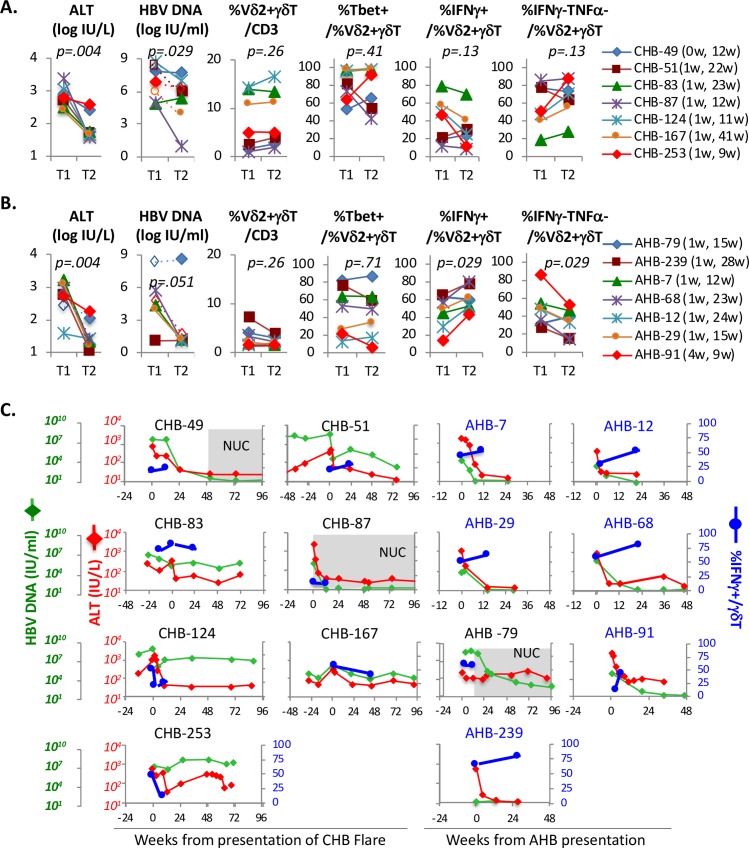
Hepatitis B virus (HBV) persists with global and virus-specific T-cell dysfunction, without T-cell based correlates of outcomes. To determine if γδT-cells are altered in HBV infection relative to clinical status, we examined the frequency, phenotype and function of peripheral blood Vδ1+ and Vδ2+γδT-cells by multi-parameter cytometry in a clinically diverse North American cohort of chronic hepatitis B (CHB), acute hepatitis B (AHB) and uninfected control subjects. We show that circulating γδT-cells were comprised predominantly of CD3hiCD4- Vδ2+γδT-cells with frequencies that were 2-3 fold higher among Asian than non-Asian Americans and inversely correlated with age, but without differences between CHB, AHB and control subjects. However, compared to control subjects, CHB was associated with increased TbethiEomesdim phenotype in Vδ2+γδT-cells whereas AHB was associated with increased TbethiEomesdim phenotype in Vδ1+γδT-cells, with significant correlations between Tbet/Eomes expression in γδT-cells with their expression of NK and T-cell activation and regulatory markers. As for effector functions, IFNγ/TNF responses to phosphoantigens or PMA/Ionomycin in Vδ2+γδT-cells were weaker in AHB but preserved in CHB, without significant differences for Vδ1+γδT-cells. Furthermore, early IFNγ/TNF responses in Vδ2+ γδT-cells to brief PMA/Ionomycin stimulation correlated inversely with serum ALT but not HBV DNA. Accordingly, IFNγ/TNF responses in Vδ2+γδT-cells were weaker in patients with CHB with hepatitis flare compared to those without hepatitis flares, and this functional deficit persisted beyond clinical resolution of CHB flare. We conclude that circulating γδT-cells show distinct activation and differentiatiation in acute and chronic HBV infection as part of lymphoid stress surveillance with potential role in clinical outcomes.


Conflict of interest statement

Anna S. F. Lok has received research grants (to the University of Michigan) from Bristol-Myers Squibb and Gilead, and has served on advisory board of Gilead.

Figures

Fig 1
Fig 1. Circulating γδT-cells are comprised predominantly of CD3hiCD4- Vδ2+ γδT-cells with frequencies that are impacted by host race/ethnicity and age but not HBV infection.
A. Comparison of circulating γδT-cell frequencies relative to HBV infection. Bar graphs show median %γδT-cells in CD3+ T-cells from 36 chronic hepatitis B (CHB), 27 uninfected normal controls (NC) and 7 acute hepatitis B (AHB) subjects determined by flow cytometry: %Vδ1+ (blue bar), %Vδ2+ (red bar) and %pan-γδTCR+ (violet bar). Error bars indicate 25% and 75% interquartile ranges. Differences between %Vδ1+ and %Vδ2+ γδT-cells were examined by non-parametric Mann-Whitney U. P-values below 0.05 were considered statistically significant. B. Representative FACS appearance of γδT-cells. Multi-color FACS analysis of peripheral blood mononuclear cells (gated on CD3+ viable singlet lymphocytes) show that Vδ2+ cells co-express Vγ9 TCR and pan-γδTCR but not Vδ1 TCR. Overlay of Vδ1+ (orange box gate) and Vδ2+ cells (green box gate) onto lymphocytes (blue background) shows the CD3hiCD4- phenotype of Vδ2+ cells (green dots on the overlay) whereas Vδ1+ cells (orange dots on the overlay) show CD3intCD4- appearance. C. Enrichment of CD3hiCD4- T-cells for Vδ2+ γδT-cells. Gating strategy and distinct FACS appearance are shown for highly CD3-positive but CD4-negative cells (CD3hiCD4-) compared to CD3-intermediate CD4- cells (CD3intCD4-). Upper panel shows pseudo-color plots of gated CD3hiCD4- T-cells which are markedly enriched for Vδ2+ γδT-cells but not Vδ1+ γδT-cells, αβTCR+ conventional T-cells or CD1d-reactive NKT-cells. Bottom panel shows histogram overlays for CD3hiCD4- (red shade) and CD3intCD4- (black line) T-cells with enrichment of CD3intCD4- T-cells with αβTCR+ CD8+ T-cells and not Vδ2+ γδT-cells. D. Correlations between circulating γδT-cell frequencies. Significant correlations were detected between %Vδ2+ γδT-cells, %Vγ9+ γδT-cells, and %CD3hiCD4- T-cells, but not between %Vδ1+ γδT-cells and %Vδ2+ γδT-cells. E. Comparison of γδT-cell frequencies in CD3+ T-cell compartment between CHB, NC and AHB groups. Vδ1+ and Vδ2+ γδT-cell frequencies were compared between 36 CHB (29 Asians, 7 Non-Asians), 27 NC (12 Asians, 15 Non-Asians) and 7 AHB (7 Non-Asians) subjects with available cryopreserved PBMCs. CD3hiCD4- γδT-cell frequencies were compared in 189 CHB (158 Asians, 31 Non-Asians), 34 NC (16 Asians, 18 Non-Asians) and 12 AHB (12 Non-Asians) subjects in freshly isolated PBMCs. Frequency differences between CHB, NC and AHB groups were calculated by non-parametric Kruskal Wallis (k = 3). P-values below 0.05 were considered significant and shown in red font. F. Comparison of Vδ1+, Vδ2+ and CD3hiCD4- γδT-cell frequencies between Asian and Non-Asian American subgroups with and without CHB. Initial comparisons between 4 subgroups (Asian+ CHB, Asian- CHB, Asian+ NC, Asian- NC) were made by non-parametric Kruskal Wallis (k = 4), followed by further 2-group comparisons by Mann Whitney U if initial 4-way comparison showed p-values below 0.05. As shown, Vδ2+ and CD3hiCD4- γδT-cell frequencies were greater in Asian Americans compared to Non-Asian Americans within CHB or NC groups, without significant differences between Asian American CHB versus Asian American NC subgroups. Horizontal red lines indicate median values. P-values below 0.05 were considered significant and shown in red font. G. Inverse association between age and circulating Vδ2+ and CD3hiCD4- γδT-cell frequencies. Comparisons between age in years (x-axis) and %γδT-cells (y-axis) are shown for NC Asian Americans, (red X), NC Non-Asian Americans (blue X), CHB Asian Americans (red diamond) and CHB Non-Asian Americans (blue diamond), with significant inverse associations between age and %Vδ2+ or %CD3hiCD4- γδT-cells but not Vδ1+ γδT-cells. Correlation coefficients and associated p-values for all subjects were determined by non-parametric Spearman rank order correlation test. H. Lack of significant correlations between serum levels of HBV DNA or ALT and circulating γδT-cell frequencies. Serum levels of HBV DNA or ALT on the y-axis are compared to circulating frequencies of Vδ1+, Vδ2+ and CD3hiCD4- γδT-cells, with correlation coefficients and p-values by Spearman rank order correlation test.
Fig 2
Fig 2. Circulating γδT-cells display an innate phenotype with the expression of both T and NK regulatory markers that are distinctly altered in AHB and CHB.
A. Innate phenotype of Vδ1+ avδ/or Vδ2+ γδT-cells compared to total CD3+ T-cells. Bar graphs show median %CD56+, %CD16+ and %CD161+ in total CD3+ T-cells (gray bars) relative to Vδ1+ γδT-cells (blue bars) or Vδ2+ γδT-cells (red bars) in CHB, NC and AHB groups, with error bars indicating 25% and 75% interquartile ranges. CD56 and CD16 expression levels were examined in 35 CHB, 18 NC and 7 AHB subjects, whereas CD161 expression was examined in 33 CHB, 27 NC and 4 AHB subjects. Expression levels between the cell subsets within individual subject were compared by matched pair signed-rank test. Comparisons between CHB, NC and AHB groups were made with Kruskal Wallis (k = 3). Histogram on the right bottom show overlay of CD3 (gray shade), Vδ1+ γδT-cells (blue line) or Vδ2+ γδT-cells (red line). B. Increased expression of NK but not T-cell markers in CD3hiCD4- T- compared to CD3intCD4- T-cells. (Top panel) Bar graphs show median % of cells expressing T-cell markers (CD127, PD-1, CTLA-4 and CD28) and NK markers (CD56, NKG2D, NKG2A, CD158a, CD94) in CD3hiCD4- T-cells (red bars) and CD3intCD4- T-cells (white bars) in CHB subjects, with p-values calculated by matched pair signed-rank test. (Bottom panel) Bar graphs compare median % of cells expressing T/NK markers in CD3hiCD4- T-cells from CHB (gray bar), NC (white bar) and AHB (black bar) subjects. T-cell markers were measured in 189 CHB, 24 NC and 12 AHB subjects. NK markers were measured in 36 CHB, 17 NC and 7 AHB subjects. Error bars indicate 25% and 75% interquartile ranges. CHB, NC and AHB groups were compared by non-parametric Kruskal Wallis test (k = 3) with further comparisons between 2 groups by Mann Whitney U if the initial Kruskal Wallis test yielded p-values < 0.05. C. Reduced expression of T-cell activation and exhaustion markers in Vδ2+ γδT cells from CHB compared to NC subjects: Bar graphs compare 11 CHB (gray bars) and 7 NC subjects (white bars) for %Vδ1+ γδT cells (top) and %Vδ2+ γδT cells (bottom) that express various T-cell activation or exhaustion markers by CyTOF. Significant p-values < 0.05 are highlighted in red font. ****p < .0001; ***p < 0.0001; **p < .001.
Fig 3
Fig 3. Tbet/Eomes expression is enriched in circulating Vδ1+ and Vδ2+ γδT-cells compared to total CD3+ T-cells with differential hierarchy and phenotypes in CHB and AHB subjects.
A. (Left panel) Representative FACS plots showing Tbet, Eomes and RORγt expression in Vδ1+ γδT-cells and Vδ2+ γδT-cells in CD3-gated cells. (Right panel) Comparisons of Tbet, Eomes and RORγt expression between total CD3+ T-cells (white bars), Vδ1+ γδT-cells (blue bars) and Vδ2+ γδT-cells (red bars). Tbet and Eomes expression in T-cell subsets was examined in 36 CHB, 27 NC and 7 AHB subjects, with further examination of RORγt in 19 CHB, 15 NC and 4 AHB subjects based on PBMC availability. Bar graphs show median values within each group, with error bars indicating 25% and 75% interquartile ranges and p-values calculated by matched pair signed-rank test comparing T-cell subsets within each subject. In CHB group, the highest Tbet and Eomes expression was detected in Vδ2+ γδT-cells followed by Vδ1+ γδT-cells and total CD3+ T-cells. In NC group, similar hierarchy was detected for Tbet expression whereas Eomes expression was elevated in both Vδ1+ and Vδ2+ γδT-cells compared to total CD3+ T-cells. In AHB, Tbet was most elevated in Vδ1+ γδT-cells whereas Eomes was similarly elevated in both Vδ1+ and Vδ2+ γδT-cells compared to total CD3+ T-cells. RORγt was detected in very few cells in all groups, although statistical comparison was not possible for AHB subjects due to insufficient sample size (n = 4). ****p < 0.00001; ***p < .0001; **p < 0.001; *p < .01; #p = 0.008; n.s. sample size not sufficient for statistics for statistical comparison. B. Comparison of Tbethi Eomesdim and Tbetdim Eomeshi phenotype between total CD3+ T-cells (white bars), Vδ1+ γδT-cells (blue bars) and Vδ2+ γδT-cells (red bars), with representative FACS density plot and gating strategy shown at the bottom for CD3+ T-cells (left) and Vδ2+ γδT-cells (right). ****p < 0.00001; ***p < .0001; **p < 0.001; *p < .01; #p = 0.008. C. Comparison of Tbet/Eomes expression in circulating Vδ1+ and Vδ2+ γδT-cells from 36 CHB, 24 NC and 7 AHB subjects. P-values between 3 groups were determined by Kruskal Wallis test (k = 3), followed by further two-way comparisons by Mann Whitney U for initial p-values below 0.05. D. Correlations between Tbet/Eomes expression in Vδ2+ γδT-cells and their expression of NK and T-cell markers. Percentages of Tbet+ or TbethiEomesdim Vδ2+ γδT-cells correlated positively with the expression of several NK markers (CD56, CD16, NNKG2A and CD94) and negatively with the expression of several T-cell markers (PD1, CD28, CD127) as well as KIR CD158a. Correlation coefficient and p-values were determined by non-parametric Spearman rank order correlation test. For convenience, red font was used to indicate significantly positive correlations with p-values <0.05 whereas blue font was used to indicate significantly negative correlations with p-values <0.05. E. Lack of correlations between Tbet/Eomes expression in γδT-cells and serum HBV DNA or ALT activity. Percentages of Tbet+, Eomes+, TbethiEomesdim and TbetdimEomeshi Vδ1+ γδT-cells (left panel) or Vδ2+ γδT-cells (right panel) showed no significant correlations with serum HBV DNA or ALT activity. ULN (upper limit of normal) for ALT: 20 IU/L for females, 30 IU/L for males. Correlation coefficient and p-values were determined by non-parametric Spearman rank order correlation test.
Fig 4
Fig 4. Circulating CD3hiCD4- Vδ2+ γδT-cells show greater effector capacity compared to Vδ1+ γδT-cells and/or total CD3+ T-cells.
A. Hierarchy in IFNγ/TNF expression between total CD3+ T-cells, Vδ1+ γδT-cells and Vδ2+ γδT-cells from CHB, NC and AHB groups. Upper panel shows representative FACS density plot appearance of CD3+ T-cells, Vδ1+ γδT-cells and Vδ2+ γδT-cells, with anti-Vγ9 TCR used to detect Vδ2+ (Vγ9+) γδT-cells. The 3 bar graphs below show median %IFNγ+, %IFNγ+TNF+ and %TNF+ cells in total CD3+ T-cells (white bars), Vδ1+ γδT-cells (blue bars) and Vδ2+ γδT-cells (red bars), with error bars indicating 25% and 75% interquartile ranges. P-values were calculated by non-parametric Mann Whitney U and shown above brackets to indicate the T-cell subsets being compared. Asterisks indicate significant p-values as follows: ****p < .00001; ***p < .0001; **p < .001; *p < .01. B. CD3hiCD4- T-cells show greater Th1 effector function compared to total CD3 T-cells. Upper panel shows representative stainings for IFNγ, TNF, IL17+, MIP1β, and CD107a in FACS overlay of CD3hiCD4- T-cells (red dots) onto CD3+ T-cells (blue shaded density) with and without 5 hours of PMA/Ionomycin (P/I) stimulation. Bar graphs on the lower panel show median %IFNγ+, %TNF+, %IL17+, %MIP1β+, %CD107a+ cells upon PMA/Ionomycin stimulation in gated CD3hiCD4- T-cells (red bars) and total CD3 T-cells (white bars), with error bars indicating 25% and 75% interquartile ranges and p-values by Mann Whitney U test. C. Vδ2+ γδT-cells from CHB subjects are enriched in effector molecules perforin and/or granzyme B compared to Vδ1+ γδT-cells or total CD3+ T-cells. Bar graphs show median %Perforin+ and %Granzyme B+ in CD3+ T-cells, Vδ1+ γδT-cells and Vδ2+ γδT-cells examined ex vivo by CyTOF mass cytometry, with p-values by matched pair signed-rank test and error bars indicating 25% and 75% interquartile ranges.
Fig 5
Fig 5. IFNγ/TNF responses to brief PMA/Ionomycin stimulation are greater and more multi-functional in CD3hiCD4- Vδ2+ γδT-cells from CHB compared to NC or AHB subjects.
A/B. Comparison between CHB, NC and AHB groups of effector functions in circulating γδT-cell subsets. CHB (n = 36), NC (n = 24) and AHB (n = 7) groups are compared for %IFNγ+, %IFNγ+/TNF+ and %TNF+ cells in Vδ1+ γδT-cells, Vδ2+ γδT-cells and CD3hiCD4- T-cells following 5 hours of PMA/Ionomycin stimulation. P-values between 3 groups were determined by Kruskal Wallis test (k = 3), followed by further two-way comparisons by Mann Whitney U for initial p-value below 0.05. P-values below 0.05 were considered significant and highlighted in red font for convenience. C. Correlations between early IFNγ/TNF responses in Vδ2+ γδT-cells to PMA/Ionomycin stimulation and their expression of T/NK markers. Scatter plots show %IFNγ+, %IFNγ+/TNF+ and %TNF+ cells in Vδ2+ γδT-cells (following 5 hours of PMA/Ionomycin stimulation) on the y-axis, with x-axis showing percent expression of various T/NK markers as well as Tbet/Eomes. Correlation coefficient and p-values were determined by non-parametric Spearman rank order correlation test. For convenience, red font was used to indicate significantly positive correlations with p-values <0.05. D. Comparison between CHB, NC and AHB groups for multi-functionality of CD3hiCD4- T-cells following brief PMA/Ionomycin stimulation. CD3hiCD4- T-cells from CHB subjects (green bars) show greater co-expression of IFNγ, TNF and MIP1β following 5 hours of PMA/Ionomycin stimulation, compared to CD3hiCD4- T-cells from NC (white bars) and AHB (orange bars) subjects. Error bars indicate 25% and 75% interquartile ranges. P-values between 3 groups were determined by Kruskal Wallis test (k = 3), followed by further two-way comparisons by Mann Whitney U for initial p-value below 0.05. P-values below 0.05 were considered significant and highlighted in red font for convenience. Gating strategy is shown in S4 Fig.
Fig 6
Fig 6. IFNγ/TNF responses to pAg are preserved in Vδ2+ γδT cells from CHB (but not AHB) subjects and are associated with their expression of Tbet/Eomes and NK markers but not PD1.
A. IFNγ/TNF responses to phosphoantigens in γδT-cells from CHB subjects. Representative FACS plots show IFNγ expression in γδT-cells in CD3-gated cells. Anti-Vγ9 TCR was used to detect Vδ2+ (Vγ9+) γδT-cells. Bar graphs show %IFNγ+, %IFNγ+/TNF+ and %TNF+ cells in CD3+ T-cells (white bars), Vδ1+ γδT-cells (blue bars) and Vδ2+ γδT-cells (red bars) from 23 CHB subjects, with PBMC stimulated for 1 day (23 hours) in-vitro with phosphoantigens zoledronic acid (zol) or (E)-4-hydroxy-3-methyl-but-2-enyl pyrophosphate (HMBPP) in addition to PMA/Ionomycin. Red bars on the far right provide comparisons to early IFNγ/TNF responses in Vδ2+ γδT-cells stimulated for 5 hours in separate assays. Cytokine responses between CD3+ T-cells, Vδ1+ γδT-cells and Vδ2+ γδT-cells were compared by non-parametric Kruskal Wallis test (k = 3). Comparisons between 2 conditions were made with non-parametric Mann Whitney U. *** p < .0001; ****p < .00001. B. Comparisons between CHB, NC and AHB subjects for IFNγ/TNF responses in Vδ2+ γδT-cells to 1 day stimulation with phosphoantigens and PMA/Ionomycin stimulation. Bar graphs show %IFNγ+, %IFNγ+/TNF+ and %TNF+ cells in Vδ2+ γδT-cells following 1 day stimulation in-vitro with phosphoantigens zoledronic acid (zol) or (E)-4-hydroxy-3-methyl-but-2-enyl pyrophosphate (HMBPP) in addition to PMA/Ionomycin. Based on available cryopreserved PBMC, 23 CHB, 11 NC and 7 AHB subjects were included in this analysis. Error bars indicate 25% and 75% interquartile ranges. P-values between 3 groups were determined by Kruskal Wallis test (k = 3), followed by further two-way comparisons by Mann Whitney U for initial p-value below 0.05. P-values below 0.05 were considered significant and highlighted in red font for convenience. C. Correlations between IFNγ/TNF responses in Vδ2+ γδT-cells to zoledronic acid and their expression of T/NK markers. Scatter plots show %IFNγ+, %IFNγ+/TNF+ and %TNF+ cells in Vδ2+ γδT-cells (following 23 hours of stimulation) on the y-axis, with x-axis showing percent expression of various T/NK markers and Tbet/Eomes, combining results from 23 CHB, 11 NC and 7 AHB subjects. Correlation coefficient and p-values were determined by non-parametric Spearman rank order correlation test. For convenience, red font was used to indicate significantly positive correlations with p-values <0.05 whereas blue font was used to indicate significantly negative correlations with p-values <0.05.
Fig 7
Fig 7. Serum ALT but not HBV DNA levels in CHB correlates inversely with IFNγ/TNF responses in Vδ1+ and Vδ2+ γδT-cells to brief PMA/Ionomycin stimulation, but not to pAg stimulation.
A. Serum HBV DNA and ALT levels in CHB do not correlate with IFNγ/TNF responses in Vδ2+ γδT-cells to 1 day stimulation with pAgs. Scatter plots show %IFNγ+, %IFNγ+/TNF+ and %TNF+ cells in Vδ2+ γδT-cells on the x-axis, with y-axis showing concurrent levels of HBV DNA (log IU/ml) and ALT/ULN from the day of immune sample collection. Among 23 CHB subjects with available PBMC for pAg analysis, 23 had concurrent ALT values and 18 had concurrent HBV DNA levels for this analysis. Correlation coefficient and p-values were determined by non-parametric Spearman rank order correlation test. B. Serum ALT (but not HBV DNA) levels in CHB correlate with early IFNγ/TNF responses in Vδ1+ γδT-cells, Vδ2+ γδT-cells and CD3hiCD4- T-cells to PMA/Ionomycin stimulation. Scatter plots show %IFNγ+, %IFNγ+/TNF+, %TNF+ and %IFNγ-/TNF- cells in Vδ2+ γδT-cells on the x-axis, with y-axis showing concurrent levels of HBV DNA (log IU/ml) and ALT/ULN from the day of immune sample collection. Among 36 CHB subjects with available PBMC for early cytokine responses to PMA/Ionomycin, 36 had concurrent ALT values and 30 had concurrent HBV DNA levels. Correlation coefficient and p-values were determined by non-parametric Spearman rank order correlation test. For convenience, red font was used to indicate significant positive correlations with p-values <0.05 whereas blue font was used to indicate significant inverse correlations with p-values <0.05. C. Serum ALT (but not HBV DNA) levels in CHB correlate with early MIP1β response in CD3hiCD4- T-cells to PMA/Ionomycin stimulation. Scatter plots show %MIP1β+, %IL17+, %CD107a+ CD3hiCD4- T-cells on the x-axis, with y-axis showing concurrent levels of HBV DNA (log IU/ml) and ALT/ULN from the day of immune sample collection. Among 36 CHB subjects with available PBMC for early cytokine responses to PMA/Ionomycin, 36 had concurrent ALT values and 30 had concurrent HBV DNA levels. Correlation coefficient and p-values were determined by non-parametric Spearman rank order correlation test. For convenience, red font was used to indicate significantly positive correlations with p-values <0.05 whereas blue font was used to indicate significantly negative correlations with p-values <0.05.
Fig 8
Fig 8. CHB with ALT flare is associated with weaker early IFNγ/TNF responses to brief PMA/Ionomycin stimulation in Vδ2+ γδT-cells, compared to CHB without ALT flare.
A. Early IFNγ/TNF responses to brief PMA/Ionomycin stimulation is greater in Vδ2+ γδT-cells (but not Vδ1+ γδT-cells) from CHB Non-Flare (NF) subjects compared to CHB Flare (F), NC or AHB subjects. Bar graphs compare 22 CHB Non-Flare (NF), 14 CHB Flare (F), 24 uninfected control (NC) and 7 AHB (A) subjects for median percentage of cells with and without IFNγ/TNF expression in Vδ1+ γδT-cells (top panel) and Vδ2+ γδT-cells (bottom panel) upon 5 hours of PMA/Ionomycin stimulation in vitro. Right panel shows characteristic FACS contour plots for IFNγ and TNF expression in Vδ2+ γδT-cells upon PMA/Ionomycin stimulation from CHB-Non-Flare and CHB-Flare subjects. Error bars indicate 25% and 75% interquartile ranges. P-values between 4 subgroups were determined by Kruskal Wallis test (k = 4), followed by further two-way comparisons by Mann Whitney U for initial p-value below 0.05. P-values below 0.05 were considered significant and highlighted in red font for convenience. B. Early IFNγ/TNF response to brief PMA/Ionomycin stimulation is greater in Vδ2+ γδT-cells from clinical CHB phenotype groups with lower ALT values. Bar graphs compare 5 immune tolerant (IT), 18 HBeAg+ immune active (IA+), 8 HBeAg- immune active (IA-) and 5 inactive carrier (IC) subjects with CHB, showing median percentage of cells with and without IFNγ/TNF expression in Vδ2+ γδT-cells following 5 hours of PMA/Ionomycin stimulation in vitro. Error bars indicate 25% and 75% interquartile ranges. P-values between 4 subgroups were determined by Kruskal Wallis test (k = 4), followed by further two-way comparisons by Mann Whitney U for initial p-value below 0.05. P-values below 0.05 were considered significant and highlighted in red font for convenience. C/D. IFNγ/TNF response to 1 day of pAg stimulation does not differ between CHB Non-Flare (NF) subjects compared to CHB Flare (F) or between HBeAg+ or HBeAg- CHB subjects. Bar graphs compare 14 CHB Non-Flare (NF) and 9 CHB Flare (F) subjects, as well as 15 HBeAg+ CHB and 8 HBeAg- CHB subjects, with median percentage of cells with and without IFNγ/TNF expression in Vδ2+ γδT-cells following 1 day (23 hours) stimulation with phosphoantigens zoledronic acid (zol) or (E)-4-hydroxy-3-methyl-but-2-enyl pyrophosphate (HMBPP) in addition to PMA/Ionomycin (P/I). P-values between 2 subgroups were determined by Mann Whitney U with p-values below 0.05 considered significant. E. Lack of differential Tbet and Eomes expression between Vδ2+ γδT-cells from CHB Non-Flare and CHB Flare subjects. Bar graphs compare median %Tbet+ and %Eomes+ cells in Vδ2+ γδT-cells between patient groups, without significant differences between CHB Non-Flare and CHB Flare subjects. F. Lack of differential T/NK marker expression in CD3hiCD4- Vδ2+ γδT-cells from CHB Non-Flare and CHB Flare subjects. Bar graphs compare median % of cells expressing T/NK markers in CD3hiCD4- or Vδ2+ γδT-cells from CHB Non-Flare (CHB NF, white bar) and CHB Flare (CHB F, red bar) subjects. Expression of T-cell markers (CD127, PD1, CTLA4 and CD28) in CD3hiCD4- T-cells were measured in 150 CHB NF and 39 CHB F subjects. Expression of NK markers (CD56, NKG2D, NKG2A, CD158a and CD94) in CD3hiCD4- T-cells were measured in 22 CHB NF and 14 CHB F subjects. CD161 expression was measured in Vδ2+ γδT-cells from 22 CHB NF and 9 CHB F subjects. Error bars indicate 25% and 75% interquartile ranges. CHB, NC and AHB groups were compared by non-parametric Kruskal Wallis test (k = 3) with further comparisons between 2 groups by Mann Whitney U if the initial Kruskal Wallis test yielded p-values < 0.05.
Fig 9
Fig 9. Early IFNγ/TNF responses in Vδ2+ γδT-cells to brief PMA/Ionomycin stimulation improve with the resolution of AHB but not CHB Flare.
A/B. Clinical, virological and immunological measures during and after CHB Flare or AHB. Graphs compare serum ALT (log IU/L), HBV DNA (log IU/L), %Vδ2+ γδT-cells/CD3+ T-cells, %Tbet/Vδ2+ γδT-cells, %IFNγ+/Vδ2+ γδT-cells, %IFNγ-TNF-/Vδ2+ γδT-cells for 7 CHB-Flare subjects (A) and 7 AHB subjects (B) at the earliest time point (T1) within 1 weeks from initial clinical presentation for CHB flare or AHB and a later time point T2 with resolution of ALT flare or AHB. Subject ID and the timing of T1 and T2 blood draws for immune analyses (relative to clinical presentation) are shown on far right. Dotted lines with unfilled markers indicate that ALT or HBV DNA values were missing from those time points and substituted from the closest available time points. Cryopreserved PBMC from T1 and T2 time points for each subject were assayed concurrently for better comparability. As shown, ALT and HBV DNA levels declined by T2 in most subjects. No significant changes were detected for %Vδ2+ γδT-cells/CD3+ T-cells or %Tbet/Vδ2+ γδT-cells. AHB (but not CHB) subjects showed increased %IFNγ+/Vδ2+ γδT-cells and decreased %IFNγ-TNF-/Vδ2+ γδT-cells between T1 and T2. C. Evolution of serum ALT and HBV DNA levels relative to IFNγ expression in Vδ2+ γδT-cells in CHB Flare and AHB subjects. Serum HBV DNA (green diamond) and ALT (red diamond) levels are shown over time (in weeks from presentation of CHB flare or AHB), and juxtaposed to %IFNγ+/Vδ2+ γδT-cells (blue filled circle) for 7 CHB Flare and 7 AHB subjects. Notably, %IFNγ+/Vδ2+ γδT-cells increased between T1 and T2 in AHB but not CHB subjects.

Similar articles

Cited by

References

    1. Liang TJ, Block TM, McMahon BJ, Ghany MG, Urban S, Guo JT, et al. Present and future therapies of hepatitis B: From discovery to cure. Hepatology. 2015;62(6):1893–908. 10.1002/hep.28025 - DOI - PMC - PubMed
    1. Hoofnagle JH, Doo E, Liang TJ, Fleischer R, Lok AS. Management of hepatitis B: summary of a clinical research workshop. Hepatology. 2007;45(4):1056–75. 10.1002/hep.21627 . - DOI - PubMed
    1. Liang TJ. Hepatitis B: the virus and disease. Hepatology. 2009;49(5 Suppl):S13–21. 10.1002/hep.22881 - DOI - PMC - PubMed
    1. Guidotti LG, Chisari FV. Immunobiology and pathogenesis of viral hepatitis. Annu Rev Pathol. 2006;1:23–61. 10.1146/annurev.pathol.1.110304.100230 . - DOI - PubMed
    1. Ferrari C, Missale G, Boni C, Urbani S. Immunopathogenesis of hepatitis B. Journal of hepatology. 2003;39 Suppl 1:S36–42. Epub 2004/01/08. . - PubMed

Publication types

Substances