

Function of Golgi-centrosome proximity in RPE-1 cells
- PMID: 30986258
- PMCID: PMC6464164
- DOI: 10.1371/journal.pone.0215215
Function of Golgi-centrosome proximity in RPE-1 cells
Abstract
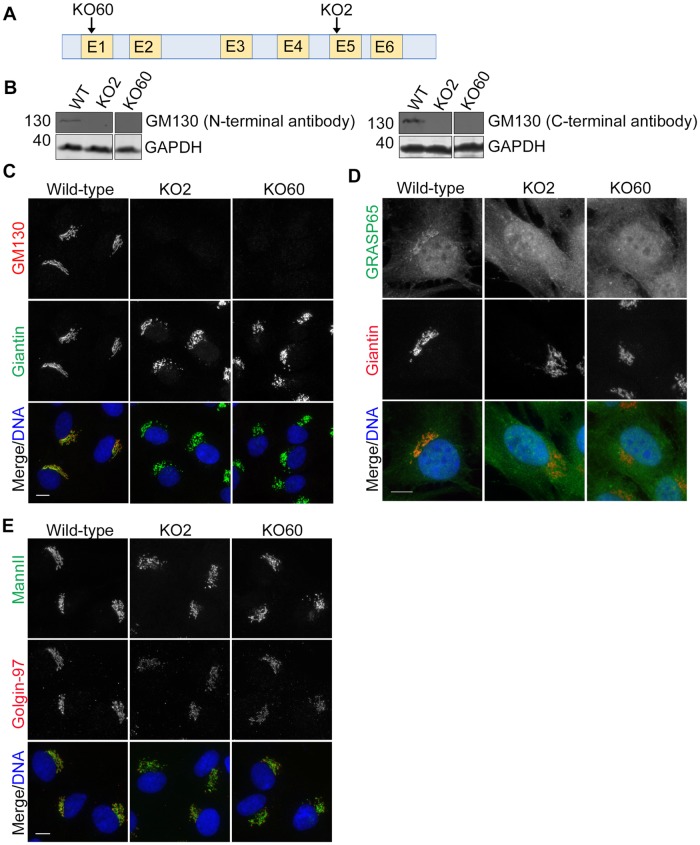
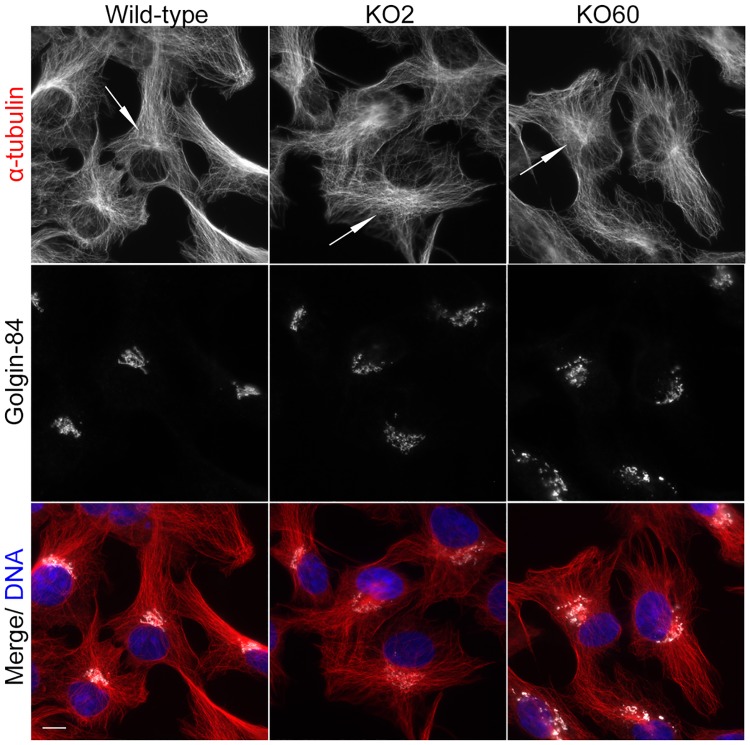
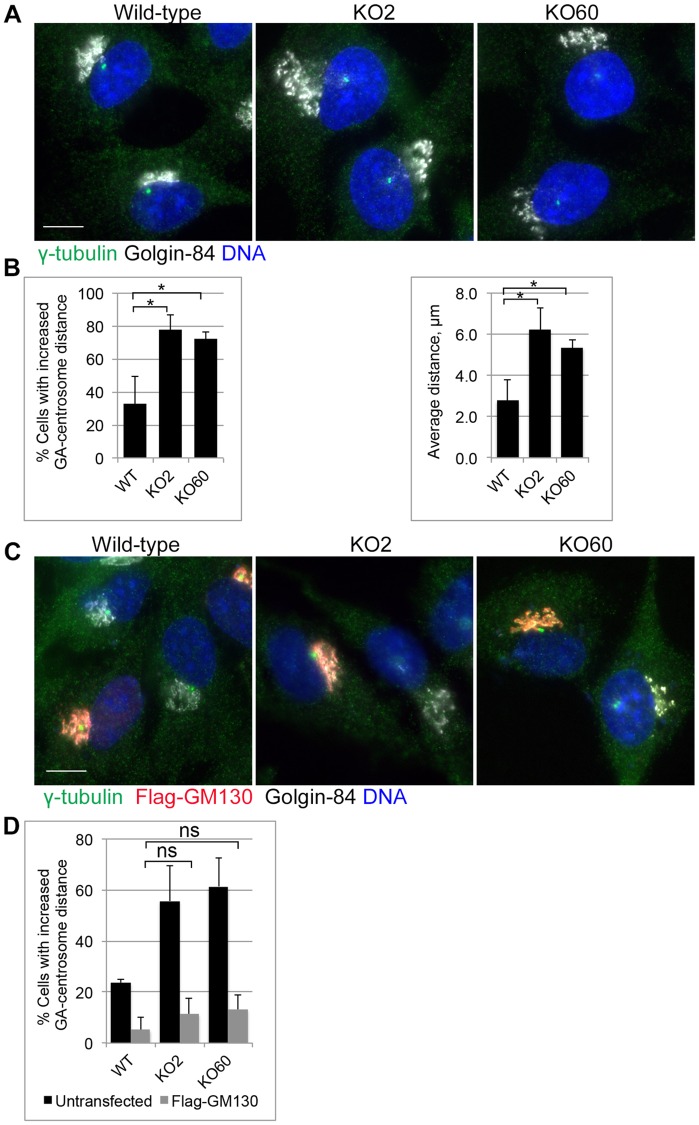
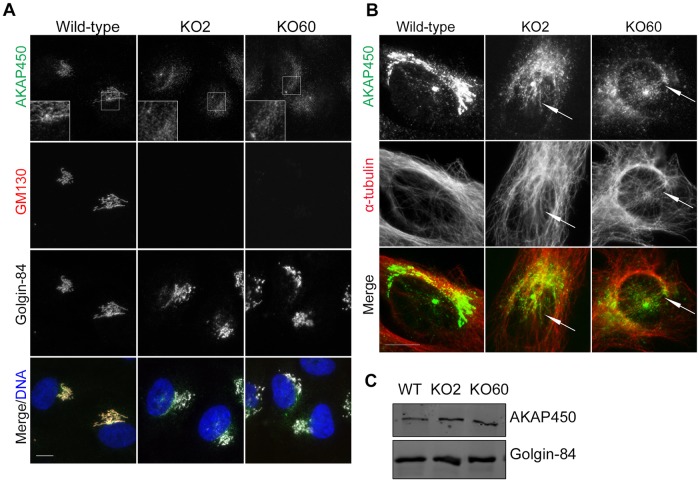
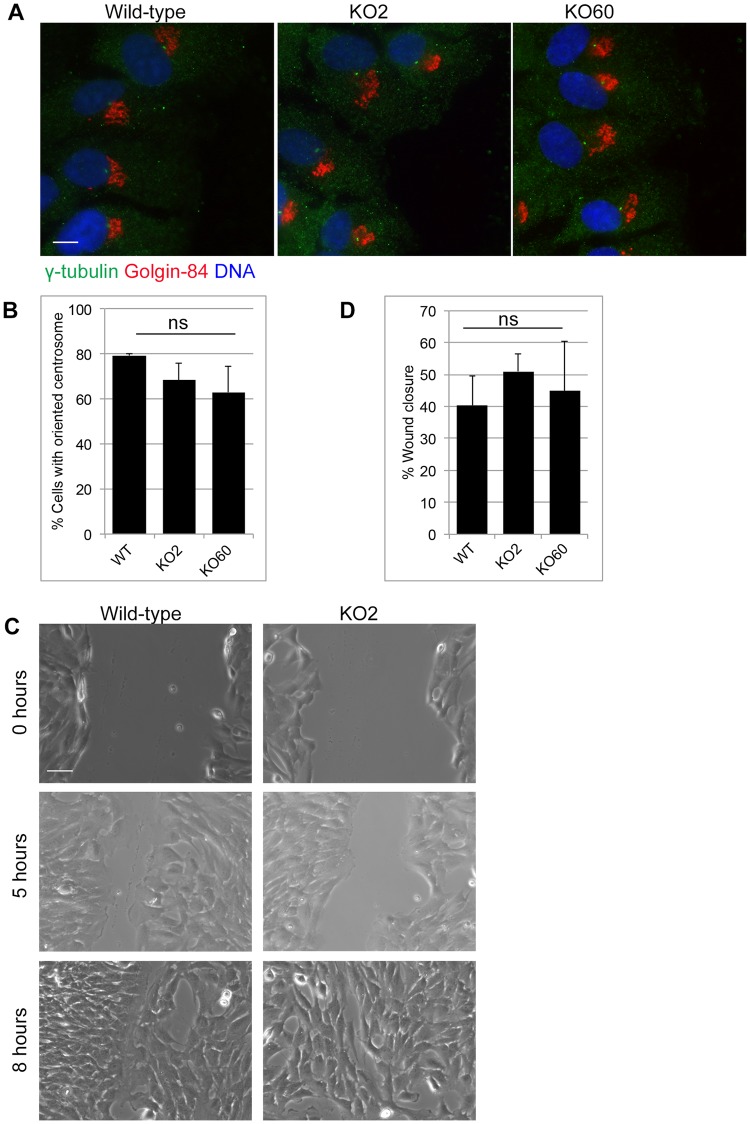
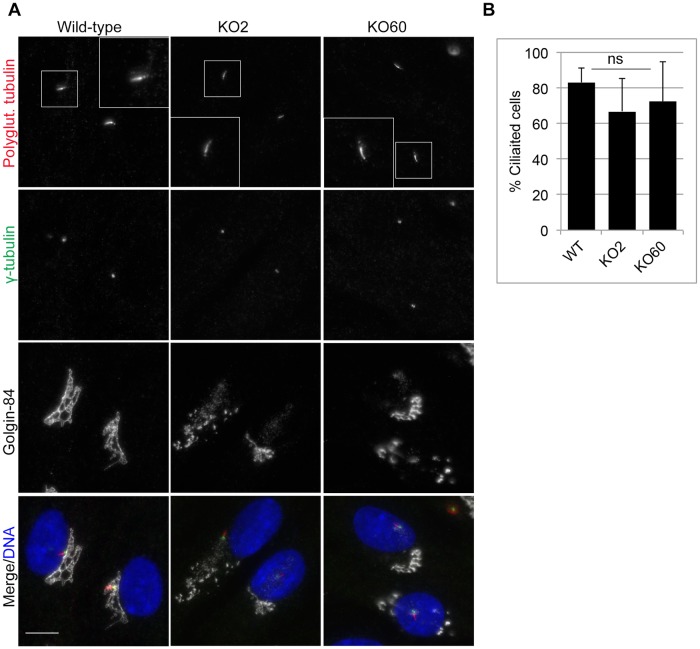
The close physical proximity between the Golgi and the centrosome is a unique feature of mammalian cells that has baffled scientists for years. Several knockdown and overexpression studies have linked the spatial relationship between these two organelles to the control of directional protein transport, directional migration, ciliogenesis and mitotic entry. However, most of these conditions have not only separated these two organelles, but also caused extensive fragmentation of the Golgi, making it difficult to dissect the specific contribution of Golgi-centrosome proximity. In this study, we present our results with stable retinal pigment epithelial (RPE-1) cell lines in which GM130 was knocked out using a CRISPR/Cas9 approach. While Golgi and centrosome organization appeared mostly intact in cells lacking GM130, there was a clear separation of these organelles from each other. We show that GM130 may control Golgi-centrosome proximity by anchoring AKAP450 to the Golgi. We also provide evidence that the physical proximity between these two organelles is dispensable for protein transport, cell migration, and ciliogenesis. These results suggest that Golgi-centrosome proximity per se is not necessary for the normal function of RPE-1 cells.
Conflict of interest statement
The authors have declared that no competing interests exist.
Figures

Similar articles
-
Microtubule nucleation at the cis-side of the Golgi apparatus requires AKAP450 and GM130.EMBO J. 2009 Apr 22;28(8):1016-28. doi: 10.1038/emboj.2009.47. Epub 2009 Feb 26. EMBO J. 2009. PMID: 19242490 Free PMC article.
-
Disconnecting the Golgi ribbon from the centrosome prevents directional cell migration and ciliogenesis.J Cell Biol. 2011 May 30;193(5):917-33. doi: 10.1083/jcb.201011014. Epub 2011 May 23. J Cell Biol. 2011. PMID: 21606206 Free PMC article.
-
A SEPT1-based scaffold is required for Golgi integrity and function.J Cell Sci. 2019 Feb 1;132(3):jcs225557. doi: 10.1242/jcs.225557. J Cell Sci. 2019. PMID: 30709970 Free PMC article.
-
GABARAP activates ULK1 and traffics from the centrosome dependent on Golgi partners WAC and GOLGA2/GM130.Autophagy. 2016 May 3;12(5):892-3. doi: 10.1080/15548627.2016.1159368. Autophagy. 2016. PMID: 26986052 Free PMC article. Review.
-
The centrosome-Golgi apparatus nexus.Philos Trans R Soc Lond B Biol Sci. 2014 Sep 5;369(1650):20130462. doi: 10.1098/rstb.2013.0462. Philos Trans R Soc Lond B Biol Sci. 2014. PMID: 25047616 Free PMC article. Review.
Cited by
-
Cell Cycle-Dependent Dynamics of the Golgi-Centrosome Association in Motile Cells.Cells. 2020 Apr 25;9(5):1069. doi: 10.3390/cells9051069. Cells. 2020. PMID: 32344866 Free PMC article.
-
Golgi Dysfunctions in Ciliopathies.Cells. 2022 Sep 6;11(18):2773. doi: 10.3390/cells11182773. Cells. 2022. PMID: 36139347 Free PMC article. Review.
-
Organelle Inheritance Control of Mitotic Entry and Progression: Implications for Tissue Homeostasis and Disease.Front Cell Dev Biol. 2019 Jul 23;7:133. doi: 10.3389/fcell.2019.00133. eCollection 2019. Front Cell Dev Biol. 2019. PMID: 31396510 Free PMC article. Review.
-
Trisomy 21 increases microtubules and disrupts centriolar satellite localization.Mol Biol Cell. 2022 Jul 1;33(8):br11. doi: 10.1091/mbc.E21-10-0517-T. Epub 2022 Apr 27. Mol Biol Cell. 2022. PMID: 35476505 Free PMC article.
-
A guiding torch at the poles: the multiple roles of spindle microtubule-organizing centers during cell division.Cell Cycle. 2020 Jun;19(12):1405-1421. doi: 10.1080/15384101.2020.1754586. Epub 2020 May 13. Cell Cycle. 2020. PMID: 32401610 Free PMC article. Review.
References
Publication types
MeSH terms
Substances
Grants and funding
LinkOut - more resources
Full Text Sources
