. 2019 Apr 8;8(4):326.
doi: 10.3390/cells8040326.

High Glucose Concentrations Negatively Regulate the IGF1R/Src/ERK Axis through the MicroRNA-9 in Colorectal Cancer

Affiliations

High Glucose Concentrations Negatively Regulate the IGF1R/Src/ERK Axis through the MicroRNA-9 in Colorectal Cancer

Ya-Chun Chen et al. Cells. .

Abstract

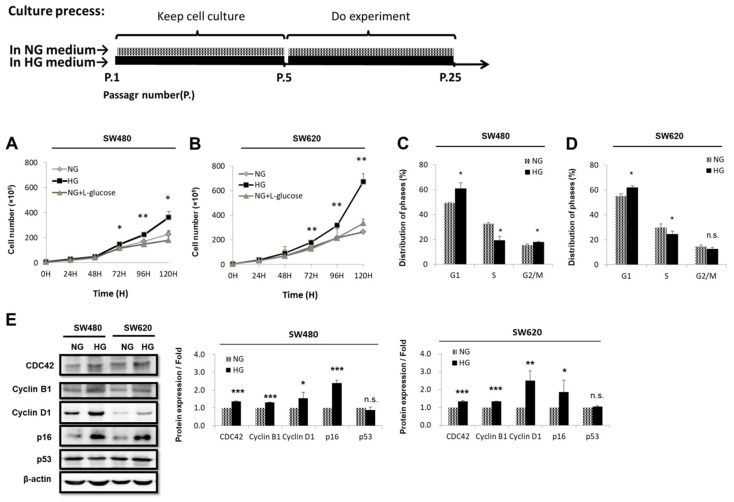
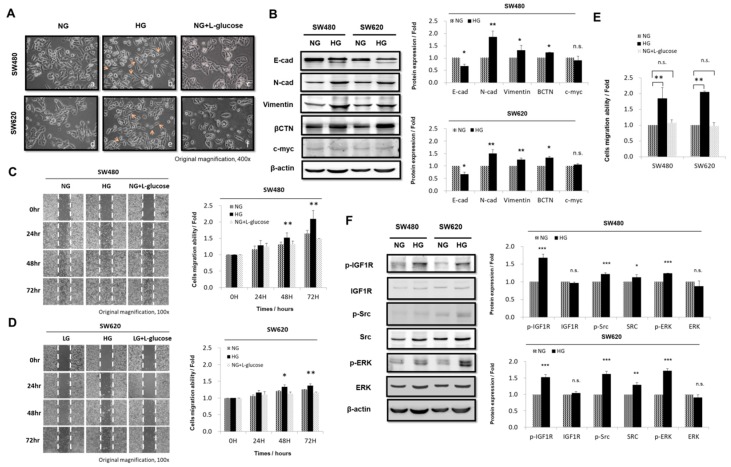
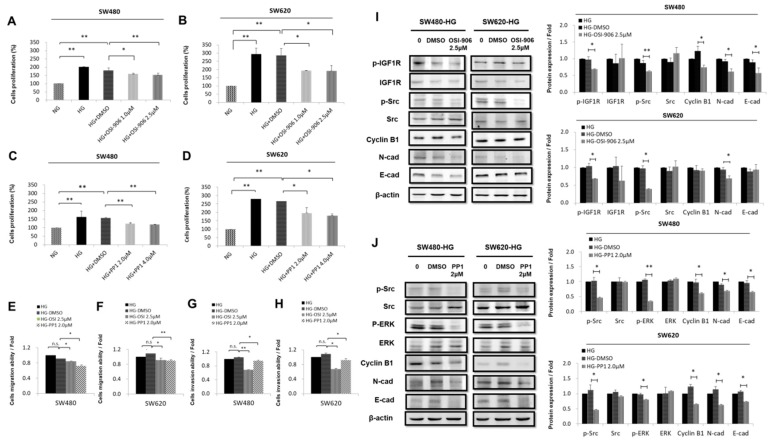
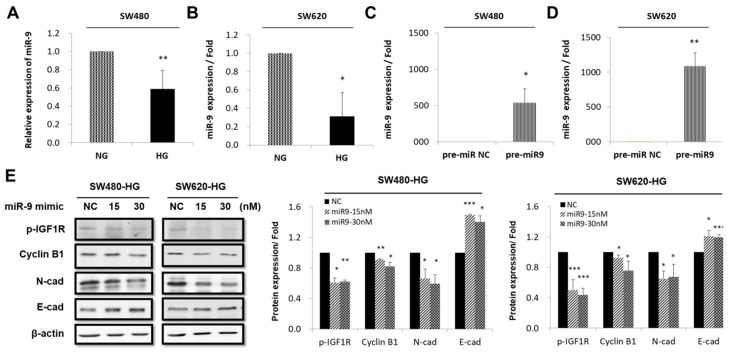
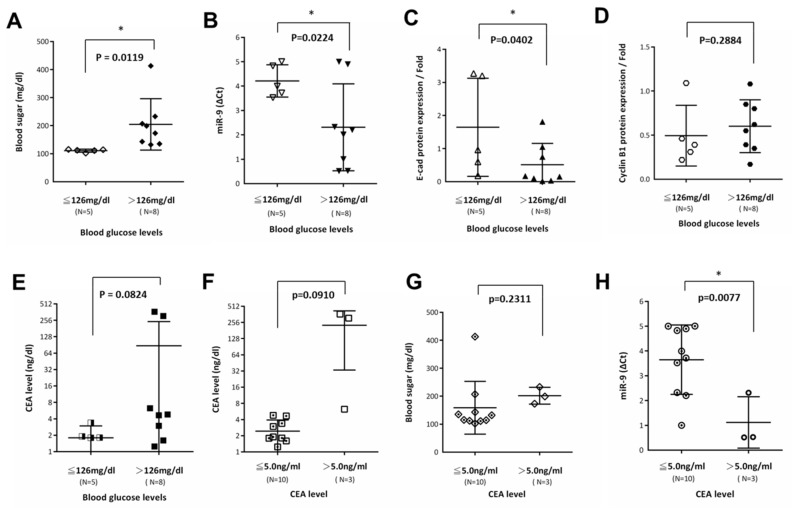
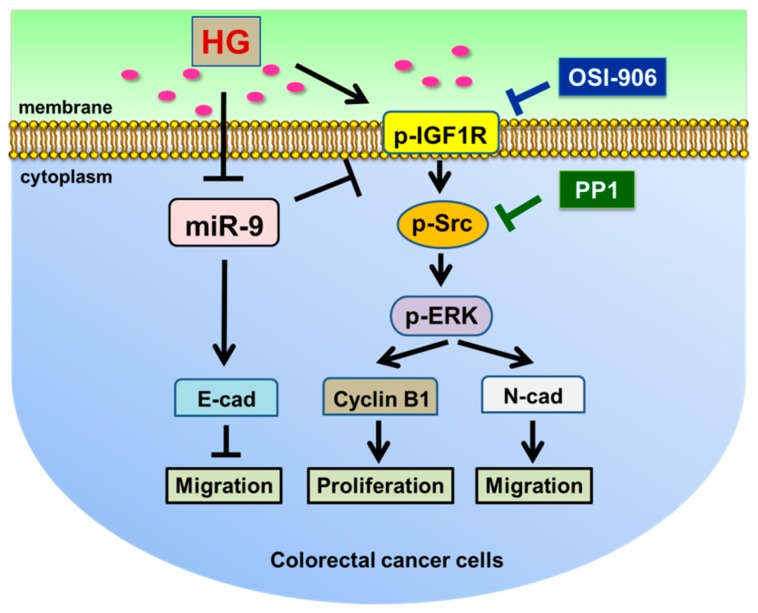
Studies have revealed that people with hyperglycemia have a high risk of colorectal cancer (CRC). Hyperglycemia may be responsible for supplying energy to CRC cells. However, the potential molecular mechanism for this association remains unclear. Furthermore, microRNA-9 (miR-9) has a tumor-suppressive function in CRC. Aberrant reduced expression of miR-9 is involved in the development and progression of malignancy caused by a high glucose (HG) concentration. In this study, we used an HG concentration to activate miR-9 downregulation in CRC cells. Our results indicated that miR-9 decreased the insulin-like growth factor-1 receptor (IGF1R)/Src signaling pathway and downstream cyclin B1 and N-cadherin but upregulated E-cadherin. The HG concentration not only promoted cell proliferation, increased the G1 population, and modulated epithelial-to-mesenchymal transition (EMT) protein expression and morphology but also promoted the cell migration and invasion ability of SW480 (low metastatic potential) and SW620 (high metastatic potential) cells. In addition, low glucose concentrations could reverse the effect of the HG concentration in SW480 and SW620 cells. In conclusion, our results provide new evidence for multiple signaling pathways being regulated through hyperglycemia in CRC. We propose that blood sugar control may serve as a potential strategy for the clinical management of CRC.

Keywords: Src; colorectal cancer; epithelial to mesenchymal transition; extracellular signal-regulated kinase (ERK1/2); high concentration of glucose; insulin-like growth factor-1 receptor; metastasis; microRNA-9; proliferation.


Conflict of interest statement

The authors declare no conflict of interest.

Figures

Figure 1
Figure 1
Glucose promoted cell proliferation and induced cell-cycle-regulated protein expression in colorectal cancer (CRC) cells. (A) SW480 (low metastatic potential) and (B) SW620 (high metastatic potential) cells were cultured in medium with different concentrations of glucose: Normal glucose (NG, 5.5 mM d-glucose), high glucose (HG, 25 mM d-glucose), and osmotic control (NG + l-glucose, 5.5 mM d-glucose + 19.5 mM l-glucose) for a period from 0 to 120 h. Trypan blue stain assay was used to analyze proliferation rates. These data show that d-glucose but not l-glucose promoted cell proliferation. A significant increase in proliferation was observed in CRC cells cultured in HG-concentration medium compared with NG or osmotic control at 72, 96, and 120 h. (C,D) Cell cycle analysis was performed using FACSCalibur. These data show that HG concentration promoted cell cycle G1 arrest in both cell types. The data are representative of two independent experiments. (E) SW480 and SW620 cells were cultured in medium with different concentrations of glucose (NG and HG) for 48 h. The expression levels of CDC42, cyclin B1, cyclin D1, p16, and p53 cell cycle regulated protein were examined using Western blotting. All proteins were increased in HG-concentration medium, but p53 was unchanged in both CRC cell lines. Statistically significant differences between the two groups were judged using Student’s t-tests; * p < 0.05, ** p < 0.005, *** p < 0.001; n.s. = nonsignificant.
Figure 2
Figure 2
High glucose (HG) concentrations induced epithelial-to-mesenchymal transition protein expression and enhanced migration activity in colorectal cancer (CRC) cells. SW480 (low metastatic potential) and SW620 (high metastatic potential) cells were cultured in different concentrations of glucose (normal: NG; HG; and osmotic control: NG + l-glucose). (A) Morphological change occurred from epithelial to mesenchymal type in the HG-concentration group. (B) HG concentration caused downregulation of E-cadherin and upregulation of N-cadherin, βCTN, and vimentin, but c-myc was unchanged, as detected using Western blotting. β-actin was evaluated as an internal control. (C,D) Wound healing assay showed that HG concentration promoted cell motility in SW480 and SW620 CRC cells after 48 and 72 h of culture, compared with the NG and NG + l-glucose groups. (E) In a Transwell migration assay, 3.5 × 10⁵ SW480 and SW620 CRC cells were plated onto a 24-well plate and cultured in NG and HG-concentration medium for 96 h. HG concentration promoted cell motility in SW480 and SW620 cells. NG + l-glucose cells were evaluated as ostomic controls. (F) These data show that HG concentration caused upregulation of p-IGF1R in CRC. In addition, HG concentration promoted IGF1R downstream signaling, including p-Src and p-ERK; these proteins were increased when CRC cells were cultured in HG-concentration medium. Levels of β-actin were evaluated as loading controls. Statistically significant differences between the two groups were judged using Student’s t-tests; * p < 0.05, ** p < 0.005, *** p < 0.001; n.s. = nonsignificant.
Figure 3
Figure 3
High glucose (HG) concentrations regulated IGF1R and Src and promoted the downstream signaling pathway in colorectal cancer (CRC) cells. (A,B) OSI-906 (IGF1R inhibitor) or (C,D) PP1 (Src inhibitor) affected proliferation in a dose-dependent manner in CRC cells. First, 3.5 × 10⁵ SW480 and SW620 cells were seeded onto a 24-well plate. After incubation overnight, they were treated with OSI-906 (1.0 μM and 2.5 μM) or PP1 (2.0 μM and 4.0 μM). These data show that OSI-906 and PP1 significantly inhibited proliferation induced by HG concentration in SW480 and SW620 cells at 1.0 μM and 2.5 μM doses or 2.0 μM and 4.0 μM doses compared with the control group (dimethyl sulfoxide, DMSO). (EH) Metastatic activities of CRC cells treated with OSI-906 or PP1 were detected using a Transwell assay; 3.5 × 10⁵ SW480 and SW620 cells were plated onto a 24-well plate and incubated overnight after treatment with OSI-906 2.5 μM or PP1 2.0 μM for 96 h. These data show that OSI-906 (2.5 μM) and PP1 (2 μM) significantly inhibited the migration viability of SW480 and SW620 cells, which was promoted by HG concentration, compared with the HG-concentration group evaluated as positive controls. In addition, 3.5 × 10⁵ SW480 or SW620 cells were cultured in basement membrane matrix-coated 24-well plates with HG-concentration medium and then treated with OSI-906 or PP1 for 168 h. These data show that OSI-906 and PP1 significantly inhibited the invasion viability of SW480 and SW620 cells. (I,J) Western blot analysis data suggest that OSI-906 or PP1 treatment reduced p-IGF1R or p-Src downstream signaling, reduced the expression of cell-cycle-regulated proteins, and induced and reduced expression of epithelial-to-mesenchymal transition proteins in HG-concentration medium compared with the control group (DMSO). HG concentration was evaluated as a positive control and levels of β-actin were evaluated as loading controls. These data are expressed as mean ± SEM and are representative of two independent experiments according to Student’s t-tests; * p < 0.05, ** p < 0.005; n.s. = nonsignificant.
Figure 4
Figure 4
Expression and regulation of miR-9 in colorectal cancer (CRC) cell lines by high glucose (HG) concentration. TaqMan quantitative real-time polymerase chain reaction analysis was performed on miR-9 in SW480 and SW620 CRC cell lines that were cultured in different concentrations of glucose: Namely NG (5.5 mM d-glucose) and HG (25 mM d-glucose). In HG-concentration medium, miR-9 was decreased in both (A) SW480 (p < 0.005) and (B) SW620 (p < 0.05). All data were analyzed using a relative quantification method (2−∆∆Ct) with RNU6B small RNA as an internal control. (C) SW480 and (D) SW620 cells were transfected with pre-miR-9 at different doses (15 and 30 nM) or pre-miR negative control (NC) for 48 h in HG-concentration medium. (E) Western blotting validated the downregulation of p-IGF1R, cyclin B1, and N-cadherin as well as the upregulation of E-cadherin expression through pre-miR-9 overexpression, compared with pre-miR NC. β-actin was evaluated as an internal control. Statistically significant differences between the two groups were judged using Student’s t-tests, * p < 0.05, ** p < 0.005, *** p < 0.001; n.s. = nonsignificant.
Figure 5
Figure 5
Expression of cell proliferation and morphology was reversible in colorectal cancer (CRC) cell lines by transferring them from high glucose (HG)-concentration medium to normal glucose (NG)-concentration medium. (A) SW480 and (B) SW620 cells were exposed to medium with different concentrations of glucose, namely NG (5.5 mM d-glucose) and HG (25 mM d-glucose), for a period from 0 to 120 h. Trypan blue stain assay was used to analyze proliferation rates. After 10 generations, a significant rescue of proliferation rate was observed in CRC cells cultured in NG- and HG-concentration media for 120 h compared with the control group. (CE) Transferring cells from HG- to NG-concentration medium rescued epithelial-to-mesenchymal transition (EMT) protein marker expression and cell-cycle-regulated protein reversed EMT protein marker expression; cell-cycle-regulated protein reduced cell proliferation and changed cell morphology to an epithelial type. Levels of β-actin were evaluated as loading controls. These data show that the cellular mechanism modulated by glucose concentration in CRC lines is reversible. Statistically significant differences between the two groups were judged by Student’s t-tests; * p < 0.05, ** p < 0.005, *** p < 0.001; n.s. = nonsignificant.
Figure 6
Figure 6
E-cadherin is a regulator targeting miR-9 that was negatively correlated with carcinoembryonic antigen (CEA) in patients with colorectal cancer (CRC) and hyperglycemia. (A) Average expression level of blood sugar was upregulated in CRC tissues in the hyperglycemia group (>126 mg/dL, n = 8). (B) Average expression level of miR-9 was downregulated in CRC specimens in the hyperglycemia group (>126 mg/dL, n = 8) as determined by quantitative real-time polymerase chain reaction (qRT-PCR). (C) Western blot analysis data show that the average expression of E-cadherin was also decreased in CRC specimens in the hyperglycemia group (>126 mg/dL, n = 8). (D) However, the average expression of cyclin B1 did not change significantly in CRC specimens in the hyperglycemia group. (E) Average CEA levels in the clinical data were increased in the hyperglycemia group (>126 mg/dL, n = 8) compared with the prediabetes group (≦125 mg/dL), but the difference did not reach statistical significance. (F) Average CEA levels were upregulated in CRC specimens with high CEA expression (CEA > 5.0 ng/mL, n = 3) but the difference did not reach statistical significance. (G) Average expression level of blood sugar was upregulated in CRC tissues with high CEA expression (CEA > 5.0 ng/mL, n = 3), but the difference did not reach statistical significance. (H) Average expression level of miR-9 was downregulated in CRC specimens with high CEA expression (CEA > 5.0 ng/mL, n = 3) as determined by qRT-PCR. These data show that the effect of miR-9 expression was negatively correlated with the average expression of CEA in CRC specimens. Moreover, E-cadherin was a direct target of miR-9 in CRC. Statistically significant differences between the two groups were judged by Student’s t-tests; * p < 0.05; n.s. = nonsignificant.
Figure 7
Figure 7
Molecular mechanism through which high glucose (HG) concentration promotes proliferation and migration in colorectal cancer (CRC) cells. HG concentration activated pIGF1R and p-Src expression and increased downstream signaling by mediating the downregulation of miR-9 expression. Moreover, OSI-906 decreased the expression of the EMT protein N-cadherin and reduced the expression of the cell-cycle-regulated protein cyclin B1, as determined through Western blotting, but only cyclin B1 and E-cadherin were unchanged in SW620 cells (Figure 3I). Similarly, PP1 decreased the expression of the EMT protein N-cadherin and reduced the expression of the cell-cycle-regulated protein cyclin B1, as determined through Western blotting (Figure 3J), compared with the control group (dimethyl sulfoxide) cultured in HG-concentration medium. These data demonstrate that HG concentration promoted CRC cell proliferation, modulated EMT protein expression and morphology, and promoted cell migration and invasion ability through the IGF1R/Src/ERK pathway. In addition, miR-9-transfected cells expressed lower levels of p-IGF1R, cyclin B1, and N-cadherin, but E-cadherin was more upregulated compared with the negative control-transfected SW480 and SW620 cells, as determined through Western blotting. Thus, miR-9 is a tumor-suppressive microRNA that may regulate through the IGF1R/Src/ERK pathway the targeting of cyclin B1, N-cadherin, and E-cadherin in CRC cells in an HG-concentration environment (Figure 4E).

Similar articles

Cited by

References

    1. Siegel R.L., Miller K.D., Fedewa S.A., Ahnen D.J., Meester R.G.S., Barzi A., Jemal A. Colorectal cancer statistics, 2017. CA Cancer J. Clin. 2017;67:177–193. doi: 10.3322/caac.21395. - DOI - PubMed
    1. Lin C.Y., Lee C.H., Huang C.C., Lee S.T., Guo H.R., Su S.B. Impact of high glucose on metastasis of colon cancer cells. World J. Gastroenterol. 2015;21:2047–2057. doi: 10.3748/wjg.v21.i7.2047. - DOI - PMC - PubMed
    1. Lee M.Y., Lin K.D., Hsiao P.J., Shin S.J. Thiamine corrects delayed replication and decreases production of lactate and advanced glycation end-products in bovine retinal and human umbilical vein endothelial cells cultured under high glucose conditions. Metabolism. 2012;61:242–249. doi: 10.1016/j.metabol.2011.06.020. - DOI - PubMed
    1. Zhu B., Wu X., Wu B., Pei D., Zhang L., Wei L. The relationship between diabetes and colorectal cancer prognosis: A meta-analysis based on the cohort studies. PLoS ONE. 2017;12:e0176068. doi: 10.1371/journal.pone.0176068. - DOI - PMC - PubMed
    1. Duan W., Shen X., Lei J., Xu Q., Yu Y., Li R., Wu E., Ma Q. Hyperglycemia, a neglected factor during cancer progression. Biomed. Res. Int. 2014;2014:461917. doi: 10.1155/2014/461917. - DOI - PMC - PubMed

Publication types

MeSH terms