. 2019 Apr 5;9(1):5731.
doi: 10.1038/s41598-019-42146-5.

Evolution of folate biosynthesis and metabolism across algae and land plant lineages

Affiliations

Evolution of folate biosynthesis and metabolism across algae and land plant lineages

V Gorelova et al. Sci Rep. .

Abstract

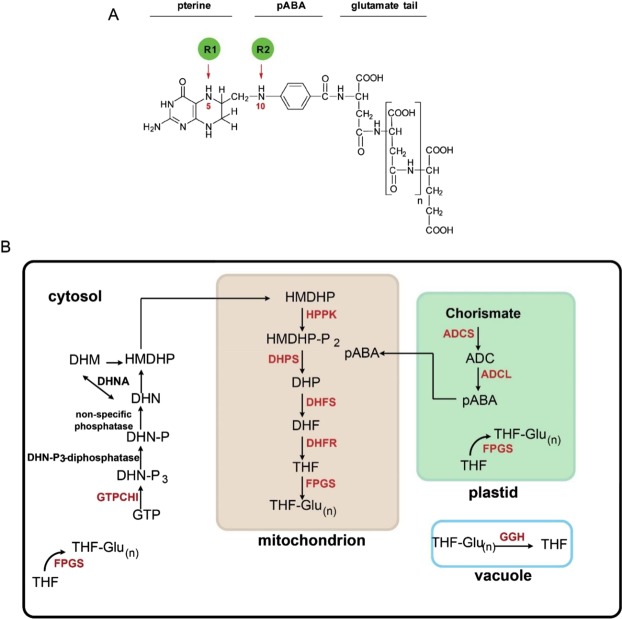
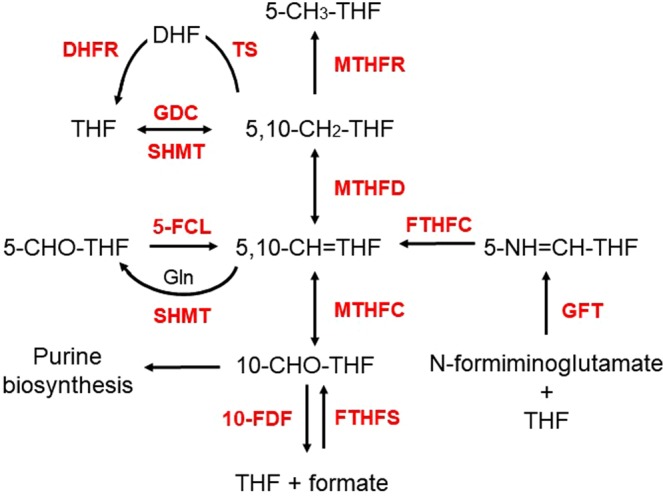
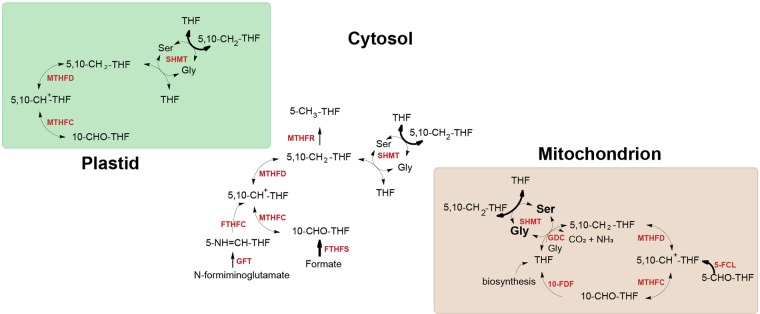
Tetrahydrofolate and its derivatives, commonly known as folates, are essential for almost all living organisms. Besides acting as one-carbon donors and acceptors in reactions producing various important biomolecules such as nucleic and amino acids, as well as pantothenate, they also supply one-carbon units for methylation reactions. Plants along with bacteria, yeast and fungi synthesize folates de novo and therefore constitute a very important dietary source of folates for animals. All the major steps of folate biosynthesis and metabolism have been identified but only few have been genetically characterized in a handful of model plant species. The possible differences in the folate pathway between various plant and algal species have never been explored. In this study we present a comprehensive comparative study of folate biosynthesis and metabolism of all major land plant lineages as well as green and red algae. The study identifies new features of plant folate metabolism that might open new directions to folate research in plants.


Conflict of interest statement

The authors declare no competing interests.

Figures

Figure 1
Figure 1
Structure of the THF molecule and folate biosynthesis. (A) Structure of THF molecule. (B) Folate biosynthesis in higher plants. Precursors: GTP, guanosine triphosphate; DHN-P3, dihydroneopterin triphosphate; DHN-P, dihydroneopterin monophosphate; DHN, dihydroneopterin; DHM, dihydromonapterin; HMDHP, 6-hydroxymethyldihydropterin; HMDHP-P2, 6-hydroxymethyldihydropterin pyrophosphate; DHP, dihydropteroate; DHF, dihydrofolate; THF, tetrahydrofolate; THF-Glu(n), tetrahydrofolate polyglutamate; ADC, aminodeoxychorismate; pABA, para-aminobenzoic acid. Enzymes: GTPCHI, GTP cyclohydrolase I; DHN-P3-diphosphatase, dihydroneopterin triphosphate pyrophosphatase; DHNA, dihydroneopterine aldolase; HPPK, HMDHP pyrophosphokinase; DHPS, dihydropteroate synthase; DHFS, dihydrofolate synthetase; DHFR, dihydrofolate reductase; FPGS, folylpolyglutamate synthetase; ADCS, aminodeoxychorismate synthase; ADCL, aminodeoxychorismate lyase; GGH, gamma-glutamyl hydrolase.
Figure 2
Figure 2
Interconversion of folate species. THF, tetrahydrofolate; 5-CH3-THF, 5-methyltetrahydrofolate; 5,10-CH2-THF, 5,10-methylenetetrahydrofolate; 5,10-CH+-THF, 5,10-methenyltetrahydrofolate; 5-CHO-THF, 5-formyltetrahydrofolate; 10-CHO-THF, 10-formyltetrahydrofolate. SHMT, serine hydroxymethyl transferase; GDC, glycine decarboxylase complex, FTHFC, formiminotetrahydrofolate cyclodeaminase; 5-FCL, 5-formyltetrahydrofolate cycloligase; GFT, glutamate formiminotransferase; FTHFS, 10-CHO-THF synthetase; MTHFD-MTHFC, 5,10- CH2-THF dehydrogenase/5,10-CH+-THF cyclohydrolase; MTHFR, methylenetetrahydrofolate reductase; 10-FDF, 10-CHO-THF deformylase.
Figure 3
Figure 3
Phylogenetic analysis, subcellular localization and domain composition of ADCS proteins. Species names are followed by protein identifiers. The bar indicates the mean distance of 2.0 changes per amino acid residue. The numbers at the branching points indicate the percentage of times that each branch topology was found during bootstrap analysis (n = 1000). The box contains predicted functional domains. Schemes on the right represent domain organisation of analysed proteins (colored boxes represent functional domains, lengths of black lines correspond to lengths of proteins. The scale bar below shows protein containing 500 amino acids). Cyt, cytosolic localization; chl, plastidial localization. Indication of double localization (e.g. cyt chl) for a single protein implies its probable localization to both compartments.
Figure 4
Figure 4
Phylogenetic analysis, subcellular localization and domain composition of ADCL proteins. Species names are followed by protein identifiers. The bar indicates the mean distance of 0.6 changes per amino acid residue. The numbers at the branching points indicate the percentage of times that each branch topology was found during bootstrap analysis (n = 1000). Schemes on the right represent domain organisation of analysed proteins (color boxes represent functional domains, lengths of black lines correspond to lengths of proteins. The scale bar below shows protein containing 500 amino acids). The box contains predicted functional domains. Cyt, cytosolic localization; chl, plastidial localization.
Figure 5
Figure 5
Phylogenetic analysis, subcellular localization and domain composition of FPGS proteins. Species names are followed by protein identifiers. The bar indicates the mean distance of 1.0 change per amino acid residue. The numbers at the branching points indicate the percentage of times that each branch topology was found during bootstrap analysis (n = 1000). Schemes on the right represent domain organisation of analysed proteins (color boxes represent functional domains, lengths of black lines correspond to lengths of proteins. The scale bar below shows protein containing 500 amino acids). The box contains predicted functional domains. Cyt, cytosolic localization; chl, plastidial localization; mit, mitochondrial localization. Indication of double localization (e.g. cyt chl) for a single protein implies its probable localization to both compartments.
Figure 6
Figure 6
Phylogenetic trees of the protein sequences of the TS domain constructed using maximum likelihood method Phyml (see text). The selected model using Bayesian information criterion was LG + G + I with gamma shape parameter estimate = 1.117 and the proportion of invariable site estimate = 0.207. Nodes values represents the Bayesian posterior probabilities branch support. The species colour code corresponds to the type of plastid pigments, as follows: purple, chlorophyll a; green, chlorophyll a and b; red, chlorophyll a and c.
Figure 7
Figure 7
Phylogenetic representation in the protein sequence space for TS domains. Non-linear mapping methods are designed to offer a configuration of points in this multidimensional space that is representative of the observed distances. With this method, axes become arbitrary and every rotation or symmetry is admissible. In this figure, the distance between two data points on the figure tends to display the distance between species. Links between points show the ML phylogenic tree presented in the Fig. 6. Blue branches: monofunctional TS, red branches: bifunctional TS. Brown letters, bikont cluster; brown letters in bold, the green lineage; black letters, unikont cluster. Abbreviations for genus names: Arab_tha1, Arabidopsis thaliana 1; Ory_sat1, Oryza sativa 1; Chla_rei, Chlamydomonas reinhardtii; Chla_eug, Chlamydomonas eustigma; Ostr_tau, Ostreococcus tauri; Plas_ber, Plasmodium berghei; Plas_cha, Plasmodium chabaudi; Toxo_gon, Toxoplasma gondii; Neos_can, Neospora caninum; Cyan_mer, Cyanidioschyzon merolae; Leis_maj, Leishmania major strain Friedlin; Phae_tri, Phaeodactylum tricornutum; Thal_pse, Thalassiosira pseudonana; Phyt_soj, Phytophthora sojae; Mus_musc, Mus musculus; Rat_nor, Rattus norvegicus; Neur_cra, Neurospora crassa; Neur_tet, Neurospora tetrasperma; Sach_cer, Saccharomyces cerevisiae; Metha_ja, Methanocaldococcus jannaschii; Baci_sub, Bacillus subtilis; Baci_hal, Bacillus halodurans.
Figure 8
Figure 8
Phylogenetic trees of the protein sequences of the DHPS domain constructed using maximum likelihood method Phyml (see text). The selected model using Bayesian information criterion was LG + G + I with gamma shape parameter estimate = 1.058 and the proportion of invariable site estimate = 0.047. Nodes values represents the Bayesian posterior probabilities branch support. The species colour code corresponds to the type of plastid pigments, as follows: purple, chlorophyll a; green, chlorophyll a and b; and red, chlorophyll a and c.
Figure 9
Figure 9
Phylogenetic representation in the protein sequence space for DHPS domains. Non-linear mapping methods are designed to offer a configuration of points in this multidimensional space that is representative of the observed distances. With this method, axes become arbitrary and every rotation or symmetry is admissible. In this figure, the distance between two data points on the figure tends to display the distances between species. Links between points show the ML phylogenic tree presented in the Fig. 8. Blue branches: monofunctional enzyme, red branches: bifunctional enzyme. Brown letters, bikont cluster; brown letters in bold, the green lineage; black letters, unikont cluster. Abbreviations for genus names: Arab_thM, Arabidopsis thaliana Mitochondrial; Arab_thC, Arabidopsis thaliana Cytosolic; Popu_tri, Populus trichocarpa; Pisu_sat, Pisum sativum; Oryz_sat, Oryza sativa; Phys_pat, Physcomitrella patens; Chla_rei, Chlamydomonas reinhardtii; Ostr_tau, Ostreococcus tauri; Plas_yoe, Plasmodium yoelii; Plas_ber, Plasmodium berghei; Toxo_gon, Toxoplasma gondii; Neos_can, Neospora caninum; Cyan_mer, Cyanidioschyzon merolae; Phae_tri, Phaeodactylum tricornutum; Thal_pse, Thalassiosira pseudonana; Aura_lim, Aurantiochytrium limacinum; Phyt_soj, Phytophthora sojae; Aspe_fum, Aspergillus fumigatus; Aspe_ory, Aspergillus oryzae; Neur_cra, Neurospora crassa; Pneu_car, Pneumocystis carinii; Ashb_gos, Ashbya gossypii; Cand_gla, Candida glabrata; Bige_nat, Bigelowiella natans; Rick_gry, Rickettsiella grylli; Chla_pne, Chlamydia pneumonia; Rick_bel, Rickettsia bellii; Wolb_dro, Wolbachia Drosophila simulans; Fran_phi, Francisella philomiragia; Esch_col, Escherichia coli; Salm_typ, Salmonella typhi; Baci_sub, Bacillus subtilis; Stap_aur, Staphylococcus aureus; Syne_cho, Synechococcus sp.; Anab_var, Anabaena variabilis; Micr_cht, Microcoleus.
Figure 10
Figure 10
Sources of one-carbon units in the plant cell. Arrows in bold indicate sources of one-carbon units. THF, tetrahydrofolate; 5-CH3-THF, 5-methyltetrahydrofolate; 5,10-CH2-THF, 5,10-methylenetetrahydrofolate; 5,10-CH+-THF, 5,10-methenyltetrahydrofolate; 5-CHO-THF, 5-formyltetrahydrofolate; 10-CHO-THF, 10-formyltetrahydrofolate; Ser, serine; Gly, glycine. SHMT, serine hydroxymethyltransferase; GDC, glycine decarboxylase complex, FTHFC, formiminotetrahydrofolate cyclodeaminase; 5-FCL, 5-formyltetrahydrofolate cycloligase; GFT, glutamate formiminotransferase; FTHFS, 10-CHO-THF synthetase; MTHFD-MTHFC, 5,10- CH2-THF dehydrogenase/5,10-CH+-THF cyclohydrolase; MTHFR, methylenetetrahydrofolate reductase; 10-FDF, 10-CHO-THF deformylase.

Similar articles

Cited by

References

    1. Chistoserdova L, Vorholt JA, Thauer RK, Lidstrom ME. C1 transfer enzymes and coenzymes linking methylotrophic bacteria and methanogenic Archaea. Science. 1998;281:99–102. doi: 10.1126/science.281.5373.99. - DOI - PubMed
    1. Edman JC, Goldstein AL, Erbe JG. Para‐aminobenzoate synthase gene of Saccharomyces cerevisiae encodes a bifunctional enzyme. Yeast. 1993;9:669–675. doi: 10.1002/yea.320090613. - DOI - PubMed
    1. James TY, et al. The pab1 gene of Coprinus cinereus encodes a bifunctional protein for paraaminobenzoic acid (PABA) synthesis: implications for the evolution of fused PABA synthases. Journal of Basic Microbiology. 2002;42:91–103. doi: 10.1002/1521-4028(200205)42:2<91::AID-JOBM91>3.0.CO;2-8. - DOI - PubMed
    1. Triglia T, Cowman AF. Plasmodium falciparum: a homologue of p-aminobenzoic acid synthetase. Experimental Parasitology. 1999;92:154–158. doi: 10.1006/expr.1999.4400. - DOI - PubMed
    1. Basset GJ, et al. Folate synthesis in plants: the p-aminobenzoate branch is initiated by a bifunctional PabAPabB protein that is targeted to plastids. Proceedings of the National Academy of Sciences of the United States of America. 2004;101:1496–1501. doi: 10.1073/pnas.0308331100. - DOI - PMC - PubMed

Publication types