. 2019 Mar 27;5(3):eaav6322.
doi: 10.1126/sciadv.aav6322. eCollection 2019 Mar.

Hybrid nanocarriers incorporating mechanistically distinct drugs for lymphatic CD4+ T cell activation and HIV-1 latency reversal

Affiliations

Hybrid nanocarriers incorporating mechanistically distinct drugs for lymphatic CD4+ T cell activation and HIV-1 latency reversal

Shijie Cao et al. Sci Adv. .

Abstract

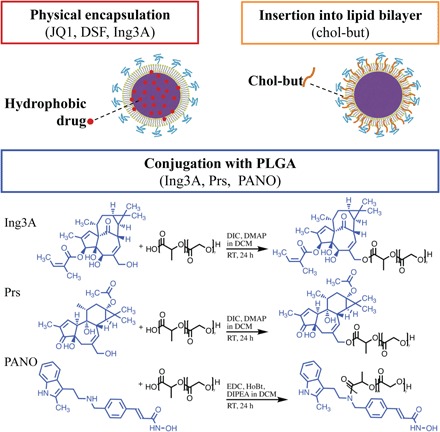
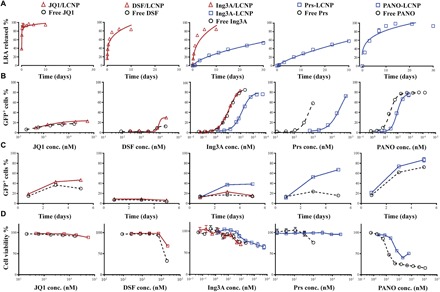
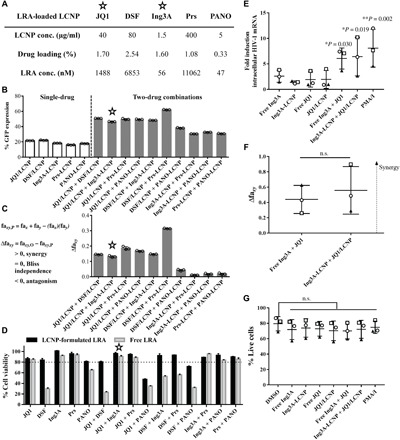
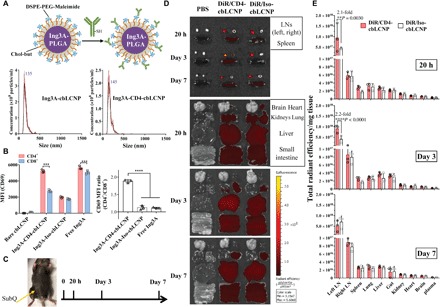
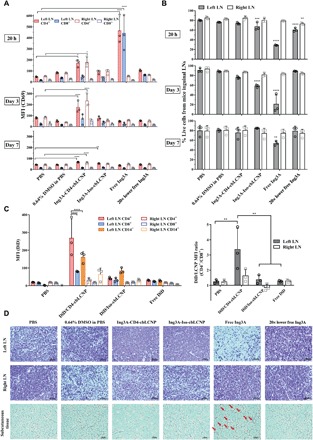
A proposed strategy to cure HIV uses latency-reversing agents (LRAs) to reactivate latent proviruses for purging HIV reservoirs. A variety of LRAs have been identified, but none has yet proven effective in reducing the reservoir size in vivo. Nanocarriers could address some major challenges by improving drug solubility and safety, providing sustained drug release, and simultaneously delivering multiple drugs to target tissues and cells. Here, we formulated hybrid nanocarriers that incorporate physicochemically diverse LRAs and target lymphatic CD4+ T cells. We identified one LRA combination that displayed synergistic latency reversal and low cytotoxicity in a cell model of HIV and in CD4+ T cells from virologically suppressed patients. Furthermore, our targeted nanocarriers selectively activated CD4+ T cells in nonhuman primate peripheral blood mononuclear cells as well as in murine lymph nodes, and substantially reduced local toxicity. This nanocarrier platform may enable new solutions for delivering anti-HIV agents for an HIV cure.


Figures

Fig. 1
Fig. 1. Strategies for loading LRAs into LCNPs.
Hydrophobic LRAs were physically encapsulated into the PLGA core. Chol-but, as the prodrug of butyric acid, was inserted into the lipid bilayer. LRAs with hydroxyl or amine groups were conjugated to the PLGA followed by LCNP synthesis. Prs, prostratin; PANO, panobinostat; DIC, N,N′-diisopropylcarbodiimide; DMAP, 4-(dimethylamino)pyridine; RT, room temperature; EDC, 1-ethyl-3-(3-dimethylaminopropyl)carbodiimide; HoBt, 1-hydroxybenzotriazole; DIPEA, N,N-diisopropylethylamine.
Fig. 2
Fig. 2. In vitro dose-response and time-dependent HIV-1 latency reversal correlates with LRA release kinetics from LCNPs.
(A) Release kinetics of physically encapsulated LRAs (red triangle) and chemically conjugated LRAs (blue square) from LCNPs in cell culture media at 37°C. Data were fit by nonlinear regression, detailed in table S3. (B) Dose-response curve for latent HIV reactivation (indicated as a percentage of GFP+ cells) on J-Lat A1 cells incubated with single LRA formulations for 20 hours. Data were fit in the four-parameter log-logistic model, detailed in table S4. (C) Time-dependent curve for latent HIV reactivation of J-Lat A1 cells incubated with single LRA formulations over 5 days. (D) Cell viability of J-Lat A1 cells after incubation with single free LRAs or LCNP-formulated LRAs at different concentrations for 20 hours. Cell viability was measured by monitoring metabolic activity with the CellTiter-Blue Assay. Each experiment was performed once with n = 3 wells of each treatment. Data represent means ± SD. LRA/LCNP, LRA was physically encapsulated into LCNPs (red curve); LRA-LCNP, LRA was chemically conjugated to the PLGA (blue curve).
Fig. 3
Fig. 3. LCNP-formulated Ing3A and JQ1 enhance latent HIV reactivation, reduce cytotoxicity from J-Lat A1 cells, and synergistically increase HIV-1 mRNA expression in CD4+ T cells from infected individuals on suppressive HAART.
(A) Concentrations of single and combination LCNP-formulated LRAs. LRA concentrations were calculated as total LRA in LCNPs. (B) In vitro latent HIV reactivation using single or combination LCNP-formulated LRAs on J-Lat A1 cells for 20 hours. (C) Calculation of synergy for LCNP-formulated LRA combinations using the Bliss independence model. Data are presented as the difference between the observed and predicted percentage of GFP+ cells. fax or fay, percentage of GFP expression by drug x or y; faxy,O, observed percentage of GFP expression by a combination of drug x and y; faxy,P, predicted percentage of GFP expression by a combination of drug x and y using the equation detailed in Materials and Methods. (D) Cell viability of J-Lat A1 cells after incubation with single or combination LRA formulations for 20 hours. Free or LCNP-formulated LRAs were dosed at the concentrations that achieved similar latent HIV reactivation (JQ1, 1488 nM; DSF, 14,840 nM; Ing3A, 3.5 nM; Prs, 251 nM; and PANO, 13.2 nM). The combination of JQ1 and Ing3A (✫) was chosen for high potency, synergy, and low cytotoxicity. The experiment (A to D) was performed once with n = 3 wells of each treatment. Data represent means ± SD. (E) Intracellular HIV-1 mRNA levels in CD4+ T cells isolated from peripheral blood of infected individuals and treated with free Ing3A, Ing3A-LCNP, free JQ1, JQ1/LCNP, or their binary combinations. Data are presented as fold induction relative to DMSO control. Statistical analysis was performed using paired one-way analysis of variance (ANOVA) with Bonferroni’s test comparing each group with the DMSO control. *P < 0.05, **P < 0.005. (F) Calculation of synergy for Ing3A and JQ1 combinations using the Bliss independence model. Data are presented as the difference between the observed and predicted fractional effect by the LRAs compared to the PMA/I positive control (see Materials and Methods for details). Statistical analysis was performed using paired Student’s t test. n.s., not significant. (G) Percentage of live cells after treatments, measured by live/dead staining following the fluorescence-activated cell sorting analysis. The experiments (E to G) were performed using peripheral blood from three different individuals, represented as a circle, square, or triangle. Each data point represents the mean fold induction of three replicate LRA treatments of 1 × 10⁶ CD4+ T cells per individual. Error bars represent means ± SD from three individuals.
Fig. 4
Fig. 4. CD4-targeted LCNPs selectively activate CD4+ T cells from macaque PBMCs and accumulate in the draining LNs after subcutaneous injection to mouse left flank.
(A) Ing3A-LCNP (<150 nm) conjugated with anti-CD4 mAb, resulting in size distribution measured by NanoSight. DSPE, 1,2-distearoyl-sn-glycero-3-phosphoethanolamine; PEG, polyethylene glycol. (B) CD69 median fluorescence intensity (MFI) of CD4+ (CD14CD3+CD8) and CD8+ (CD14CD3+CD8+) cells (left) and their respective MFI ratio (right) from PBMCs isolated from pigtail macaque blood and treated with free Ing3A, bare LCNPs, CD4-targeted LCNPs, and Iso-LCNPs for 20 hours. The experiment was performed once with blood samples from three pigtail macaques (n = 3). (C) Schedule of injection and tissue harvest. C57BL/6J mice were injected with phosphate-buffered saline (PBS), DiR-loaded CD4-cbLCNPs, and Iso-cbLCNPs subcutaneously at the left flank and sacrificed at 20 hours, 3 days, and 7 days for analysis. (D) Representative fluorescent images of inguinal LNs, spleen (top), and other major organs at 20 hours, 3 days, and 7 days. (E) Region of interest quantification of tissue fluorescence normalized by tissue mass. Statistical significance was calculated using paired two-way ANOVA with Bonferroni’s test. **P < 0.005, ***P < 0.005, ****P < 0.0001. Data represent means ± SD; n = 3 mice per group. (Photo credit: Shijie Cao, Department of Bioengineering, University of Washington)
Fig. 5
Fig. 5. CD4-targeted LCNPs selectively activate CD4+ T cells in inguinal LNs after subcutaneous injection to mouse left flank and protect local tissues from toxicity.
(A) MFI of CD69 expression on CD4+ (CD14CD3+CD8) and CD8+ (CD14CD3+CD8+) cells from mouse left and right inguinal LNs. Mice were injected with 0.3 ml of PBS, 0.64% DMSO, Ing3A-CD4-cbLCNP (0.48 mg/kg; Ing3A dose per body weight), Ing3A-Iso-cbLCNP (0.48 mg/kg), or free Ing3A (0.48 or 0.024 mg/kg) and were sacrificed after 20 hours, 3 days, and 7 days for analysis. (B) Percentage of live cells from all cell populations in the left or right inguinal LNs after treatment. (C) Left: MFI of DiD fluorescent signal from CD4+ (CD14CD3+CD8), CD8+ (CD14CD3+CD8+), and CD14+ cells from mouse left or right inguinal LNs. Mice were injected subcutaneously at the left flank with 0.3 ml of PBS, DiD/CD4-cbLCNP, DiD/Iso-cbLCNP, or equivalent amount of free DiD (50 μg/kg; DiD dose per body weight) in PBS and were sacrificed after 20 hours for analysis. Right: MFI ratio of DiD fluorescent signal between CD4+ and CD8+ T cells. Statistical significance was calculated using paired two-way ANOVA with Bonferroni’s test comparing each treatment group with PBS. *P < 0.05, **P < 0.005, ***P < 0.0005, ****P < 0.0001. Data represent means ± SD; n = 3 mice per group. (D) Hematoxylin and eosin staining of tissue slides (left and right inguinal LNs and subcutaneous tissues near the injection site) from mice at day 3. From free Ing3A treatment group, condensed cell nucleus in the left LN that indicated cell death and immune cell infiltration into the adipose tissue near the injection site (red arrows) were observed.

Similar articles

Cited by

References

    1. Lorenzo-Redondo R., Fryer H. R., Bedford T., Kim E.-Y., Archer J., Kosakovsky Pond S. L., Chung Y.-S., Penugonda S., Chipman J. G., Fletcher C. V., Schacker T. W., Malim M. H., Rambaut A., Haase A. T., McLean A. R., Wolinsky S. M., Persistent HIV-1 replication maintains the tissue reservoir during therapy. Nature 530, 51–56 (2016). - PMC - PubMed
    1. Fletcher C. V., Staskus K., Wietgrefe S. W., Rothenberger M., Reilly C., Chipman J. G., Beilman G. J., Khoruts A., Thorkelson A., Schmidt T. E., Anderson J., Perkey K., Stevenson M., Perelson A. S., Douek D. C., Haase A. T., Schacker T. W., Persistent HIV-1 replication is associated with lower antiretroviral drug concentrations in lymphatic tissues. Proc. Natl. Acad. Sci. U.S.A. 111, 2307–2312 (2014). - PMC - PubMed
    1. Freeling J. P., Ho R. J. Y., Anti-HIV drug particles may overcome lymphatic drug insufficiency and associated HIV persistence. Proc. Natl. Acad. Sci. U.S.A. 111, E2512–E2513 (2014). - PMC - PubMed
    1. Eisele E., Siliciano R. F., Redefining the viral reservoirs that prevent HIV-1 eradication. Immunity 37, 377–388 (2012). - PMC - PubMed
    1. Barton K., Winckelmann A., Palmer S., HIV-1 reservoirs during suppressive therapy. Trends Microbiol. 24, 345–355 (2016). - PMC - PubMed

Publication types

MeSH terms