. 2019 Apr 3;9(1):5603.
doi: 10.1038/s41598-019-42130-z.

Glucosamine inhibits IL-1β expression by preserving mitochondrial integrity and disrupting assembly of the NLRP3 inflammasome

Affiliations

Glucosamine inhibits IL-1β expression by preserving mitochondrial integrity and disrupting assembly of the NLRP3 inflammasome

Hsiao-Wen Chiu et al. Sci Rep. .

Abstract

The NLRP3 inflammasome promotes the pathogenesis of metabolic, neurodegenerative and infectious diseases. Increasing evidences show that the NLRP3 inflammasome is a promising therapeutic target in inflammatory diseases. Glucosamine is widely used as a dietary supplement to promote the health of cartilage tissue and is expected to exert anti-inflammatory activity in joint inflammation, which is a nucleotide-binding oligomerization domain-like receptor containing pyrin domain 3 (NLRP3) inflammasome-associated complication. Here, we investigated whether GlcN inhibits the NLRP3 inflammasome and dissected the underlying molecular mechanisms. We found that GlcN suppressed the NLRP3 inflammasome in mouse and human macrophages. A mechanistic study revealed that GlcN inhibited the expression of NLRP3 and IL-1β precursor by reducing reactive oxygen species generation and NF-κB activation in lipopolysaccharide-activated macrophages. GlcN also suppressed mitochondrial reactive oxygen species generation and mitochondrial integrity loss in NLRP3-activated macrophages. Additionally, GlcN disrupted NLRP3 inflammasome assembly by inhibiting NLRP3 binding to PKR, NEK7 and ASC. Furthermore, oral administration of GlcN reduced peritoneal neutrophils influx and lavage fluids concentrations of IL-1β, IL-6 MCP-1 and TNF-α in uric acid crystal-injected mice. These results indicated that GlcN might be a novel dietary supplement for the amelioration of NLRP3 inflammasome-associated complications.


Conflict of interest statement

The authors declare no competing interests.

Figures
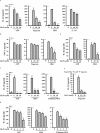
Figure 1
Figure 1
GlcN inhibits activation of the NLRP3 inflammasome. (A,B) J774A.1 macrophages were incubated for 4 h with LPS (1 µg/ml) followed by incubation for 2 h with GlcN. Cells were then incubated with ATP (5 mM, 0.5 h), nigericin (10 µM, 0.5 h), MSU (100 µg/ml, 24 h) or infected with E. coli (30 MOI, 1 h). The IL-1β (A) and TNF-α (B) expression levels in the supernatants were measured by ELISA. (CE) THP-1 macrophages (C,D) or PBMCs (E) were incubated for 4 h with LPS (1 µg/ml) followed by incubation for 2 h with GlcN, followed by incubation with ATP (5 mM, 0.5 h), MSU (100 µg/ml, 24 h) or palmitate-BSA (250 mM, 24 h). The IL-1β expression levels in the supernatants were measured by ELISA. (F) J774A.1 macrophages were incubated for 4 h with Pam3CSK4 (1 µg/ml) followed by incubation for 2 h with GlcN. Cells were then incubated with nigericin (10 µM) for 0.5 h. The IL-1β expression levels in the supernatants were measured by ELISA. The ELISA data are expressed as the means ± SD of separate experiments as indicated. *, **, *** and **** indicate a significant difference at the level of p < 0.05, p < 0.01, p < 0.001 and p < 0.0001, respectively, compared to NLRP3 activator-treated cells. (One-way ANOVA with Dunnett’s multiple comparisons test).
Figure 2
Figure 2
GlcN inhibits caspase-1 activation and the release of IL-1β, IL-18 and ASC. (AD) J774A.1 macrophages were incubated for 4 h with LPS (1 µg/ml) followed by incubation for 2 h with GlcN. Cells were then incubated with ATP (5 mM, 0.5 h) or infected with E. coli (30 MOI, 1 h). The expression levels of IL-1β and IL-18 (A), caspase-1 (C), ASC (D) in the supernatants and IL-1β in the cell lysates (B) were analysed by Western blotting. (E) J774A.1 macrophages were incubated for 4 h with LPS (1 µg/ml) followed by incubation for 2 h with GlcN, D-(+)-glucose (Glu), D-glucosamine 3-sulphate (GlcN-3S), D-(+)-galactosamine hydrochloride (GalN) and N-acetyl-D-glucosamine (GlcNAc) for 2 h, followed by incubation with ATP (5 mM) for 0.5 h. The IL-1β expression levels in the supernatants were measured by ELISA. (F) J774A.1 macrophages were incubated for 4 h with LPS (1 µg/ml) or PamsCSK4 (1 µg/ml; for non-canonical inflammasome) followed by incubation for 2 h with GlcN, followed by transfection with poly(dA/dT) (2 µg/ml) or LPS (2 µg/ml) for 6 h or by Salmonella infection (30 MOI) for 2 h. The IL-1β expression levels in the supernatants were measured by ELISA. The ELISA data are expressed as the mean ± SD of separate experiments as indicated. The Western blotting results are representative of three different experiments and the histogram shows the quantification expressed as the mean ± SD for these three experiments. *, *** and **** indicate a significant difference at the level of p < 0.05, p < 0.001 and p < 0.0001, respectively, compared to NLRP3 activator-treated cells. (One-way ANOVA with Dunnett’s multiple comparisons test). The blots in (AD) were cropped from different gels; full-length blots are included in the “Supplementary Information”.
Figure 3
Figure 3
GlcN inhibits K+ efflux-induced IL-1β secretion and reduces mitochondrial damage. (A) J774A.1 macrophages were incubated for 4 h with LPS (1 µg/ml) followed by incubation for 2 h with GlcN. Cells were then incubated with K+-free medium (2 h), NaCl medium (2 h) or nigericin (10 µM, 0.5 h). The IL-1β expression levels in the supernatants were measured by ELISA. (BD) J774A.1 macrophages were incubated for 4 h with LPS (1 µg/ml) followed by incubation for 2 h with GlcN or for 0.5 h with NAC. Cells were then incubated with ATP (5 mM) for 0.5 h. Mitochondrial damage was analysed by Mitotracker deep red and Mitotracker green staining (B) or DiOC2(3) staining (C), and mitochondrial ROS production was analysed by MitoSOX red staining (D). The data are expressed as the means ± SD of separate experiments as indicated. *, **, *** and **** indicate a significant difference at the level of p < 0.05, p < 0.01, p < 0.001 and p < 0.0001, respectively, compared to K+-free medium-, nigericin- or ATP-treated cells. (One-way ANOVA with Dunnett’s multiple comparisons test).
Figure 4
Figure 4
GlcN inhibits NLRP3 inflammasome assembly. (A,B) J774A.1 macrophages were incubated for 4 h with LPS (1 µg/ml) followed by incubation for 2 h with GlcN or 2-AP (0.5 mM). Cells were then incubated with ATP (5 mM) for 0.5 h. (A) The phosphorylation levels of PKR were measured by Western blotting. (B) PKR/NLRP3 complex formation was analysed by immunoprecipitation of NLPR3 and Western blotting against PKR. (C,D) J774A.1 macrophages were incubated for 4 h with LPS (1 µg/ml) followed by incubation for 2 h with GlcN (10 mM) or KCl (50 mM). Cells were then incubated with ATP (5 mM) for 0.5 h. (C) NEK7/NLRP3 and (D) ASC/NLRP3 complex formation was analysed by immunoprecipitation of NLPR3 and Western blotting against NEK7 and ASC, respectively. (E) J774A.1 macrophages were incubated for 4 h with LPS (1 µg/ml) followed by incubation for 2 h with GlcN. Cells were then incubated with ATP (5 mM) for 0.5 h. The cell lysates were crosslinked by disuccinimidyl suberate, and ASC oligomerization was measured by Western blotting. The Western blotting results are representative of three different experiments and the histogram shows the quantification expressed as the mean ± SD for these three experiments. *, **, *** and **** indicate a significant difference at the level of p < 0.05, p < 0.01, p < 0.001 and p < 0.0001, respectively, compared to ATP-treated cells. NS: not significant. (One-way ANOVA with Dunnett’s multiple comparisons test). The blots in this figure were cropped from different gels; full-length blots are included in the “Supplementary Information”.
Figure 5
Figure 5
GlcN inhibits the priming signal of the NLRP3 inflammasome. (A,B) J774A.1 macrophages were incubated with GlcN for 2 h, followed by incubation with LPS (1 µg/ml) (A) or Pam3CSK4 (1 µg/ml) (B) for 6 h. The expression levels of NLRP3 and proIL-1β were measured by Western blotting. (C) J774A.1 macrophages were incubated with GlcN for 2 h, followed by incubation with LPS (1 µg/ml) for 0.5 h. The expression levels of ROS were measured by CM-H2DCFDA staining N = 3. (D) NF-κB reporter cells were incubated with GlcN for 2 h, followed by incubation with LPS (1 µg/ml) for 24 h. The NF-κB transcriptional activity was assayed by the QUANTI-Blue method N = 4. (E) J774A.1 macrophages were incubated with GlcN (10 mM) for 2 h, followed by incubation with LPS (1 µg/ml) for 0–30 min. The expression levels of p-IκBα, IκBα, p-IKKα/β and IKKβ were measured by Western blotting. (F) J774A.1 macrophages were incubated with GlcN (10 mM) or PBS for 2 h, followed by incubation with LPS (1 µg/ml) for 0–60 min. The phosphorylation levels of MAPKs were measured by Western blotting. The Western blotting results are representative of three different experiments and the histogram shows the quantification expressed as the mean ± SD for these three experiments. *, **, *** and **** indicate a significant difference at the level of p < 0.05, p < 0.01, p < 0.001 and p < 0.0001, respectively, compared to LPS-treated cells (AD) or as indicated (E,F). (ANOVA with Dunn’s multiple comparisons test in AD; or two-tailed t test in E and F). The blots in (A), (B), (E) and (F) were cropped from different gels; full-length blots are included in the “Supplementary Information”.
Figure 6
Figure 6
GlcN inhibits the NLRP3 inflammasome in the mouse model of uric acid crystal-mediated peritonitis. (A) Peritoneal recruitment of neutrophils and total peritoneal lavage cells were measured by flow cytometry. (B) The peritoneal levels of IL-1β, IL-6, MCP-1 and TNF-α were measured by ELISA. Control group: N = 3; MSU group: N = 10; GlcN + MSU group: N = 10; Colchicine + MSU group: N = 8. *, **, *** and **** indicate a significant difference at the level of p < 0.05, p < 0.01, p < 0.001 and p < 0.0001, respectively, compared to MSU group. (One-way ANOVA with Dunnett’s multiple comparisons test).
Figure 7
Figure 7
Overview of the putative mechanisms by which GlcN attenuated the NLRP3 inflammasome.

Similar articles

Cited by

References

    1. Próchnicki T, Mangan MS, Latz E. Recent insights into the molecular mechanisms of the NLRP3 inflammasome activation. F1000Res. 2016;5:F1000 Faculty Rev–1469. doi: 10.12688/f1000research.8614.1. - DOI - PMC - PubMed
    1. Guo H, Callaway JB, Ting JP. Inflammasomes: mechanism of action, role in disease, and therapeutics. Nat Med. 2015;21:677–687. doi: 10.1038/nm.3893. - DOI - PMC - PubMed
    1. Yang SM, et al. Thrombomodulin domain 1 ameliorates diabetic nephropathy in mice via anti-NF-κB/NLRP3 inflammasome-mediated inflammation, enhancement of NRF2 antioxidant activity and inhibition of apoptosis. Diabetologia. 2014;57:424–434. doi: 10.1007/s00125-013-3115-6. - DOI - PubMed
    1. Ka SM, et al. Citral alleviates an accelerated and severe lupus nephritis model by inhibiting the activation signal of NLRP3 inflammasome and enhancing Nrf2 activation. Arthritis Res Ther. 2015;17:331. doi: 10.1186/s13075-015-0844-6. - DOI - PMC - PubMed
    1. Tsai YL, et al. NLRP3 inflammasome: Pathogenic role and potential therapeutic target for IgA nephropathy. Sci Rep. 2017;7:41123. doi: 10.1038/srep41123. - DOI - PMC - PubMed

Publication types

MeSH terms