

Application of long read sequencing to determine expressed antigen diversity in Trypanosoma brucei infections
- PMID: 30943202
- PMCID: PMC6464242
- DOI: 10.1371/journal.pntd.0007262
Application of long read sequencing to determine expressed antigen diversity in Trypanosoma brucei infections
Abstract
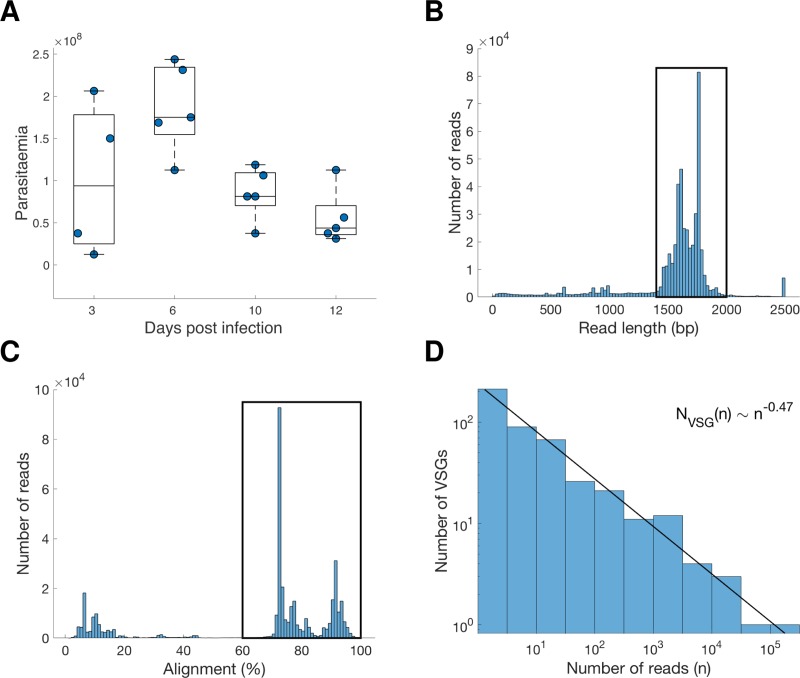
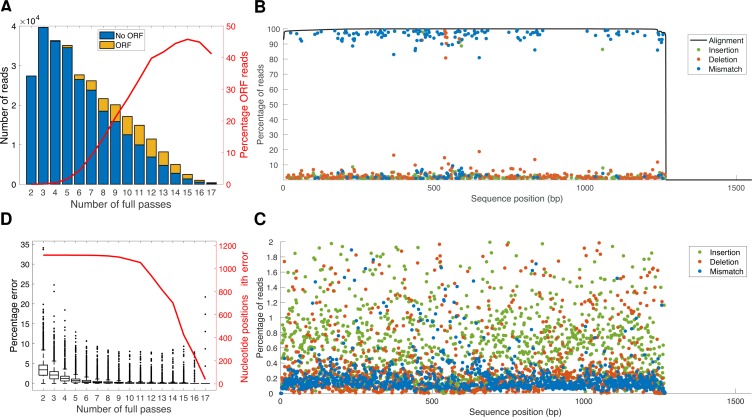
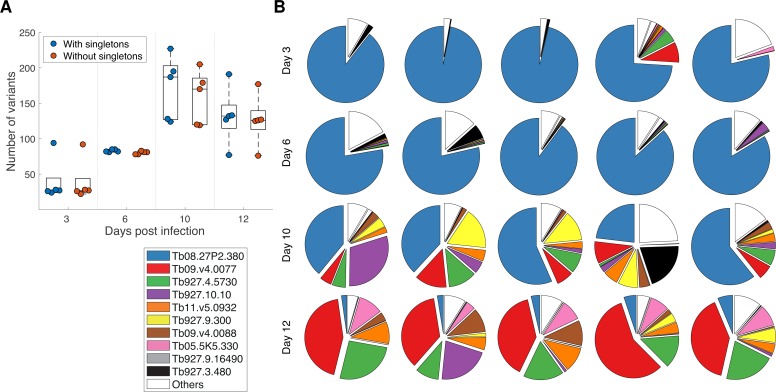
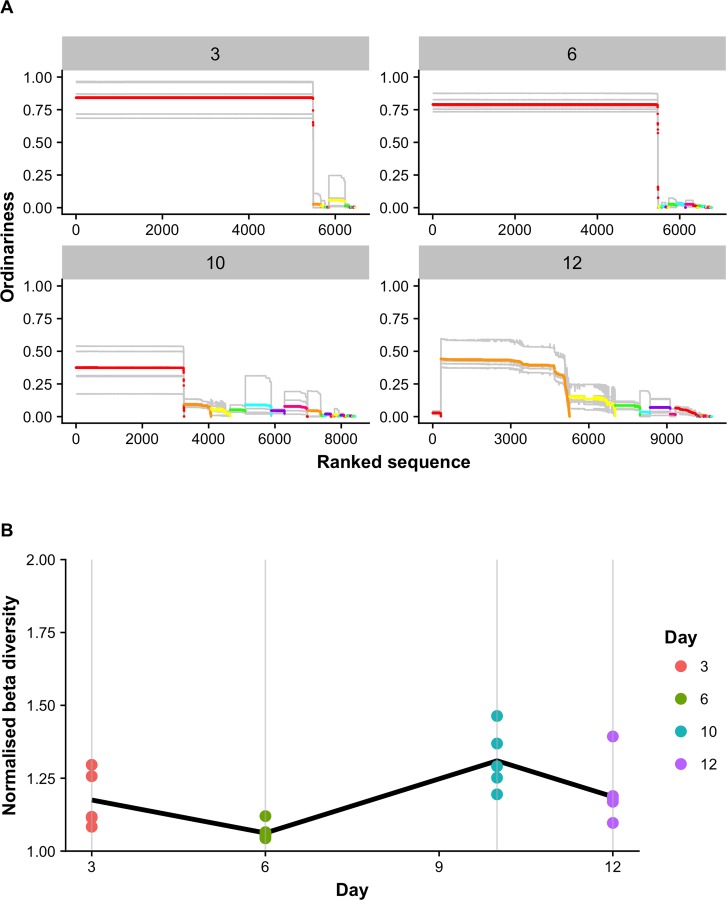
Antigenic variation is employed by many pathogens to evade the host immune response, and Trypanosoma brucei has evolved a complex system to achieve this phenotype, involving sequential use of variant surface glycoprotein (VSG) genes encoded from a large repertoire of ~2,000 genes. T. brucei express multiple, sometimes closely related, VSGs in a population at any one time, and the ability to resolve and analyse this diversity has been limited. We applied long read sequencing (PacBio) to VSG amplicons generated from blood extracted from batches of mice sacrificed at time points (days 3, 6, 10 and 12) post-infection with T. brucei TREU927. The data showed that long read sequencing is reliable for resolving variant differences between VSGs, and demonstrated that there is significant expressed diversity (449 VSGs detected across 20 mice) and across the timeframe of study there was a clear semi-reproducible pattern of expressed diversity (median of 27 VSGs per sample at day 3 post infection (p.i.), 82 VSGs at day 6 p.i., 187 VSGs at day 10 p.i. and 132 VSGs by day 12 p.i.). There was also consistent detection of one VSG dominating expression across replicates at days 3 and 6, and emergence of a second dominant VSG across replicates by day 12. The innovative application of ecological diversity analysis to VSG reads enabled characterisation of hierarchical VSG expression in the dataset, and resulted in a novel method for analysing such patterns of variation. Additionally, the long read approach allowed detection of mosaic VSG expression from very few reads-the earliest in infection that such events have been detected. Therefore, our results indicate that long read analysis is a reliable tool for resolving diverse gene expression profiles, and provides novel insights into the complexity and nature of VSG expression in trypanosomes, revealing significantly higher diversity than previously shown and the ability to identify mosaic gene formation early during the infection process.
Conflict of interest statement
The authors have declared that no competing interests exist.
Figures
Similar articles
-
VSGs Expressed during Natural T. b. gambiense Infection Exhibit Extensive Sequence Divergence and a Subspecies-Specific Bias towards Type B N-Terminal Domains.mBio. 2022 Dec 20;13(6):e0255322. doi: 10.1128/mbio.02553-22. Epub 2022 Nov 10. mBio. 2022. PMID: 36354333 Free PMC article.
-
The in vivo dynamics of antigenic variation in Trypanosoma brucei.Science. 2015 Mar 27;347(6229):1470-3. doi: 10.1126/science.aaa4502. Science. 2015. PMID: 25814582 Free PMC article.
-
Capturing the variant surface glycoprotein repertoire (the VSGnome) of Trypanosoma brucei Lister 427.Mol Biochem Parasitol. 2014 Jun;195(1):59-73. doi: 10.1016/j.molbiopara.2014.06.004. Epub 2014 Jun 30. Mol Biochem Parasitol. 2014. PMID: 24992042
-
A Host-Pathogen Interaction Reduced to First Principles: Antigenic Variation in T. brucei.Results Probl Cell Differ. 2015;57:23-46. doi: 10.1007/978-3-319-20819-0_2. Results Probl Cell Differ. 2015. PMID: 26537376 Review.
-
Evolution of the variant surface glycoprotein family in African trypanosomes.Trends Parasitol. 2022 Jan;38(1):23-36. doi: 10.1016/j.pt.2021.07.012. Epub 2021 Aug 7. Trends Parasitol. 2022. PMID: 34376326 Review.
Cited by
-
Stage-specific transcription activator ESB1 regulates monoallelic antigen expression in Trypanosoma brucei.Nat Microbiol. 2022 Aug;7(8):1280-1290. doi: 10.1038/s41564-022-01175-z. Epub 2022 Jul 25. Nat Microbiol. 2022. PMID: 35879525 Free PMC article.
-
The MRN complex promotes DNA repair by homologous recombination and restrains antigenic variation in African trypanosomes.Nucleic Acids Res. 2021 Feb 22;49(3):1436-1454. doi: 10.1093/nar/gkaa1265. Nucleic Acids Res. 2021. PMID: 33450001 Free PMC article.
-
Variant antigen diversity in Trypanosoma vivax is not driven by recombination.Nat Commun. 2020 Feb 12;11(1):844. doi: 10.1038/s41467-020-14575-8. Nat Commun. 2020. PMID: 32051413 Free PMC article.
-
Infections With Extracellular Trypanosomes Require Control by Efficient Innate Immune Mechanisms and Can Result in the Destruction of the Mammalian Humoral Immune System.Front Immunol. 2020 Mar 11;11:382. doi: 10.3389/fimmu.2020.00382. eCollection 2020. Front Immunol. 2020. PMID: 32218784 Free PMC article. Review.
-
Variable Surface Glycoprotein from Trypanosoma brucei Undergoes Cleavage by Matrix Metalloproteinases: An in silico Approach.Pathogens. 2019 Oct 8;8(4):178. doi: 10.3390/pathogens8040178. Pathogens. 2019. PMID: 31597256 Free PMC article.
References
-
- Turner C.M. and Barry J.D., High frequency of antigenic variation in Trypanosoma brucei rhodesiense infections. Parasitology, 1989. 99 Pt 1: p. 67–75. - PubMed
Publication types
MeSH terms
Substances
Grants and funding
- G0401553/MRC_/Medical Research Council/United Kingdom
- BB/J004227/1/BB_/Biotechnology and Biological Sciences Research Council/United Kingdom
- BBS/E/D/20002173/BB_/Biotechnology and Biological Sciences Research Council/United Kingdom
- BB/J004235/1/BB_/Biotechnology and Biological Sciences Research Council/United Kingdom
- BB/P004202/1/BB_/Biotechnology and Biological Sciences Research Council/United Kingdom
LinkOut - more resources
Full Text Sources
Molecular Biology Databases
