

PI3-kinase/Akt pathway-regulated membrane transportation of acid-sensing ion channel 1a/Calcium ion influx/endoplasmic reticulum stress activation on PDGF-induced HSC Activation
- PMID: 30938088
- PMCID: PMC6533492
- DOI: 10.1111/jcmm.14275
PI3-kinase/Akt pathway-regulated membrane transportation of acid-sensing ion channel 1a/Calcium ion influx/endoplasmic reticulum stress activation on PDGF-induced HSC Activation
Abstract
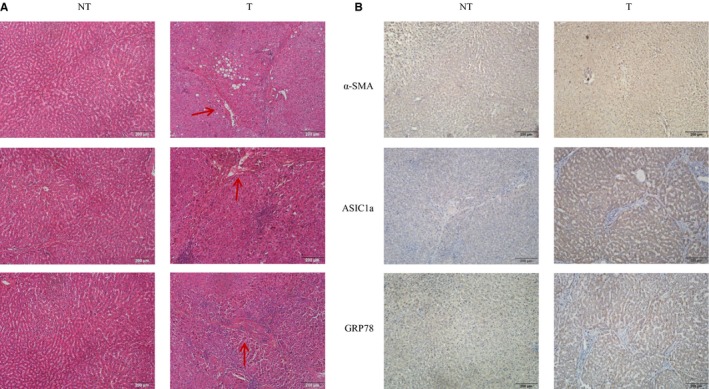
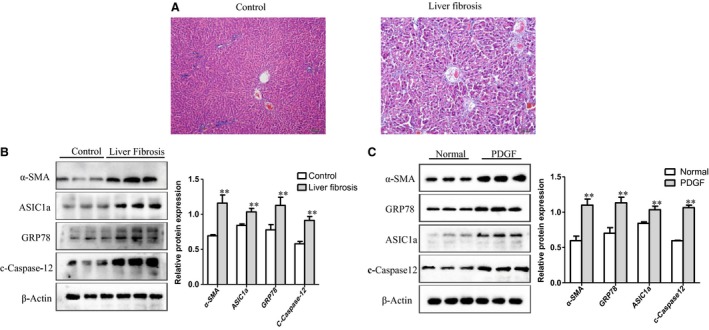
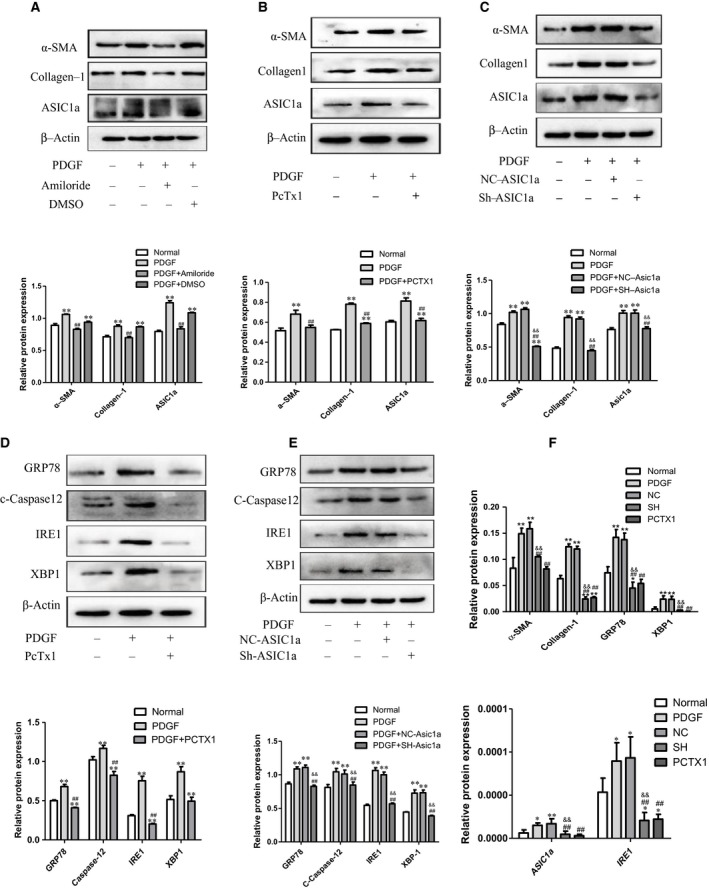
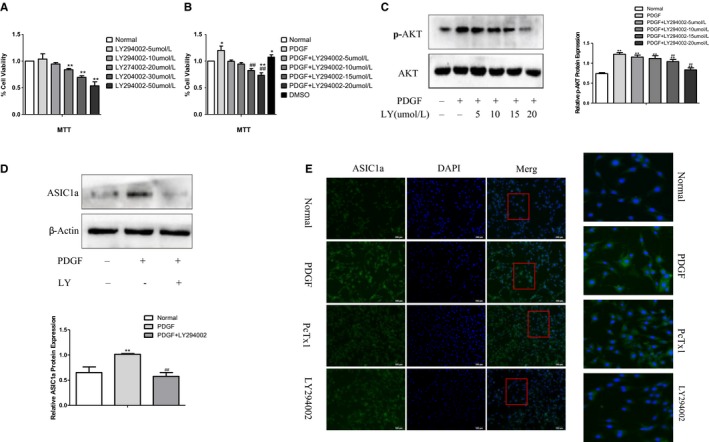
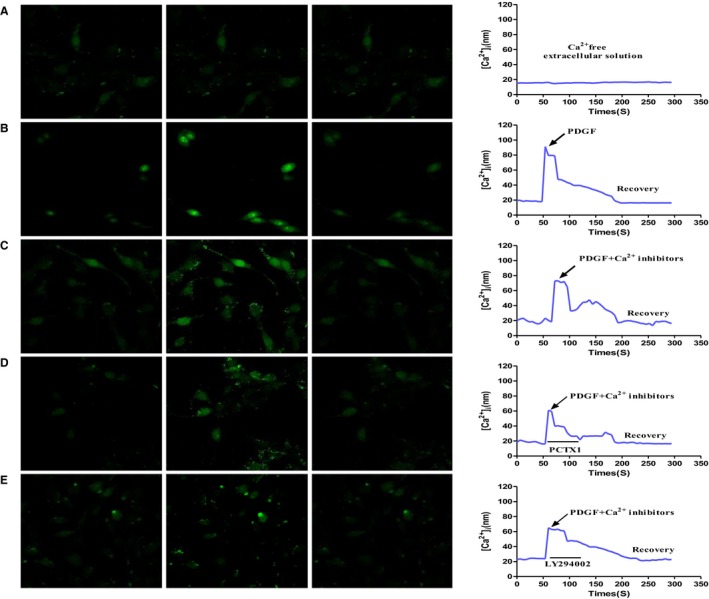
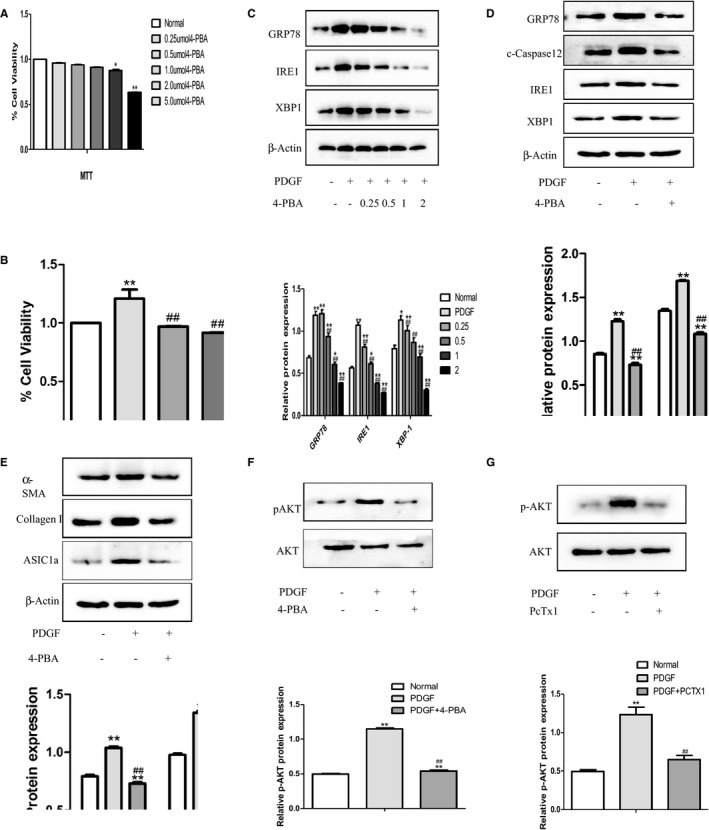
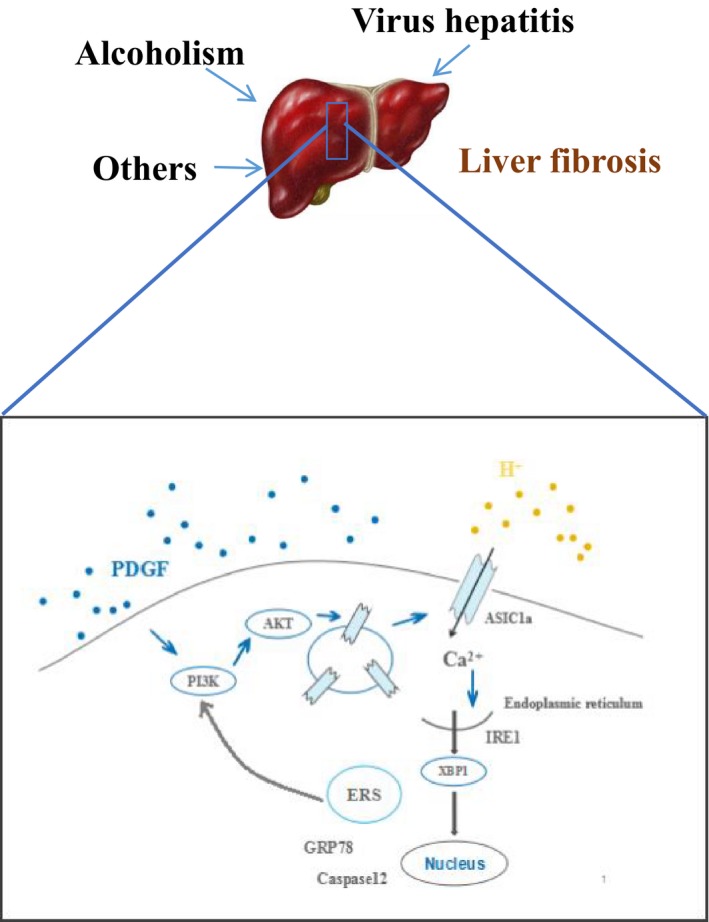
Acid-sensing ion channel 1a (ASIC1a) allows Na+ and Ca2+ flow into cells. It is expressed during inflammation, in tumour and ischaemic tissue, in the central nervous system and non-neuronal injury environments. Endoplasmic reticulum stress (ERS) is caused by the accumulation of misfolded proteins that interferes with intracellular calcium homoeostasis. Our recent reports showed ASIC1a and ERS are involved in liver fibrosis progression, particularly in hepatic stellate cell (HSC) activation. In this study, we investigated the roles of ASIC1a and ERS in activated HSC. We found that ASIC1a and ERS-related proteins were up-regulated in carbon tetrachloride (CCl4 )-induced fibrotic mouse liver tissues, and in patient liver tissues with hepatocellular carcinoma with severe liver fibrosis. The results show silencing ASIC1a reduced the expression of ERS-related biomarkers GRP78, Caspase12 and IREI-XBP1. And, ERS inhibition by 4-PBA down-regulated the high expression of ASIC1a induced by PDGF, suggesting an interactive relationship. In PDGF-induced HSCs, ASIC1a was activated and migrated to the cell membrane, leading to extracellular calcium influx and ERS, which was mediated by PI3K/AKT pathway. Our work shows PDGF-activated ASIC1a via the PI3K/AKT pathway, induced ERS and promoted liver fibrosis progression.
Keywords: ERS; PDGF; ASIC1a; HSCs; PI3K/AKT; liver fibrosis.
© 2019 The Authors. Journal of Cellular and Molecular Medicine published by John Wiley & Sons Ltd and Foundation for Cellular and Molecular Medicine.
Conflict of interest statement
The authors declare that they have no competing interests.
Figures
Similar articles
-
Inhibition of acid-sensing ion channel 1a in hepatic stellate cells attenuates PDGF-induced activation of HSCs through MAPK pathway.Mol Cell Biochem. 2014 Oct;395(1-2):199-209. doi: 10.1007/s11010-014-2125-0. Epub 2014 Jun 18. Mol Cell Biochem. 2014. PMID: 24939363
-
ASIC1a regulates miR-350/SPRY2 by N6 -methyladenosine to promote liver fibrosis.FASEB J. 2020 Nov;34(11):14371-14388. doi: 10.1096/fj.202001337R. Epub 2020 Sep 19. FASEB J. 2020. PMID: 32949431
-
ASIC1a regulates ferroptosis in hepatic stellate cells via the Hippo/Yap-1 pathway in liver fibrosis.Int Immunopharmacol. 2024 Dec 25;143(Pt 1):113226. doi: 10.1016/j.intimp.2024.113226. Epub 2024 Sep 30. Int Immunopharmacol. 2024. PMID: 39353388
-
Human diet-derived polyphenolic compounds and hepatic diseases: From therapeutic mechanisms to clinical utilization.Phytother Res. 2024 Jan;38(1):280-304. doi: 10.1002/ptr.8043. Epub 2023 Oct 23. Phytother Res. 2024. PMID: 37871899 Review.
-
Akt as a target for cancer therapy: more is not always better (lessons from studies in mice).Br J Cancer. 2017 Jul 11;117(2):159-163. doi: 10.1038/bjc.2017.153. Epub 2017 May 30. Br J Cancer. 2017. PMID: 28557977 Free PMC article. Review.
Cited by
-
Targeting Hepatic Stellate Cells for the Treatment of Liver Fibrosis by Natural Products: Is It the Dawning of a New Era?Front Pharmacol. 2020 Apr 30;11:548. doi: 10.3389/fphar.2020.00548. eCollection 2020. Front Pharmacol. 2020. PMID: 32425789 Free PMC article. Review.
-
Selenoprotein K deficiency-induced apoptosis: A role for calpain and the ERS pathway.Redox Biol. 2021 Nov;47:102154. doi: 10.1016/j.redox.2021.102154. Epub 2021 Sep 29. Redox Biol. 2021. PMID: 34601426 Free PMC article.
-
Acid-sensing ion channels and downstream signalling in cancer cells: is there a mechanistic link?Pflugers Arch. 2024 Apr;476(4):659-672. doi: 10.1007/s00424-023-02902-z. Epub 2024 Jan 4. Pflugers Arch. 2024. PMID: 38175291 Free PMC article. Review.
-
Endoplasmic reticulum stress caused by traumatic injury promotes cardiomyocyte apoptosis through acetylation modification of GRP78.Acta Biochim Biophys Sin (Shanghai). 2024 Jan 25;56(1):96-105. doi: 10.3724/abbs.2023277. Acta Biochim Biophys Sin (Shanghai). 2024. PMID: 38105649 Free PMC article.
-
Activin A plays an essential role in migration and proliferation of hepatic stellate cells via Smad3 and calcium signaling.Sci Rep. 2024 Sep 3;14(1):20419. doi: 10.1038/s41598-024-71304-7. Sci Rep. 2024. PMID: 39223291 Free PMC article.
References
-
- Waldmann R, Champigny G, Bassilana F, Heurteaux C, Lazdunski M. A proton‐gated cation channel involved in acid‐sensing. Nature. 1997;386:173‐177. - PubMed
Publication types
MeSH terms
Substances
LinkOut - more resources
Full Text Sources
Medical
Miscellaneous
