. 2019 Apr 22;29(8):1273-1285.e5.
doi: 10.1016/j.cub.2019.02.061. Epub 2019 Mar 28.

Induction of a Spindle-Assembly-Competent M Phase in Xenopus Egg Extracts

Affiliations

Induction of a Spindle-Assembly-Competent M Phase in Xenopus Egg Extracts

Jitender S Bisht et al. Curr Biol. .

Abstract

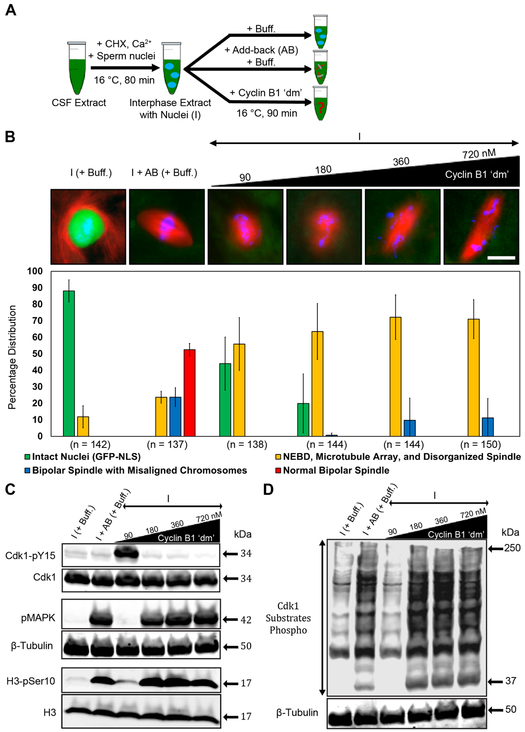
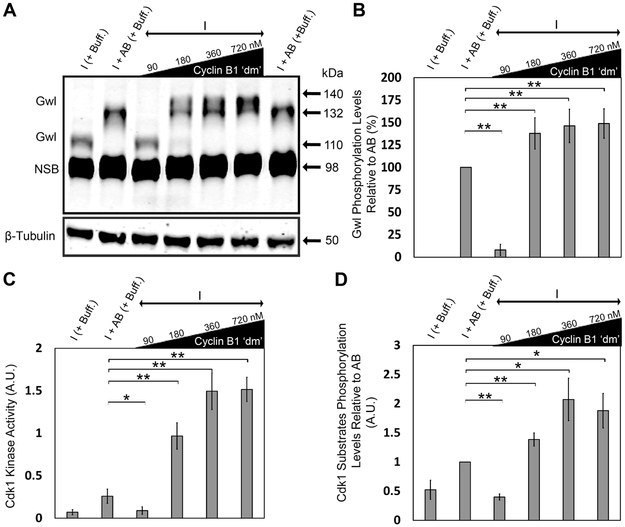
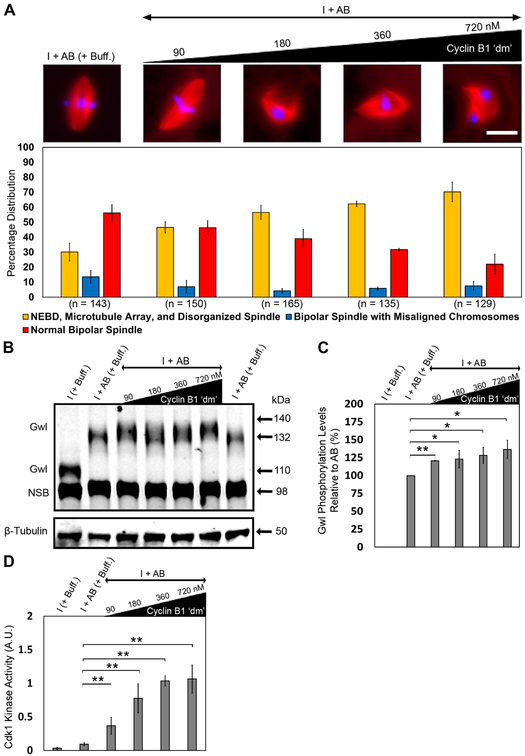
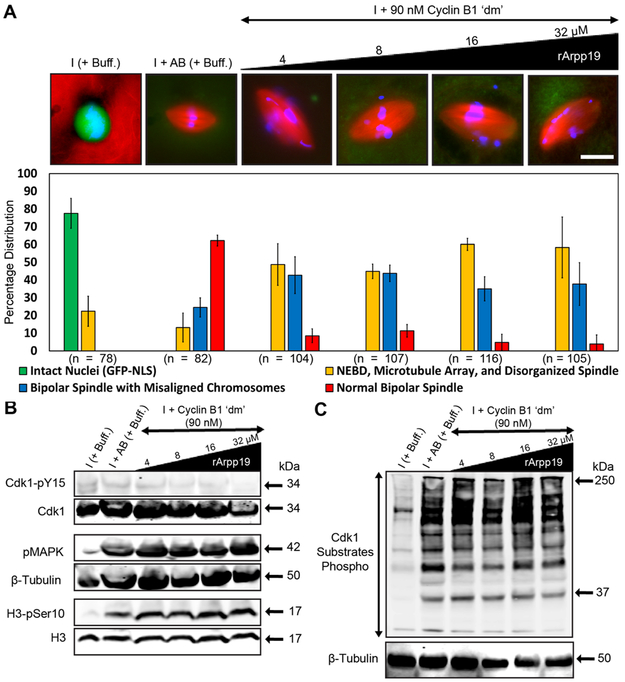
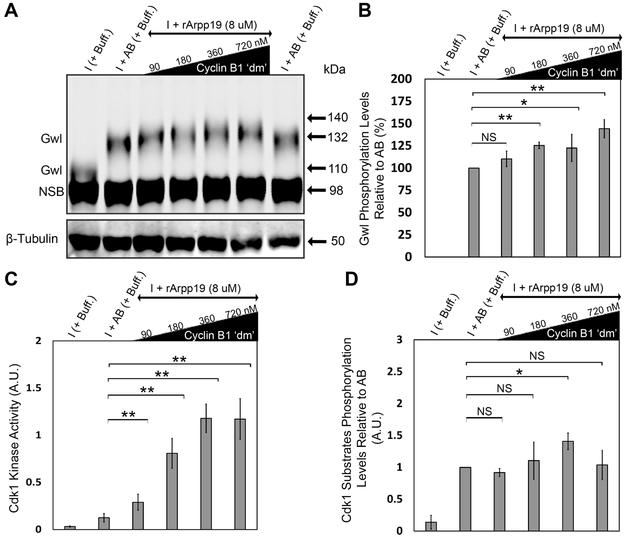
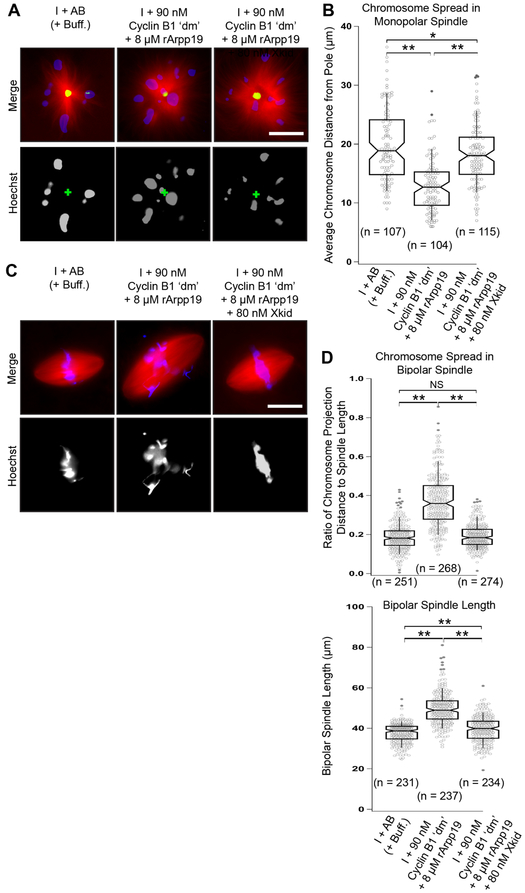
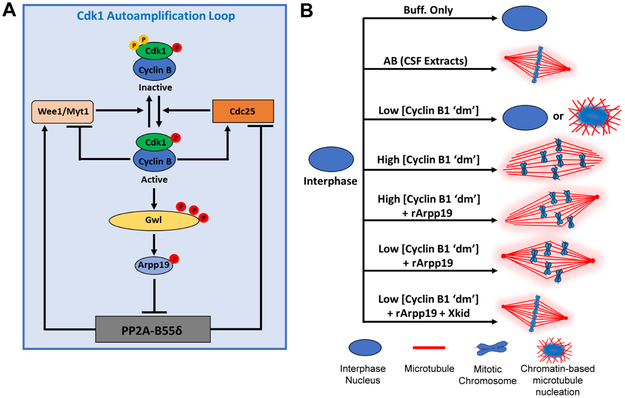
Normal mitotic spindle assembly is a prerequisite for faithful chromosome segregation and unperturbed cell-cycle progression. Precise functioning of the spindle machinery relies on conserved architectural features, such as focused poles, chromosome alignment at the metaphase plate, and proper spindle length. These morphological requirements can be achieved only within a compositionally distinct cytoplasm that results from cell-cycle-dependent regulation of specific protein levels and specific post-translational modifications. Here, we used cell-free extracts derived from Xenopus laevis eggs to recapitulate different phases of the cell cycle in vitro and to determine which components are required to render interphase cytoplasm spindle-assembly competent in the absence of protein translation. We found that addition of a nondegradable form of the master cell-cycle regulator cyclin B1 can indeed induce some biochemical and phenomenological characteristics of mitosis, but cyclin B1 alone is insufficient and actually deleterious at high levels for normal spindle assembly. In contrast, addition of a phosphomimetic form of the Greatwall-kinase effector Arpp19 with a specific concentration of nondegradable cyclin B1 rescued spindle bipolarity but resulted in larger-than-normal bipolar spindles with a misalignment of chromosomes. Both were corrected by the addition of exogenous Xkid (Xenopus homolog of human Kid/KIF22), indicating a role for this chromokinesin in regulating spindle length. These observations suggest that, of the many components degraded at mitotic exit and then replenished during the subsequent interphase, only a few are required to induce a cell-cycle transition that produces a spindle-assembly-competent cytoplasm.

Keywords: Greatwall kinase; M phase; Xenopus egg extract; cell cycle; chromokinesin; cyclin; mitosis; spindle assembly.


Figures

Figure 1.
Figure 1.. Addition of cyclin B1 ‘dm’ to interphase extract induces mitosis but not normal spindle assembly.
A) Schematic diagram of the experimental protocol. The interphase and add back (AB) control conditions were diluted with 1× PBS buffer (Buff.) equivalent to the maximum volume of recombinant protein(s) added to the interphase extract. See also STAR Methods. B) Immunofluorescence images showing the most abundant structure assembled under the indicated conditions and labeled with Alexa Fluor 568–conjugated tubulin antibody to stain microtubules (red), Hoechst to stain chromosomes (blue), and GST-GFP-NLS to stain intact nuclei (green). Graph shows quantification of the percent of intact nuclei and/or chromatin associated microtubule-based structures assembled during interphase and mitosis for each of the conditions. Error bars represent standard deviation. n = number of nuclei and structures counted for each condition. C, D) Western blot analyses using antibodies against known mitotic markers and respective loading control markers. Labels on the left of blot images indicate the antibody epitopes. Data were taken from a minimum of three different extracts and blots shown are representative of three blots from independent extracts. See also Figure S5.
Figure 2.
Figure 2.. High levels of cyclin B1 ‘dm’ result in hyperphosphorylation of Gwl kinase and increases in Cdk1 kinase activity and Cdk1 substrates phosphorylation levels relative to add-back control.
A) Gwl phosphorylation levels under different conditions. B) Quantification of Gwl phosphorylation levels as a measure of the densitometric center of mass of the upper Gwl band (at ~135 kDa) along the vertical y-axis relative to that of the add-back control band (at ~132 kDa). C) Quantification of Cdk1 kinase activity as a measure of its ability to phosphorylate synthetic peptide substrate (using MESACUP Cdk1 Kinase Assay Kit) in different conditions. D) Quantification of the Cdk1 substrates phosphorylation levels in different conditions normalized to β-tubulin. Error bars represent standard deviation. Data were taken from a minimum of three different extracts and blots shown are representative of three blots from independent extracts. NSB, non-specific band. NS, not significant (p > 0.05), *p < 0.05, and **p < 0.005, as determined using the Student’s t-test. See also Figures S1 and S5.
Figure 3.
Figure 3.. Excess cyclin B1 ‘dm’ is deleterious for normal spindle assembly in the add-back condition.
A) Immunofluorescence images showing the most abundant structure assembled under indicated conditions and labeled with Alexa Fluor 568–conjugated tubulin to stain microtubules (red) and Hoechst to stain chromosomes (blue). Graph shows quantification of the percent of chromatin associated microtubule-based structures assembled during mitosis for each of the conditions. Error bars represent standard deviation. Scale bar represents 20 μm. n = number of nuclei and structures counted for each condition. B) Extract samples from different conditions were subjected to western blotting using antibodies against Gwl. C) Quantification of Gwl phosphorylation levels as a measure of the densitometric center of mass of the upper Gwl band (at ~135 kDa) along the vertical axis relative to that of the add-back control band (at ~132 kDa). D) Quantification of Cdk1 kinase activity as a measure of its ability to phosphorylate synthetic peptide substrate (using MESACUP Cdk1 Kinase Assay Kit; see Experimental Procedures) under the indicated experimental conditions. Error bars represent standard deviation. Data were taken from a minimum of three different extracts and blots shown are representative of three blots from independent extracts. NSB, non-specific band. NS, not significant (p > 0.05), *p < 0.05, and **p < 0.005, as determined using the Student’s t-test. See also Figure S1.
Figure 4.
Figure 4.. rArpp19 with a low cyclin B1 ‘dm’ concentration induces mitosis and generates bipolar spindles with defects in length and chromosome alignment.
A) Immunofluorescence images showing the most abundant structure assembled under the indicated conditions and labeled with Alexa Fluor 568–conjugated tubulin to stain microtubules (red), Hoechst to stain chromosomes (blue), and GST-GFP-NLS to stain intact nuclei (green). Graph shows quantification of the percent of intact nuclei and/or chromatin associated microtubule-based structures assembled during interphase and mitosis for each of the conditions. Error bars represent standard deviation. n = number of nuclei and structures counted for each condition. B, C) Extract samples from different conditions were subjected to western blotting using specific antibodies against mitotic markers and respective loading control markers. Labels on the left of blot images indicate the antibody epitopes. Data were taken from a minimum of three different extracts and blots shown are representative of three blots from independent extracts. See also Figures S2, S3, S4, and S6.
Figure 5.
Figure 5.. A low concentration of cyclin B1 ‘dm’ together with rArpp19 results in the reduction of Gwl kinase hyperphosphorylation and decreases in Cdk1 kinase activity and Cdk1 substrates phosphorylation levels.
A) Western blot analysis showing Gwl phosphorylation levels under the indicated experimental conditions. B) Quantification of Gwl phosphorylation levels as a measure of the densitometric center of mass of the upper Gwl band (at ~135 kDa) along the vertical axis relative to that of the add-back control band (at ~132 kDa). C) Quantification of Cdk1 kinase activity as a measure of its ability to phosphorylate synthetic peptide substrate (using MESACUP Cdk1 Kinase Assay Kit; see Experimental Procedures) under the indicated experimental conditions. D) Densitometric quantification of the Cdk1 substrates phosphorylation levels under different conditions normalized to β-tubulin loading controls. Error bars represent standard deviation. Data were taken from a minimum of three different extracts and blots shown are representative of three blots from independent extracts. NSB, non-specific band. NS, not significant (p > 0.05), *p < 0.05, and **p < 0.005, as determined using the Student’s t-test. See also Figures S1, S4, and S5.
Figure 6.
Figure 6.. Xkid is sufficient to rescue both chromosome misalignment and normal spindle length.
A) Immunofluorescence images showing representative monopolar spindles (induced by addition of the Eg5 inhibitor s-trytl-l-cysteine (STLC)) labeled with Alexa Fluor 488–conjugated anti-NuMA (green), Hoechst to stain chromosomes (blue), and Alexa Fluor 568–conjugated tubulin to stain microtubules (red). B) Quantification of the chromosome spread. Plots show measures of the distance between each monopolar spindle pole and chromosome center. For each boxplot, the top and bottom edges represent the 75th and 25th quartile boundaries, respectively. Whiskers extend to the 91st and 9th quartiles. Center lines represent median values, and notch widths correspond to 95% confidence intervals. n = the number of individual measurements of chromosome-to-pole distance made for each condition. C) Immunofluorescence images of assembled bipolar spindles labeled with Alexa Fluor 568–conjugated tubulin to stain microtubules (red) and Hoechst to stain chromosomes (blue). D) Quantification of the chromosome spread and spindle length of bipolar spindles under different conditions. Boxplot characteristics are as in B. n = the number of bipolar spindles examined. Data were gathered from a minimum of three different extracts. NS, not significant (p > 0.05), *p < 0.05, and **p < 0.005, as determined using the Student’s t-test. See also Figures S6 and S7.
Figure 7.
Figure 7.. Cdk1 autoamplification loop and summary of spindle assembly phenotypes.
A) Schematic illustration of Cdk1 autoamplification loop. B) Cartoon summary describing reconstitution of spindle assembly under the experimental conditions indicated.

Similar articles

Cited by

References

    1. Peters JM (2006). The anaphase promoting complex/cyclosome: a machine designed to destroy. Nat Rev Mol Cell Biol 7, 644–656. - PubMed
    1. Murray AW, Solomon MJ, and Kirschner MW (1989). The role of cyclin synthesis and degradation in the control of maturation promoting factor activity. Nature 339, 280–286. - PubMed
    1. Nurse P (1990). Universal control mechanism regulating onset of M-phase. Nature 344, 503–508. - PubMed
    1. Pines J, and Hunter T (1990). Human cyclin A is adenovirus E1A-associated protein p60 and behaves differently from cyclin B. Nature 346, 760–763. - PubMed
    1. Boekhout M, and Wolthuis R (2015). Nek2A destruction marks APC/C activation at the prophase-to-prometaphase transition by spindle-checkpoint-restricted Cdc20. J Cell Sci 128, 1639–1653. - PubMed

Publication types

MeSH terms

LinkOut - more resources