. 2019 Apr 26:14:47-57.
doi: 10.1016/j.isci.2019.03.011. Epub 2019 Mar 15.

Biased Signaling of the Mu Opioid Receptor Revealed in Native Neurons

Affiliations

Biased Signaling of the Mu Opioid Receptor Revealed in Native Neurons

Aliza T Ehrlich et al. iScience. .

Abstract

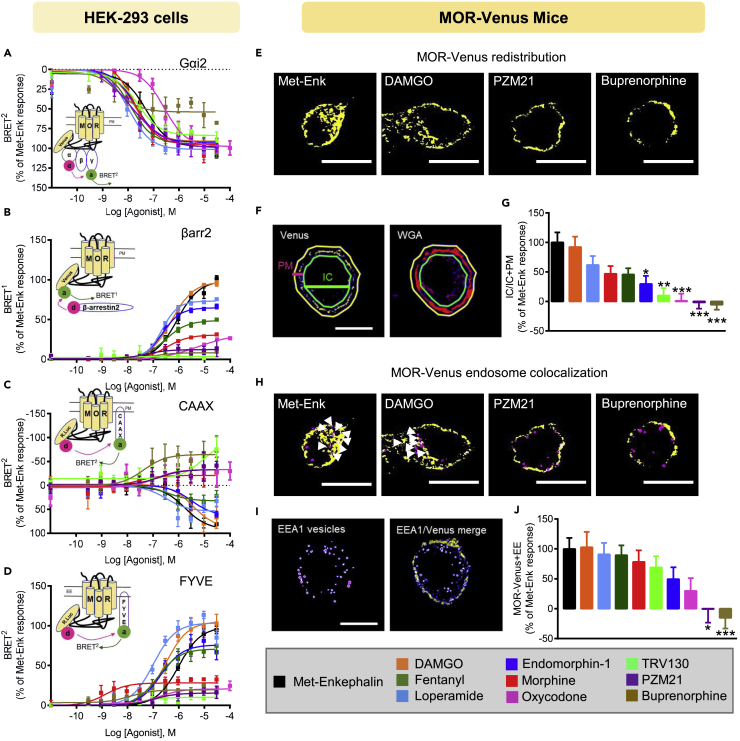
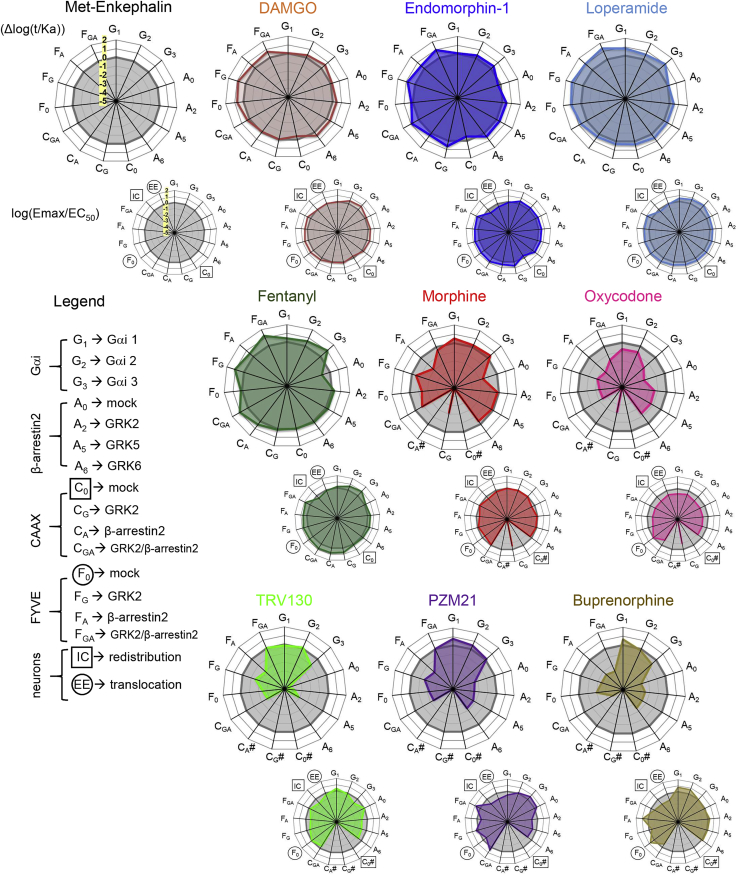
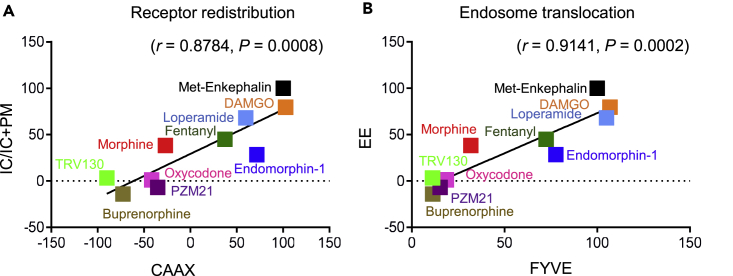
G protein-coupled receptors are key signaling molecules and major targets for pharmaceuticals. The concept of ligand-dependent biased signaling raises the possibility of developing drugs with improved efficacy and safety profiles, yet translating this concept to native tissues remains a major challenge. Whether drug activity profiling in recombinant cell-based assays, traditionally used for drug discovery, has any relevance to physiology is unknown. Here we focused on the mu opioid receptor, the unrivalled target for pain treatment and also the key driver for the current opioid crisis. We selected a set of clinical and novel mu agonists, and profiled their activities in transfected cell assays using advanced biosensors and in native neurons from knock-in mice expressing traceable receptors endogenously. Our data identify Gi-biased agonists, including buprenorphine, and further show highly correlated drug activities in the two otherwise very distinct experimental systems, supporting in vivo translatability of biased signaling for mu opioid drugs.

Keywords: Bioengineering; Biological Sciences; Cell Biology; Molecular Biology; Neuroscience; Physiology.


Figures

None
Graphical abstract
Figure 1
Figure 1
Experimental Strategy and Receptor/Effector Tools (A) Overview of the two experimental systems (left, transfected biosensors in HEK293 cells; right, knock-in mice expressing MOR-Venus at endogenous levels in place of the native receptor), structure of the 10 MOR agonists tested in the study, assays developed for each experimental system. (B–H) Functional characterization of MOR-Venus in HEK293 cells (B and C) and in vivo (D–H). (B) On top, schematic representation of the Gαi1/Gγ2-BRET2 biosensor assay. Upon ligand binding to the receptor, Gαi1-RlucII (d, donor) dissociates from the βγ-GFP10 (a, acceptor) dimer, which results in a decrease in BRET2 signal. Data are expressed as % of BRET signal for MOR (untagged), four replicate experiments. (C) G protein activation profile for MOR and MOR-Venus. On top, schematic representation of the pan Gγ/GRK-based BRET2 assay, Gγ3-RlucII (d, donor), and GRK2-GFP10 (a, acceptor). Upon ligand binding to the receptor, the Gα subunit dissociates from the βγ-RlucII dimer allowing recruitment of GRK2-GFP10 increasing the BRET2 signal. BRET2 was measured 10 min after stimulation with 30 μM Met-Enk. Mock shows MOR-mediated activation of endogenous G proteins. Data are expressed as percentage mock response (n = 3–5 independent experiments, one-way ANOVA). (D) There was no difference in G protein signaling in the striatum of MOR and MOR-Venus mice. [S35] GTPyS incorporation in striatal membranes prepared from MOR+/+(wild-type controls), MORVenus/+ (heterozygous knock-in), and MORVenus/Venus (homozygous knock-in) mouse littermates, in response to increasing DAMGO concentrations. Data are expressed as mean % activation ± SEM of [S35] GTPyS binding above basal (no agonist) level (3–4 independent experiments with duplicates). Two-way ANOVA found no difference of drug effects across genotypes. (E) MOR+/+ and MORVenus/Venus injected with morphine (40 mg/kg i. p.) or saline show similar locomotor responses (10-min bins). Data are expressed as the distance traveled in centimeters (n = 5–6/group, two-way ANOVA, significant drug effect, no genotype effect). (F) Morphine analgesia is intact in MOR and MOR-Venus mice. Animals were injected with morphine (5 or 10 mg/kg intraperitoneally) or saline. Left, analgesia in the hot plate test, measured by latency to lick the hind paw (n = 3–4/group, two-way ANOVA, significant drug effect at 10 mg/kg, no genotype effect). Right, analgesia in the tail immersion test (52°C), measured by tail withdrawal latency (n = 3–4/group, two-way ANOVA, significant drug effect at 5 and 10 mg/kg, no genotype effect). Cutoff to be removed from the test (10 s) is indicated by a broken line. (G) Whole-brain mapping of MOR-Venus expression (quantification in Table S1). The scheme shows an overview of MOR-Venus distribution in soma (blue), fibers (green), or both (gold) across brain areas enriched for the receptor. MH, medial habenula; fr, fasiculus retroflexus; IPN, interpeduncular nucleus; CP, caudate putamen; PVT, paraventricular thalamus; PB, parabrachial nucleus. (H) Sections of MOR-Venus dorsal root ganglia (DRG) detect MOR either directly (intrinsic, Venus fluorescence) or using Venus amplification (anti-Venus antibody, amplified). All data in (B–F) are presented as mean ± SEM. Statistical significance is defined as *p < 0.05, **p < 0.01, ***p < 0.001.
Figure 2
Figure 2
Profiling MOR Agonists in the Two Experimental Systems (A–J) Data obtained from HEK293 cells overexpressing MOR-Venus (A–D) and DRG neurons from MOR-Venus mice (E–J). (A) Gαi2 responses in HEK293 cells. On top, schematic representation of the Gαi2/Gγ2-BRET2 biosensor assay with BRET2 sensors (Gαi2-RlucII, d, donor; Gγ2-GFP10, a, acceptor). Cells were stimulated 10 min with increasing concentrations of the indicated compound. Data are expressed as % of Met-Enk response n = 3–7 independent experiments. (B) βarr2 recruitment in HEK293 cells. On top, schematic representation of the MOR/βarr2 BRET1 biosensor assay. Upon activation, RlucII-tagged βarr2 (d, donor) is recruited to MOR-Venus (a, acceptor), resulting in increased BRET1signal. Cells were stimulated 10 min with increasing concentrations of the indicated compound. Data are expressed as mean % of the maximal response induced by Met-Enk (n = 4–9 independent experiments). (C) Receptor internalization in HEK293 cells. On top, schematic representation of the MOR/CAAX BRET2 biosensor assay, used to monitor receptor disappearance from the plasma membrane (PM). MOR-RlucII is the donor (d), and rGFP-tagged CAAX is the acceptor (a). HEK293 cells were exposed to increasing concentrations of MOR agonists for 30 min. Data are expressed as % of Met-Enk response (4–7 independent experiments). (D) Receptor translocation to endosomes in HEK293 cells. On top, schematic representation of MOR/FYVE BRET2 biosensor assay, used to monitor receptor translocation to early endosomes (EE). MOR-RlucII is the donor (d), and rGFP-tagged FYVE is the acceptor (a). HEK293 cells were exposed to increasing concentrations of MOR agonists for 30 min. Data are expressed as mean % of the maximal response induced by Met-Enk (n = 4–7 independent experiments). (E–G) Receptor redistribution in DRG neurons. (E) DRG neurons from adult MOR-Venus mice were dissociated and exposed to 1 μM MOR agonist for 10 min. Representative confocal images are shown after thresholding (see Transparent Methods) and reveal MOR-Venus redistribution to intracellular compartments for Met-Enk and DAMGO (left panel) but not PZM21 and buprenorphine (two right panels). Scale bar, 10 μm. (F) Quantification method. A vehicle-treated neuron illustrates the method used to quantify MOR-Venus redistribution in neurons (anti-Venus antibody; left, yellow, plasma membrane (PM) label; WGA-Alexa594, right, red). PM and intracellular (IC) compartments were defined by drawing regions of interest (PM, yellow outer line; IC, green inner line). Fluorescence intensity was measured in the two compartments, quantified as IC/total (IC + PM), and vehicle was subtracted. (G) MOR-Venus redistribution following treatment with the 10 MOR compounds. Data are expressed as %IC/IC + PM of the Met-Enk response (n = 26–52 cells per drug condition). (H–J) Receptor co-localization to early endosomes (EEs) in DRG neurons. (H) Representative confocal images show MOR-Venus DRG neurons exposed to 1 μM MOR agonist for 10 min and immunostained to amplify MOR-Venus (anti-Venus antibody, yellow) and label EEs (anti-EEA1 antibody, magenta). Met-Enk and DAMGO (left panel), but not PZM21 and buprenorphine (2 right panels), increases MOR-Venus/EE co-localization. Scale bar, 10 μm; white arrowheads locate double-positive MOR-Venus/EEA1 vesicles. (I) Quantification method. A vehicle-treated cell illustrates the method of quantification in the EE assay. Confocal images were thresholded (see Transparent Methods), and individual vesicles were outlined as ROI using the EEA1 channel. ROI were then counted in either EEA1 or Venus channels to determine the number of EEA1 vesicles containing MOR-Venus. (J) MOR-Venus co-localization with EEs following treatment with the 10 MOR compounds. Data are expressed as % of Met-Enk response (n = 26–42 cells per drug condition). All data in (A–D), (G), and (J) are shown as mean ± SEM. Statistical significance of the differences (G and J, one-way ANOVA) is defined as *p < 0.05, **p < 0.01, ***p < 0.001 versus Met-Enk condition.
Figure 3
Figure 3
Buprenorphine Stands Out among 10 Signatures of MOR Agonists Radial graphs illustrating the specific activity signature (see Transparent Methods) for each drug (colored line) compared with Met-Enk (gray line). Upper radial plots: dose-response curves for the HEK293 cell data were used to derive the logarithm of the “transduction coefficients” (Δlog(τ/Ka)) to integrate efficacy (τ) and affinity (Ka). Lower radial plots integrate single concentration effect in neurons and dose-response effects in HEK293 cell data as follows: dose-response curves were used to fit HEK293 cell data into an Emax/EC50 ratio to estimate signaling efficacy, whereas the neuronal (DRG) data (Figure 2G or 2J), where all drug treatments were done at submaximal dose (Figure S8B), were normalized as ((compound/Met-Enkephalin)-Met-Enkephalin), thus Met-Enkephalin response is set to 0. For both HEK293 cells and native neurons positive and negative values denote a better or a lower response when compared with Met-Enkephalin. Top left, the scale is highlighted in yellow on the reference Met-Enk radial plot (min −5 to max 2 with intervals of 1). The legend indicates the assay abbreviations. # Indicates a drug effect that was too low or could not be fitted to the operational model.
Figure 4
Figure 4
MOR Trafficking Is a Suitable Readout for Ligand-Dependent Activities Pearson correlation analysis was used to examine the compatibility of trafficking responses for the 10 MOR compounds in two distinct systems. The best comparable assays between transfected MOR-Venus and native MOR-Venus systems were CAAX or FYVE biosensors in HEK293 cells with receptor redistribution to intracellular (IC) or early endosome (EE) compartment assays in DRG neurons. Dose-response curves (Figures 2C and 2D) were used to derive Emax values in % of Met-Enkephalin (Met-Enk) from HEK293 cells, and sub-maximal dose neuronal data in % of Met-Enk (Figures 2G and 2J) were used for correlation. (A) Positive correlation between receptor redistribution in DRG neurons (IC + IC/PM) and HEK293 cell (MOR-Rluc/rGFP-CAAX) assays (Pearson correlation: r = 0.8784, p = 0.0008). (B) Between-receptor co-localization with EEs in DRG neurons (EE) and HEK293 cell (MOR-Rluc/FYVE-rGFP) assays (Pearson correlation: r = 0.9141, p = 0.0002).

Similar articles

Cited by

References

    1. Ayanga D., Shorter D., Kosten T.R. Update on pharmacotherapy for treatment of opioid use disorder. Expert Opin. Pharmacother. 2016;17:2307–2318. - PubMed
    1. Black J.W., Leff P. Operational models of pharmacological agonism. Proc. R. Soc. Lond. B Biol. Sci. 1983;220:141–162. - PubMed
    1. Breton B., Lagace M., Bouvier M. Combining resonance energy transfer methods reveals a complex between the alpha2A-adrenergic receptor, Galphai1beta1gamma2, and GRK2. FASEB J. 2010;24:4733–4743. - PubMed
    1. Compton W.M., Jones C.M., Baldwin G.T. Relationship between nonmedical prescription-opioid use and heroin use. N. Engl. J. Med. 2016;374:154–163. - PubMed
    1. DeWire S.M., Yamashita D.S., Rominger D.H., Liu G., Cowan C.L., Graczyk T.M., Chen X.T., Pitis P.M., Gotchev D., Yuan C. A G protein-biased ligand at the mu-opioid receptor is potently analgesic with reduced gastrointestinal and respiratory dysfunction compared with morphine. J. Pharmacol. Exp. Ther. 2013;344:708–717. - PubMed