. 2019 Mar 12:13:31.
doi: 10.3389/fnana.2019.00031. eCollection 2019.

Regional and Cellular Mapping of Sortilin Immunoreactivity in Adult Human Brain

Affiliations

Regional and Cellular Mapping of Sortilin Immunoreactivity in Adult Human Brain

Shu-Yin Xu et al. Front Neuroanat. .

Abstract

Sortilin is a member of the vacuolar protein sorting 10 protein (VPS10P) domain receptor family, which carries out signal transduction and protein transport in cells. Sortilin serves as the third, G-protein uncoupled, receptor of neurotensin that can modulate various brain functions. More recent data indicate an involvement of sortilin in mood disorders, dementia and Alzheimer-type neuropathology. However, data regarding the normal pattern of regional and cellular expression of sortilin in the human brain are not available to date. Using postmortem adult human brains free of neuropathology, the current study determined sortilin immunoreactivity (IR) across the entire brain. Sortilin IR was broadly present in the cerebrum and subcortical structures, localizing to neurons in the somatodendritic compartment, but not to glial cells. In the cerebrum, sortilin IR exhibited differential regional and laminar patterns, with pyramidal, multipolar and polymorphic neurons in cortical layers II-VI, hippocampal formation and amygdaloid complex more distinctly labeled relative to GABAergic interneurons. In the striatum and thalamus, numerous small-to-medium sized neurons showed light IR, with a small group of large sized neurons heavily labeled. In the midbrain and brainstem, sortilin IR was distinct in neurons at the relay centers of descending and ascending neuroanatomical pathways. Dopaminergic neurons in the substantia nigra, cholinergic neurons in the basal nuclei of Meynert and noradrenergic neurons in the locus coeruleus co-expressed strong sortilin IR in double immunofluorescence. In comparison, sortilin IR was weak in the olfactory bulb and cerebellar cortex, with the mitral and Purkinje cells barely visualized. A quantitative analysis was carried out in the lateral, basolateral, and basomedial nuclei of the amygdaloid complex, as well as cortical layers II-VI, which established a positive correlation between the somal size and the intensity of sortilin IR among labeled neurons. Together, the present study demonstrates a predominantly neuronal expression of sortilin in the human brain with substantial regional and cell-type variability. The enriched expression of sortilin in pyramidal, dopaminergic, noradrenergic and cholinergic neurons suggests that this protein may be particularly required for signal transduction, protein trafficking and metabolic homeostasis in populations of relatively large-sized projective neurons.

Keywords: Vps10p; dementia; neurodegenerative diseases; neuronal mapping; neuropeptides; protein trafficking.


Figures
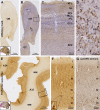
Figure 1
Figure 1
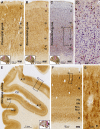
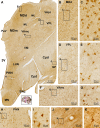
Laminar distribution and cellular localization of sortilin immunoreactivity (IR) in adult human olfactory bulb (OB) and prefrontal cortex. Panels (A,B) are low power views of sortilin IR in the bulb, with the latter taken from a hematoxylin-counterstained section. Panels (C,D) are enlarged views from the framed areas in (B) as indicated. The IR is generally weak across the various layers of the bulb (C), except for some lightly labeled fusiform cells around the central bulb area (D), likely representing the subependymal zone (SEZ). Panel (E) shows a low magnification view of labeling in the prefrontal cortex. The pattern is the same for Brodmann areas 32 and 24, with the IR occurring in the cortex but little in the white mater (WM). Panel (F) is enlarged from the framed area in (E) as indicated, showing labeled cells present largely in layers II–III and V/VI, primarily pyramidal and polymorphic in morphology. A large-sized pyramidal neuron in layer V exhibits the darkest labeling and contains intracellular granules (F, insert). Panel (G) shows an example of sortilin IR revealed in paraffin section of the prefrontal cortex (with hematoxylin-counterstain); the laminar and cellular pattern of the labeling are comparable to that displayed in cryostat sections (F). A small human brain map is inserted in the low magnification panels to indicate the tissue sampling locations and section orientation (provided in other figures as well). OT, olfactory tract; NFL, nerve fiber layer; GL, glomerular layer; EPL, external plexiform layer; MCL, mitral cell layer; IPL, inner plexiform layer; GCL, granule cell layer. I–VI, cortical layers. Scale bars are as indicated.
Figure 2
Figure 2
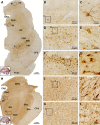
Representative images illustrating sortilin IR in the primary motor (precentral gyrus), somatosensory (postcentral gyrus), and visual cortices of adult human brain. Cortical regions and lamination are as indicated in individual panels. Note the narrow layer IV (A) and V (B) in the motor and somatosensory areas, respectively. In the hematoxylin-counterstained sections, large pyramidal neurons with heavy IR are clearly present in the low portion of layer III, whereas layer IV has few labeled cells (C,D). In the occipital cortex, the border between areas 17 and 18 can be identified based on the widening and stratification of layer IV in the former (E). Again, sortilin IR occurs mainly in layers II/III and VI (F), with those in layers II/III localized to pyramidal neurons (G). Note that the layer V of area 17 is thin, whereas layer IV is expanded and can be divided into IVa, IVb, IVcα, and IVcβ based on the difference in labeling intensity (F). CS, calcarine sulcus. Scale bars are as indicated.
Figure 3
Figure 3
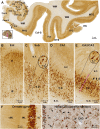
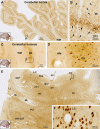
Representative images showing sortilin IR in the adult human temporal lobe structures. Panel (A) is a low magnification image from a frontal plane section passing the anterior part of the hippocampus. The laminar pattern of IR in the temporal neocortex is similar by moving lateromedially from the middle (MTG) to inferior (STG) temporal gyri, and further to the fusiform gyrus (FG), with a light band corresponding to layer IV seen across the areas. A transition of the six-layered neocortex to three-layered paleocortex is seen around the parahippocampal gyrus (PHG). Sortilin IR clearly displayed the stratum pyramidale (s.p.) over the subicular subregions including the parasubiculum (Para-S), presubiculum (Pre-S), subiculum (Sub) and prosubiculum (Pro-S), as well as subsectors of Ammon’s horn CA1, CA2, and CA3. Framed areas are shown as enlarged views of the labeling the areas as indicated (B–G). Panel (B) shows labeled pyramidal-like neurons in layers II and III, with that in layer II arranged as a cell island. Panel (C) show labeled neuronal somata and dendritic processes in the subiculum in the s.p. and stratum radiatum (s.r.). Panel (D) shows labeled CA1 pyramidal neurons and dendritic processes. Panel (E) shows the labeling at the border (purple line) of CA2 and CA3, note the clusters of granular profiles representing thorny excrescences (TE) (arrows) in the CA3. Axons (Ax) of the pyramidal neurons are rarely visible or only traceable for a short distance from the somata (C,E, inserts). Panel (F) shows the dense labeling in the granule cells and the neuropil-like labeling in the molecular layer (ML) appearing as a lightly stained band over the inner ML (iML) and a moderately stained band over the outer ML (oML). Panel (G) shows an additional example (also see Figure 1G) of sortilin IR revealed in paraffin sections (with hematoxylin-counterstain), illustrating the TEs of the mossy cells and CA3 pyramidale neurons. The TEs appear as granular profiles packed around the dendritic trees (arrows) or in isolated clusters (arrowheads). ITS, inferior temporal sulcus; OTS, occipitotemporal sulcus; Col-S, collateral sulcus; WM, white matter. Scale bars are provided in each panel.
Figure 4
Figure 4
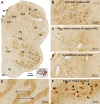
Images showing sortilin IR in the adult human amygdala complex and the surrounding temporal cortex. Panel (A) is a low magnification image covering the entire area, with framed areas enlarged as other panels as indicated. Across the amygdaloid complex, the central nucleus (CE) and basolateral nucleus (BL) show a darker labeling than the lateral nucleus (LA) and basomedial nucleus (BM) (A–D). At high magnification, the labeled neurons are mostly multipolar in shape, appear to have similar soma size and are oriented without regularity in all subnuclei. The neurons in the CE and dorsal (BLd), intermediate (BLi) and ventral (BLv) divisions of the BL appear to be more strongly labeled relative to those in dorsal (LAd) and ventral (LAv) divisions of the LA and in the dorsal (BMd) and ventral (BMv) divisions of the BM (B–D, F–H). Medial to the amygdalar complex, labeled cells occurs in groups corresponding to the basal nucleus of Meynert (BNM) (A,E,I), while a small amount of labeled cells with light to moderate intensity are seen in the hypothalamic region (HTh) (A). Little labeling is seen in the what matter (WM) and the optic tract (OT). Col-S, collateral sulcus; OTS, occipitotemporal sulcus; PRG, perirhinal gyrus. Scale bars are provided in each panel.
Figure 5
Figure 5
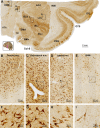
Images showing sortilin IR in subregions of the basal ganglia. Panel (A) is a low power view of frontal section at the level of the insular lobe, with framed areas enlarged as other panels as marked. Compared to the strong labeling in the insular cortex (iCtx) and the claustrum nucleus (Cla), light to moderate IR is seen in the body of caudate (CaB), the putamen (Pu) and globus pallidus (GP). At higher magnifications, the labeled cells in the above areas are mostly small multipolar neurons exhibiting light to moderate intensity. However, individual large-sized multipolar neurons are heavily labeled (B,C,D,F,G,H). Panels (E,I) show high power views of the cells in the Cla, which exhibit stronger labeling intensity relative to the labeled neurons in the striatum. Note the lack of sortilin IR in the internal (IC) and external (EC) capsules. LS, lateral sulcus. Scale bars are as indicated.
Figure 6
Figure 6
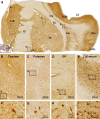
Distribution of sortilin IR in subregions of the thalamus and hypothalamus. Panel (A) is a low power view of a frontal section at the level of the mammillary body. The labeling intensity of sortilin IR is low in general across the thalamic and hypothalamic regions. Framed areas are enlarged as indicated to display immunolabeled cells in different locations. Panels (B,C) show small-sized multipolar neurons in the densocelllular division of the mediodorsal nuclear complex (MDd), which display moderate labeling intensity. Panels (D–G) show small-sized multipolar neurons with light labeling intensity in the lateral division of the ventroposterior nuclear complex (VPL), and in the magnocellular division of the ventral lateral nuclear complex (VAmc). Panels (H,I) show lightly stained neurons in posterior hypothalamic nucleus (PHN). In comparison, labeled neurons in the substantia nigra pars compacta (SNc) exhibit strong IR relative to the cells in the above thalamic and hypothalamic areas (J,K). Cpd, cerebral peduncle; GP, globus pallidus; IML, internal medullary lamina; LHN, lateral hypothalamic nucleus; MDm, magnocellular (medial) division of the mediodorsal nucleus; PaV: paraventricular nucleus; 3V, third ventricle; VApr, parvocellular division of ventral lateral nucleus; VM, ventral medial nucleus. Scale bars in the panels are as indicated.
Figure 7
Figure 7
Images showing sortilin IR in the midbrain at the levels of superior colliculus (A–G) and red nucleus (H–L). Panel (A) is low power view of labeling across the midbrain and part of pons, noting the prominent IR along the pars compacta of the substantia nigra (SNc) and moderate labeling located ventrally, laterally and dorsally to the cerebral aqueduct (CAD), corresponding to the periaqueductal gray substance (PAG), the oculomotor nucleus (3N) and reticular formation (RF). Panels (B,C) showed labeled cells in the deep layer of SC, including a large multipolar neuron. Panels (D,E) show moderately labeled neurons in oculomotor (3N) nucleus, some of which are multipolar. In the SNc, labeled cells are densely packed with heavy reactivity (F,G). At the level of RN (H), sortilin IR appears moderate across the medial and dorsal areas of the section, whereas no labeling exists in the cerebral peduncle (CPd) and less labeling occurs in the pars reticulata of SN (SNr) and parabrachial pigmented nucleus (PBP). Panels (I–L) show closer views of labeled cells in the trochlear nucleus (4N) and the red nucleus (RN). Scale bars are as indicated.
Figure 8
Figure 8
Representative images showing sortilin IR in the adult human cerebellum (A–D) and pons (E). Panel (A) is low power view of the cerebellar cortex, with an impressive band-like labeling located in the middle of the cerebellar lobules. The framed area in (A) is enlarged as (B), which shows that at high magnification, this band reflects small granular but non-cellular elements distributed along the Purkinje cell layer (PCL). The somata of Purkinje cells (pointed by arrows) exhibit faint labeling. Lightly stained small neurons (pointed by arrowheads) representing basket cells are present in the molecular layer (ML), with a few also in the granule cell layer (GCL). Cells in the dentate nucleus (DN) are lightly stained with their proximal processes visible. The cerebellar white matter (WM) shows no labeling. In transverse section of the upper part of the pons (E), the most impressive sortilin IR occurs in the locus coeruleus (LC) that is occupied by a group of densely labeled neurons, as enlarged in (F). These cells are mostly round/oval in shape and have short processes (insert). There are light labeling in the periaqueductal gray substance (PAG), dorsal raphe nucleus (DR) and reticular formation (RF). Little labeling is seen in the longitudinal and transverse neural fiber systems, including the central tegmental tract (CTT), median longitudinal fasciculus (MLF), superior cerebellar peduncle (SCP), lateral lemniscus (LL), spinal lemniscus (SL), medial lemniscus (ML), pontocerebellar tract (PCT) and the corticobulbar and corticospinal tracts (CBT, CST) (E). Scale bars are as indicated.
Figure 9
Figure 9
Low (A) and high (B–F) power views of sortilin IR in the adult human medulla oblongata (MO). At low magnification, labeled elements are mainly arranged as groups of cells located medial and lateral to the fourth ventricle (4V), and in the ventrolateral areas of the pons corresponding to the main and accessory nuclei (dorsal and medial, IOd and IOm) of the inferior olive (IO). Thus, labeled neurons are located in all cranial nerve nuclei at this level, including the cochlear and vestibular nuclei (8N), dorsal motor nucleus of vagus (10N), hypoglossal nucleus (12N), facial nucleus (7N), trigeminal sensory nucleus (5N), the solitary tract nucleus (SoN) and the reticular formation (RF) (B–D). Neurons in the arcuate nucleus (AN) are also labeled, whereas the pyramid (Py) is unlabeled (A). Labeled neurons in the IO are mostly multipolar in shape by closer examination (E,F). Scale bars are as indicated in the panels.
Figure 10
Figure 10
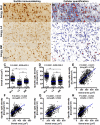
Correlative analysis on somal area and immunoreactivity of sortilin-labeled neurons in the basolateral dorsal nucleus (BLd), lateral nucleus (LA) and basomedial nucleus (BM) of the amygdaloid complex (A–G), and the temporal neocortex (H). Panel (A) is a combined image consisted of microscopic fields from the above nuclei as indicated, obtained from the same Motic-scanned image. Panel (B) is a screen-print working document viewed on the OptiQuant interface, which is in gray-scale TIFF format with pseudocolor representation of optic density variability among labeled profiles. Tracing marks surrounding individual neurons are visible, with somal area and total optic density, expressed as digital light units per square millimeter (DLU/mm2), reported for each circled neurons. Specific optic densities are calculated by using the optic density measured over a section processed in parallel but omitting the primary antibody incubation as a cut-off threshold. Panel (C) plots the somal areas of 197 neurons in the BLd nucleus, 317 neurons in the LA and 190 neurons in the BM of human brain #3. Panel (D) plots the specific optic densities of corresponding groups of individual neurons. The medians are significantly different between individual paring groups. Panel (E) is a correlation analysis for all measured neurons from the three nuclei, indicating a positive correlation (p < 0.0001, r = 0.673) between the somal area and labeling intensity among individual cells. Panels (F,G) plot the results of correlation analyses of amygdalar neurons measured in sections from brains #5 (p < 0.0001, r = 0.628) and brain #6 (p < 0.0001, r = 0.531). Panel (H) shows the positive correlation (p < 0.0001, r = 0.524) between somal size and labeling intensity of neurons measured over layers II–VI of the temporal neocortex from brain #3. Statistics reported by the non-parametric Kruskal–Wallis test with Dunn’s multiple comparison of medians (C,D) and Pearson correlation (E) are as indicated, () with star signs indicating existence of significant intergroup difference. The numbers (n) of neurons measured are also labeled in the graph panels.
Figure 11
Figure 11
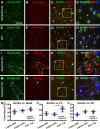
Confocal double immunofluorescent characterization of sortilin labeling with neuronal markers. Antibody markers and imaged areas are as indicated, with cell nuclei displayed by bisbenzimide (Bis) stain in blue. Panels (A–H) show a frequent colocalization of sortilin with the neuronal nuclear antigen (NeuN) in the temporal cortex (Ctx), although some NeuN+ cells (arrows) exhibits little sortilin IR. Panels (I–L) show that parvalbumin (PV)+ interneurons exhibit infrequent sortilin colocalization. However, a sortilin+ granules can be found in the PV+ somata (enlarged round inserts) (I,L). At high magnification PV+ terminals occur surrounding the somata and dendrites of pyramidal cells with bright sortilin IR (J,L). Panels (M–P) show a lack of clear sortilin labeling in calbindin (CB)+ interneurons. Panels (R1–3) plot quantification of the colocalization rates. Clear sortilin labeling is seen in over 80% NeuN+ neurons (R1), whereas sortilin labeling (weak intensity or granular elements) is seen in ∼40–60% PV+ neurons (R2), and in ∼20–30% CB+ neurons (R3). p < 0.05 by intergroup comparison. Scale bar = 100 μm in (A) applying to (B,C,E–G,I–K,M–O), equivalent to 33 μm for the remaining panels.
Figure 12
Figure 12
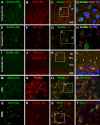
Confocal double immunofluorescent characterization of sortilin labeling relative to glial and additional neuronal markers. Antibody markers and imaged areas are as indicated, with cell nuclei displayed by bisbenzimide (Bis). Panel (A–D) show that sortilin labeling does not colocalize with immunofluorescence of glial fibrillary acidic protein (GFAP), an astrocytic marker, around the border of layer VI and the white matter (WM) of the temporal cortex (Ctx). There is also no colocalization between sortilin and Iba1, a marker of microglia (E–H). Panels (I–L) show a lack of sortilin labeling in cerebellar Purkinje cells (PC) displaying distinct PV immunoreactivity in the somata and in axons in the WM. Sortilin labeled dot-like elements (white arrows) are present around the Purkinje cell somata. Panels (M–P) demonstrate a complete colocalization of sortilin in dopaminergic neurons in the pars compacta of the substantia nigra (SNc) as visualized by the tyrosine hydroxylase (TH) antibody. Panels (Q–T) illustrate the colabeling of sortilin and choline acetyltransferase (ChAT) in a population of large-sized neurons in the basal nucleus of Meynert (BNM). ML, molecular layer; PCL, Purkinje cell layer; GCL, granule cell layer. Scale bar = 100 μm in (A) applying to (B,C,E–G,I–K,M–O,Q–S), equivalent to 33 μm for the right-side high magnification panels.

Similar articles

Cited by

References

    1. Alexander M. J., Leeman S. E. (1998). Widespread expression in adult rat forebrain of mRNA encoding high-affinity neurotensin receptor. J. Comp. Neurol. 402 475–500. 10.1002/(SICI)1096-9861(19981228)402:4<475::AID-CNE4>3.0.CO;2-9 - DOI - PubMed
    1. Allard S., Jacobs M. L., Do Carmo S., Cuello A. C. (2018). Compromise of cortical proNGF maturation causes selective retrograde atrophy in cholinergic nucleus basalis neurons. Neurobiol. Aging 67 10–20. 10.1016/j.neurobiolaging.2018.03.002 - DOI - PubMed
    1. Alonso R., Gnanadicom H., Fréchin N., Fournier M., Le Fur G., Soubrié P. (1999). Blockade of neurotensin receptors suppresses the dopamine D1/D2 synergism on immediate early gene expression in the rat brain. Eur. J. Neurosci. 11 967–974. 10.1046/j.1460-9568.1999.00506.x - DOI - PubMed
    1. Al-Shawi R., Hafner A., Olsen J., Chun S., Raza S., Thrasivoulou C., et al. (2008). Neurotoxic and neurotrophic roles of proNGF and the receptor sortilin in the adult and ageing nervous system. Eur. J. Neurosci. 27 2103–2114. 10.1111/j.1460-9568.2008.06152.x - DOI - PubMed
    1. Andersen J. L., Schrøder T. J., Christensen S., Strandbygård D., Pallesen L. T., García-Alai M. M., et al. (2014). Identification of the first small-molecule ligand of the neuronal receptor sortilin and structure determination of the receptor-ligand complex. Acta Crystallogr. D Biol. Crystallogr. 70(Pt 2), 451–460. 10.1107/S1399004713030149 - DOI - PMC - PubMed

LinkOut - more resources