. 2019 Apr 9;116(15):7439-7448.
doi: 10.1073/pnas.1901376116. Epub 2019 Mar 25.

Enhanced oxidative phosphorylation in NKT cells is essential for their survival and function

Affiliations

Enhanced oxidative phosphorylation in NKT cells is essential for their survival and function

Ajay Kumar et al. Proc Natl Acad Sci U S A. .

Abstract

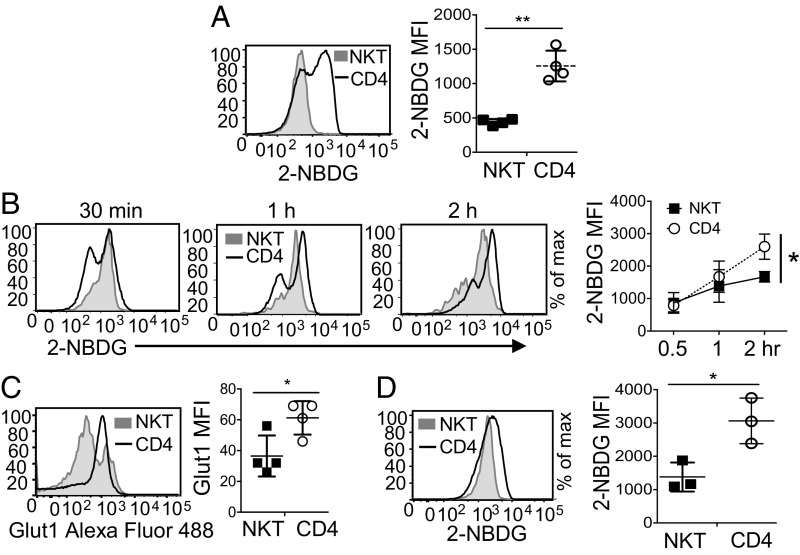
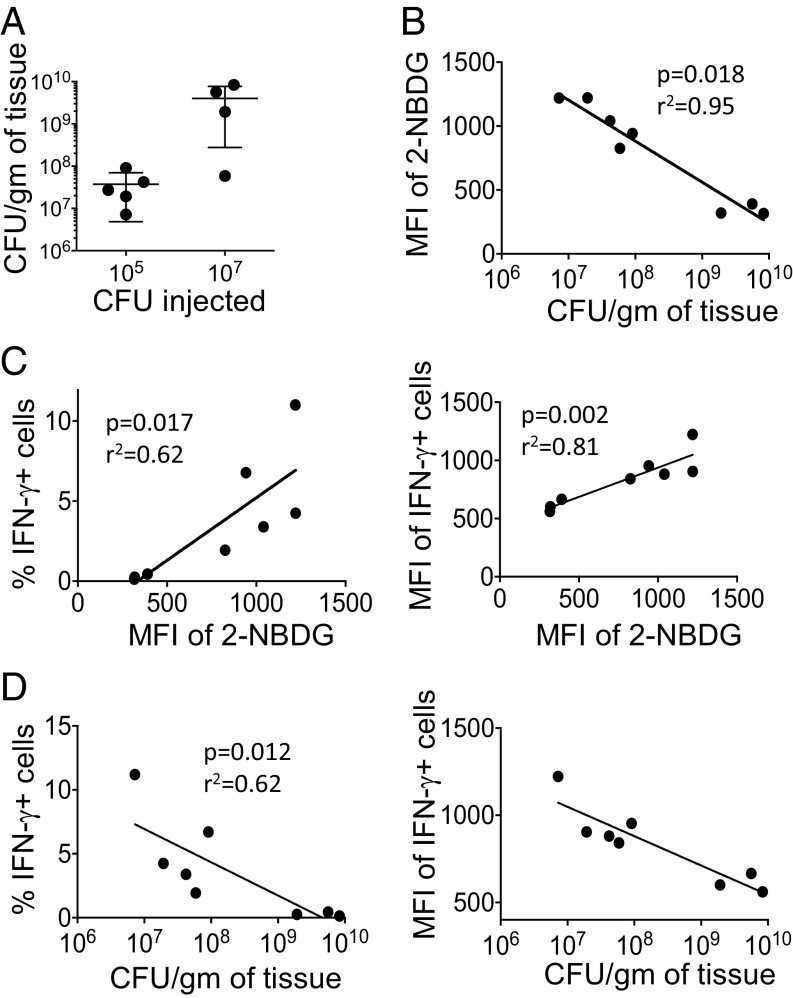
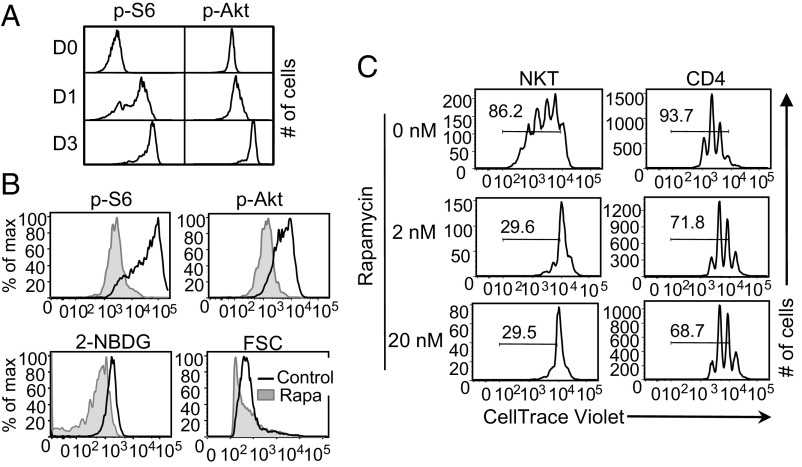
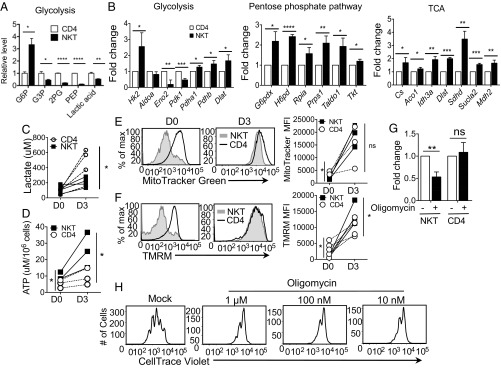
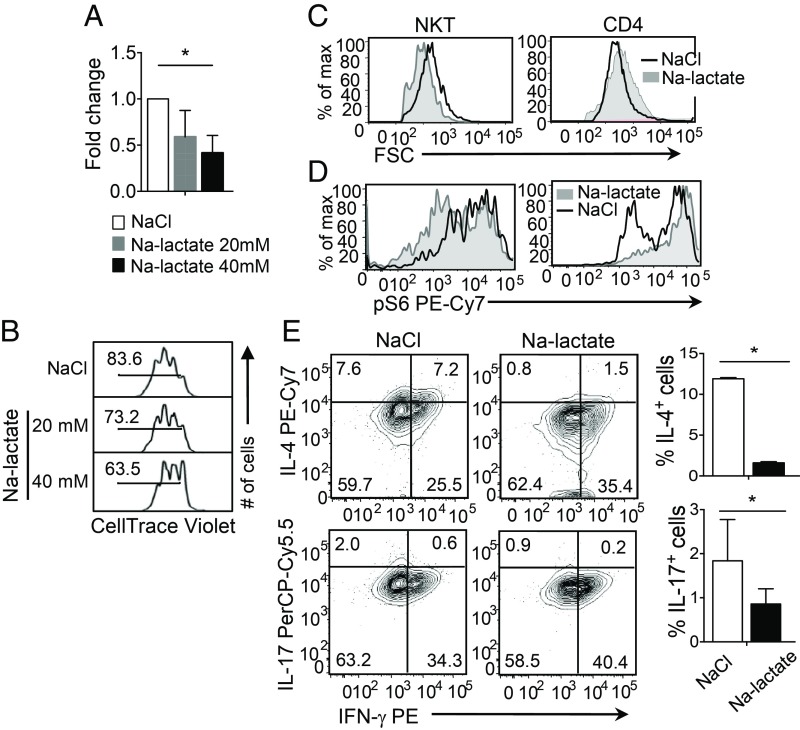
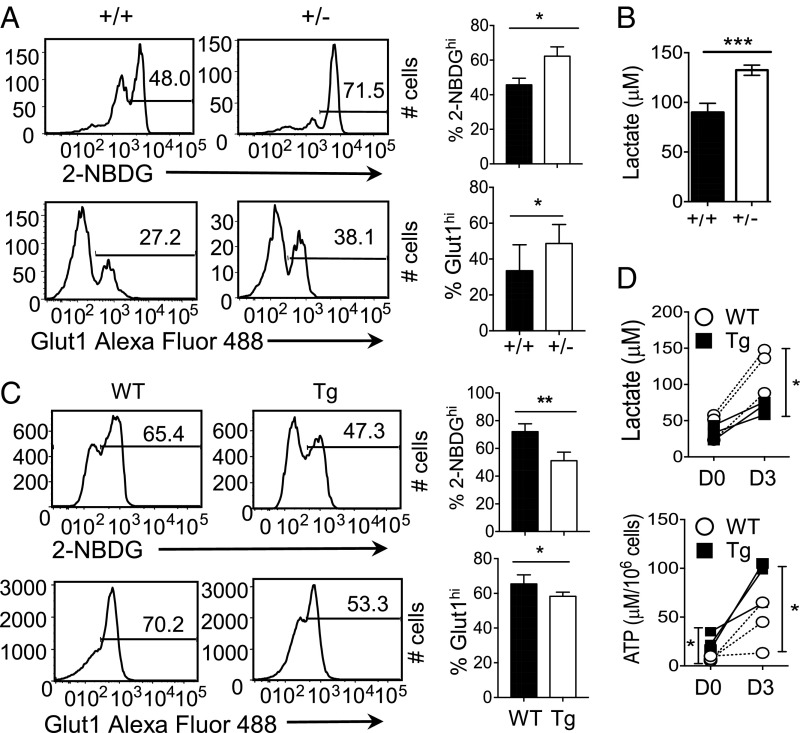
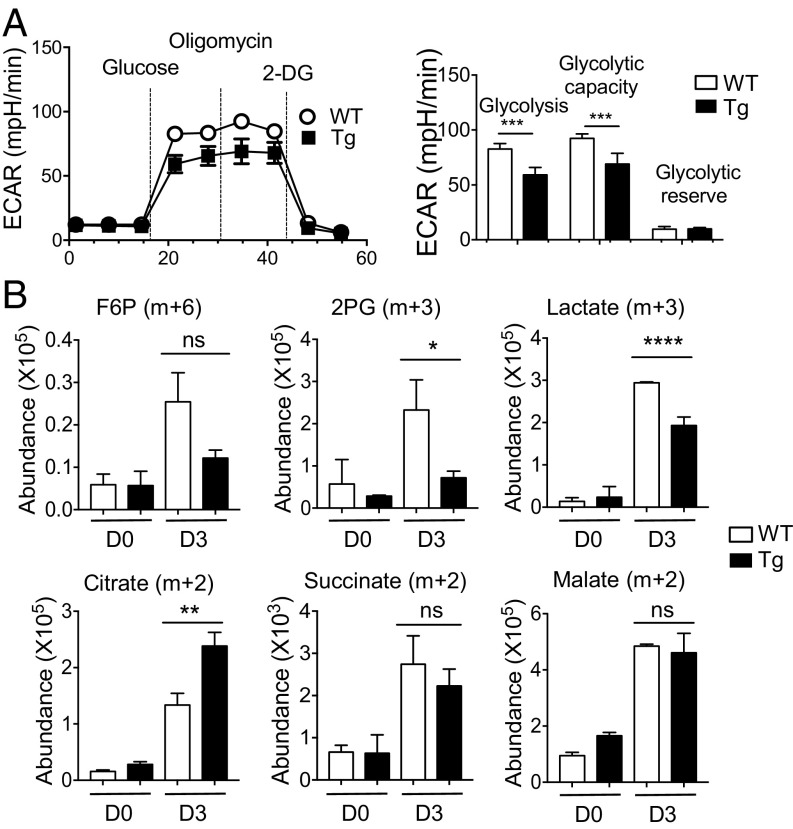
Cellular metabolism and signaling pathways are key regulators to determine conventional T cell fate and function, but little is understood about the role of cell metabolism for natural killer T (NKT) cell survival, proliferation, and function. We found that NKT cells operate distinct metabolic programming from CD4 T cells. NKT cells are less efficient in glucose uptake than CD4 T cells with or without activation. Gene-expression data revealed that, in NKT cells, glucose is preferentially metabolized by the pentose phosphate pathway and mitochondria, as opposed to being converted into lactate. In fact, glucose is essential for the effector functions of NKT cells and a high lactate environment is detrimental for NKT cell survival and proliferation. Increased glucose uptake and IFN-γ expression in NKT cells is inversely correlated with bacterial loads in response to bacterial infection, further supporting the significance of glucose metabolism for NKT cell function. We also found that promyelocytic leukemia zinc finger seemed to play a role in regulating NKT cells' glucose metabolism. Overall, our study reveals that NKT cells use distinct arms of glucose metabolism for their survival and function.

Keywords: NKT; OXPHOS; PLZF; glucose.


Conflict of interest statement

The authors declare no conflict of interest.

Figures

Fig. 1.
Fig. 1.
NKT cells take up glucose less efficiently than CD4 T cells. (A) Representative histogram comparing in vivo glucose uptake in NKT and CD4 T cells from C57BL/6 mice injected with 100 µL of 2-NBDG (12.5-mg/g body weight) intravenously. The graph shows cumulative of four independent experiments. (B) The representative histograms show comparative glucose uptake between NKT and CD4 T cells. Freshly isolated splenocytes from C57BL/6 mice were incubated with 2-NBDG (20 µM) in glucose-free media for indicated time periods. The graph is cumulative of three independent experiments. (C) The histogram represents Glut1 expression between NKT and CD4 T cells from total splenocytes. The graph is cumulative of four independent experiments. (D) C57BL/6 mice were injected intraperitoneally with 100 µL of anti-CD3 antibody (2.5-mg/g body weight) 20–22 h before the intravenous injection of 2-NBDG, as mentioned in A. The representative histogram shows glucose uptake in NKT and CD4 T cells. The graph is cumulative of three independent experiments. Error bars represent mean ± SEM; *P < 0.05, **P < 0.01.
Fig. 2.
Fig. 2.
Glucose is essential for optimal cytokine expression but not for survival and proliferation of NKT cells. (A) NKT cells were sorted from spleens of C57BL/6 mice and stimulated with α-GalCer (100 ng/mL) in the presence of indicated concentrations of glucose in the media. The graph shows the percentage of live NKT cells on day 3 of stimulation measured by PI exclusion (n = 3). (B) NKT and CD4 T cells were sorted, labeled with CellTrace Violet and then stimulated in the indicated concentrations of glucose-containing media. α-GalCer or anti-CD3 with anti-CD28 antibodies (details are described in Materials and Methods) were used to stimulate NKT or CD4 T cells, respectively. Representative histograms show cell proliferation measured after 3 d of stimulation. (C) Sorted NKT cells were stimulated as in A in the presence of 10 mM glucose or 2 mM glutamine alone, or with both in the media. The graph shows the fold-change in percent of live NKT cells after 3 d (n = 3). (D) Representative plots show cytokine expression in NKT cells stimulated for 3 d in the indicated glucose concentrations and restimulated with PMA and ionomycin in the same media conditions. Error bars represent mean ± SEM; *P < 0.05.
Fig. 3.
Fig. 3.
Glucose uptake of NKT cells correlates with their function in response to bacterial infection. A group of C57BL/6 mice (four to five mice per group) were infected with 105 or 107 CFU per mouse LM-Ova intraperitoneally. Two days after infection, spleens were used for bacterial enumeration, 2-NBDG uptake, and IFN-γ expression. (A) Bacterial loads in the spleens of mice that were infected with the two different doses of Listeria are shown. (B) Glucose uptake measured by 2-NBDG inversely correlates with the bacterial loads. The 2-NBDG uptake assay was performed using freshly isolated splenocytes from infected mice. (C and D) Total splenocytes were incubated in the presence of Golgi Plug for 2 h followed by intracellular cytokine staining for IFN-γ expression in NKT cells. The frequency of IFN-γ+ (L) as well as the MFI of IFN-γ+ (Right) NKT cells show a positive and negative correlation with glucose uptake (C) and bacterial loads (D), respectively. Two independent experiments showed similar results. Spearman correlation was used for correlation calculation.
Fig. 4.
Fig. 4.
mTORC regulates glucose uptake in activated NKT cells. (A) NKT cells were sorted from spleens of C57BL/6 mice and stimulated with anti-CD3 and anti-CD28 antibodies. Representative histograms from three independent experiments show the level of pS6Ser235/236 and pAktSer473 in NKT cells at day 0 (D0), day 1 (D1), and day 3 (D3) of stimulation. (B) Sorted NKT cells were stimulated for 3 d with α-GalCer in the presence of either DMSO (Control) or rapamycin (20 nM). Representative histograms show the amounts of pS6Ser235/236, pAktSer473, 2-NBDG uptake (20 µM), and FSC of NKT cells on day 3. (C) NKT cells were stimulated as mentioned in B and CD4 T cells as described in Materials and Methods in the presence of rapamycin (2 nM and 20 nM) or DMSO for 3 d. Cell proliferation was measured using CellTrace Violet dilutions. Histograms are representative of at least three independent experiments.
Fig. 5.
Fig. 5.
Maintenance of optimum NKT cell survival, proliferation and function requires elevated OXPHOS. (A) Freshly sorted NKT and CD4 T cells from C57BL/6 mice were subjected to metabolomic analysis through LC-MS/MS. The graph shows relative levels of metabolites representing glycolysis between NKT and CD4 T cells. Values are from three replicas. (B) Sorted NKT and CD4 T cells were stimulated with anti-CD3 and anti-CD28 antibodies for 3 d, and RNA was prepared. Expression of genes involved in the indicated pathways of glucose metabolism was measured using RT2 PCR array. Fold-change was calculated as described in Materials and Methods and the values were compared between stimulated NKT and CD4 T cells. The graphs are cumulative of three independent experiments. (C and D) The graphs show intracellular levels of lactate (C) and ATP (D) in NKT and CD4 T cells with (D3) or without (D0) stimulation with anti-CD3 and anti-CD28 antibodies for 3 d. (E and F) Representative histograms show mitochondrial mass measured by staining with MitoTracker (E) and mitochondrial potential measured by TMRM staining (F) in NKT and CD4 T cells without (D0) and with stimulation (D3), as mentioned in B. The graphs are cumulative of three to four experiments. (G and H) Sorted NKT and CD4 T cells were stimulated with α-GalCer and anti-CD3 and anti-CD28 antibodies, respectively, in the presence of DMSO (0 mM) or oligomycin at indicated concentrations. (G) The graph shows fold-changes in percent live NKT and CD4 T cells measured by PI exclusion after 3 d of stimulation in the presence of 10 nM oligomycin (n = 3). (H) Representative histograms show NKT cell proliferation measured using CellTrace Violet dilutions on day 3 of stimulation of NKT cells. All of the results are representative of at least three independent experiments. Error bars represent mean ± SEM; *P < 0.05, **P < 0.01, ***P < 0.001, ****P < 0.0001.
Fig. 6.
Fig. 6.
A high-lactate environment is detrimental for NKT cell homeostasis and effector functions. Sorted NKT and CD4 T cells from of C57BL/6 spleens were stimulated for 3 d, as in Fig. 2, in the presence of NaCl or Na-lactate. (A) The graph shows fold-changes in surviving NKT cells under the indicated conditions at day 3 using PI exclusion assay (n = 3). (B) Representative histograms show proliferation of NaCl and Na-lactate (20 mM and 40 mM) treated NKT cells using CellTrace Violet dilutions (n = 3). (C and D) Representative histograms comparing the cell size measured using FSC (C) and levels of pS6Ser235/236 (D) in NKT and CD4 T cells treated with NaCl and Na-lactate (40 mM) (n = 3). (E) Representative plots show the cytokine expressions in NKT cells stimulated for 3 d in the presence of either NaCl or Na-lactate (40 mM) and restimulated with PMA and ionomycin on day 3. Summary graphs on the Right show percentages of IL-4+ and IL-17+ NKT cells. All of the data are representative of at least three independent experiments. Error bars represent mean ± SEM; *P < 0.05.
Fig. 7.
Fig. 7.
PLZF levels negatively correlate with glycolysis rate in NKT and PLZFTg CD4 T cells. (A) Representative histograms show 2-NBDG uptake (Upper) and Glut1 expression (Lower) in splenic NKT cells from PLZF haplodeficient (+/−) and WT littermate (+/+) mice. The graphs (Right) are cumulative of four independent experiments. (B) The graph shows intracellular lactate levels in freshly sorted NKT cells from PLZF haplodeficient (+/−) and WT littermate mice (n = 3). (C) Representative histograms compare 2-NBDG uptake (Upper) and Glut1 expression (Lower) in splenic CD4 T cells from PLZFTg (Tg) and WT littermate mice. The bar graphs are cumulative of four independent experiments. (D) The graphs show intracellular lactate (Upper) and ATP levels (Lower) in enriched CD4 T cells from PLZFTg and WT littermate mice before (D0) and after 3 d of stimulation (D3) with anti-CD3 and anti-CD28 antibodies. The graphs are cumulative of three independent experiments. Error bars represent mean ± SEM; *P < 0.05, **P < 0.01, ***P < 0.001.
Fig. 8.
Fig. 8.
PLZF expression correlates with levels of OXPHOS. (A) CD4 T cells from PLZFTg and WT littermate mice were enriched and stimulated as described in Materials and Methods for 3 d. The representative graph (Left) shows the comparison of ECAR using the Seahorse assay. (Right) Graph showing basal glycolysis, glycolytic capacity, and glycolytic reserve capacity in PLZFTg and WT CD4 T cells from three independent experiments. (B) WT and PLZFTg CD4 T cells were stimulated for 3 d, washed, and cultured in glucose-free RPMI containing glutamine (2 mM) and [13C6]-glucose (15 mM) for 4 h before subjecting to LC-MS analysis. Representative graphs show the abundance of 13C6-glucose-derived carbon in glycolysis (F6P, 2PG, and lactate) and TCA cycle (citrate, succinate, and malate) intermediate metabolites from cells before (D0) and after stimulation for 3 d (D3). Two independent experiments showed similar results. Error bars represent mean ± SEM; ns, not significant, *P < 0.05, **P < 0.01, ***P < 0.001, ****P < 0.0001.

Similar articles

Cited by

References

    1. Arase H, Arase N, Nakagawa K, Good RA, Onoé K. NK1.1+ CD4+ CD8- thymocytes with specific lymphokine secretion. Eur J Immunol. 1993;23:307–310. - PubMed
    1. Bendelac A, Rivera MN, Park SH, Roark JH. Mouse CD1-specific NK1 T cells: Development, specificity, and function. Annu Rev Immunol. 1997;15:535–562. - PubMed
    1. Zeng Z, et al. Crystal structure of mouse CD1: An MHC-like fold with a large hydrophobic binding groove. Science. 1997;277:339–345. - PubMed
    1. Gapin L, Matsuda JL, Surh CD, Kronenberg M. NKT cells derive from double-positive thymocytes that are positively selected by CD1d. Nat Immunol. 2001;2:971–978. - PubMed
    1. Zhang L, et al. Mammalian target of rapamycin complex 1 orchestrates invariant NKT cell differentiation and effector function. J Immunol. 2014;193:1759–1765. - PubMed

Publication types

MeSH terms

Substances