N-Glycomic and Transcriptomic Changes Associated with CDX1 mRNA Expression in Colorectal Cancer Cell Lines
- PMID: 30909444
- PMCID: PMC6468459
- DOI: 10.3390/cells8030273
N-Glycomic and Transcriptomic Changes Associated with CDX1 mRNA Expression in Colorectal Cancer Cell Lines
Abstract
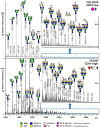
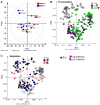
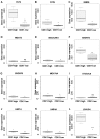
The caudal-related homeobox protein 1 (CDX1) is a transcription factor, which is important in the development, differentiation, and homeostasis of the gut. Although the involvement of CDX genes in the regulation of the expression levels of a few glycosyltransferases has been shown, associations between glycosylation phenotypes and CDX1 mRNA expression have hitherto not been well studied. Triggered by our previous study, we here characterized the N-glycomic phenotype of 16 colon cancer cell lines, selected for their differential CDX1 mRNA expression levels. We found that high CDX1 mRNA expression associated with a higher degree of multi-fucosylation on N-glycans, which is in line with our previous results and was supported by up-regulated gene expression of fucosyltransferases involved in antenna fucosylation. Interestingly, hepatocyte nuclear factors (HNF)4A and HNF1A were, among others, positively associated with high CDX1 mRNA expression and have been previously proven to regulate antenna fucosylation. Besides fucosylation, we found that high CDX1 mRNA expression in cancer cell lines also associated with low levels of sialylation and galactosylation and high levels of bisection on N-glycans. Altogether, our data highlight a possible role of CDX1 in altering the N-glycosylation of colorectal cancer cells, which is a hallmark of tumor development.
Keywords: HNF1A; N-glycosylation; caudal-related homeobox protein 1 (CDX1), differentiation; colorectal cancer cell lines; fucosylation; fucosyltransferase (FUT), hepatocyte nuclear factor (HNF)4A.
Conflict of interest statement
The authors declare no conflict of interest. The funders had no role in the design of the study; in the collection, analyses, or interpretation of data; in the writing of the manuscript; or in the decision to publish the results.
Figures


Similar articles
-
N-glycosylation Profiling of Colorectal Cancer Cell Lines Reveals Association of Fucosylation with Differentiation and Caudal Type Homebox 1 (CDX1)/Villin mRNA Expression.Mol Cell Proteomics. 2016 Jan;15(1):124-40. doi: 10.1074/mcp.M115.051235. Epub 2015 Nov 4. Mol Cell Proteomics. 2016. PMID: 26537799 Free PMC article.
-
Oxidative stress causes epigenetic alteration of CDX1 expression in colorectal cancer cells.Gene. 2013 Jul 25;524(2):214-9. doi: 10.1016/j.gene.2013.04.024. Epub 2013 Apr 22. Gene. 2013. PMID: 23618814
-
Molecular cloning, sequencing and expression of the mRNA encoding human Cdx1 and Cdx2 homeobox. Down-regulation of Cdx1 and Cdx2 mRNA expression during colorectal carcinogenesis.Int J Cancer. 1997 Feb 20;74(1):35-44. doi: 10.1002/(sici)1097-0215(19970220)74:1<35::aid-ijc7>3.0.co;2-1. Int J Cancer. 1997. PMID: 9036867
-
Regulation of the intestinal glycoprotein glycosylation during postnatal development: role of hormonal and nutritional factors.Biochimie. 2003 Mar-Apr;85(3-4):331-52. doi: 10.1016/s0300-9084(03)00039-7. Biochimie. 2003. PMID: 12770772 Review.
-
Glycosylation characteristics of colorectal cancer.Adv Cancer Res. 2015;126:203-56. doi: 10.1016/bs.acr.2014.11.004. Epub 2015 Feb 7. Adv Cancer Res. 2015. PMID: 25727149 Review.
Cited by
-
N-Glycoproteins Have a Major Role in MGL Binding to Colorectal Cancer Cell Lines: Associations with Overall Proteome Diversity.Int J Mol Sci. 2020 Aug 1;21(15):5522. doi: 10.3390/ijms21155522. Int J Mol Sci. 2020. PMID: 32752259 Free PMC article.
-
Label-Free Liquid Chromatography-Mass Spectrometry Quantitation of Relative N- and O-Glycan Concentrations in Human Milk in Japan.Int J Mol Sci. 2024 Feb 1;25(3):1772. doi: 10.3390/ijms25031772. Int J Mol Sci. 2024. PMID: 38339050 Free PMC article.
-
Regulation of the Lewis Blood Group Antigen Expression: A Literature Review Supplemented with Computational Analysis.Transfus Med Hemother. 2024 Jun 19;51(4):225-236. doi: 10.1159/000538863. eCollection 2024 Aug. Transfus Med Hemother. 2024. PMID: 39135855 Free PMC article. Review.
-
The Assessment of CDX1, IHH, SHH, GATA4, FOXA2, FOXF1 in Congenital Intra-Abdominal Adhesions.Acta Med Litu. 2024;31(1):109-121. doi: 10.15388/Amed.2024.31.1.15. Epub 2024 Feb 27. Acta Med Litu. 2024. PMID: 38978864 Free PMC article.
-
Towards Mapping of the Human Brain N-Glycome with Standardized Graphitic Carbon Chromatography.Biomolecules. 2022 Jan 6;12(1):85. doi: 10.3390/biom12010085. Biomolecules. 2022. PMID: 35053234 Free PMC article.
References
-
- Taniguchi N., Kizuka Y. Glycans and cancer: Role of N-glycans in cancer biomarker, progression and metastasis, and therapeutics. Adv. Cancer Res. 2015;126:11–51. - PubMed
-
- Stanley P., Schachter H., Taniguchi N. N-Glycans. In: Varki A., Cummings R.D., Esko J.D., Freeze H.H., Stanley P., Bertozzi C.R., Hart G.W., Etzler M.E., editors. Essentials of Glycobiology. 2nd ed. CSHL Press; Cold Spring Harbor, NY, USA: 2009. - PubMed
Publication types
MeSH terms
Substances
LinkOut - more resources
Full Text Sources
Medical
Molecular Biology Databases
Research Materials

