. 2019 May:531:171-182.
doi: 10.1016/j.virol.2019.03.008. Epub 2019 Mar 16.

HPV type 16 E6 and NFX1-123 augment JNK signaling to mediate keratinocyte differentiation and L1 expression

Affiliations

HPV type 16 E6 and NFX1-123 augment JNK signaling to mediate keratinocyte differentiation and L1 expression

Justine Levan et al. Virology. 2019 May.

Abstract

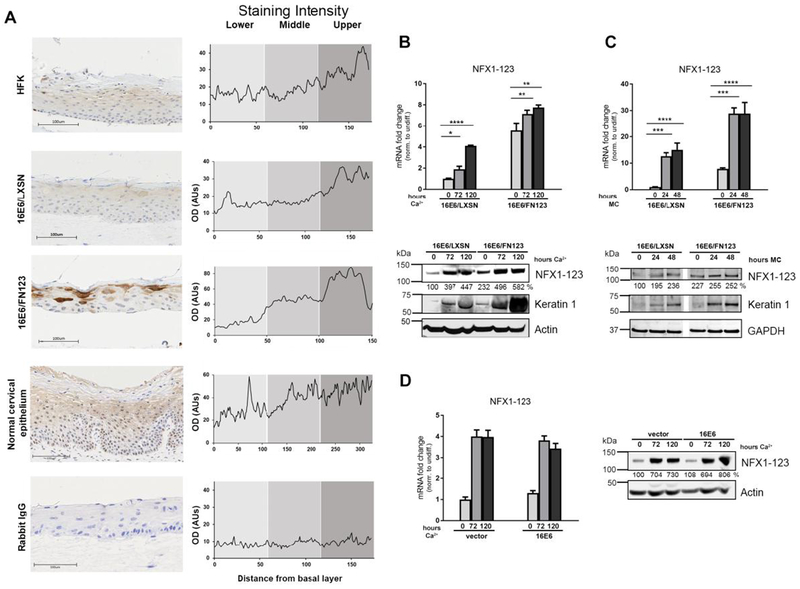
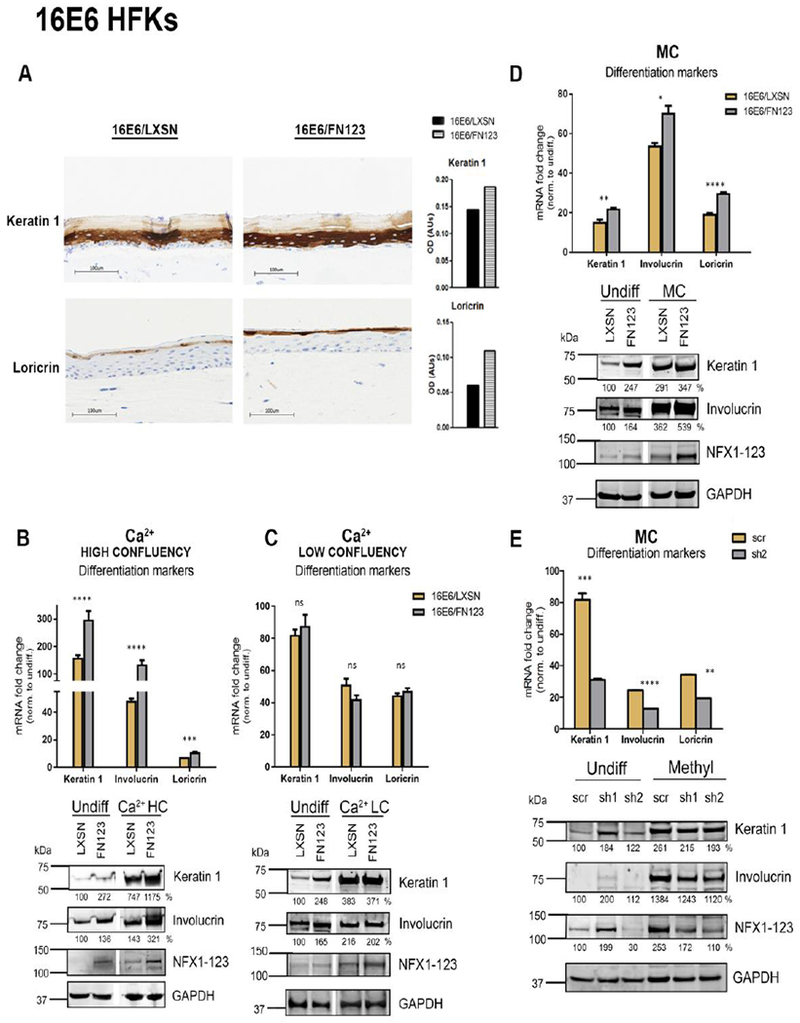
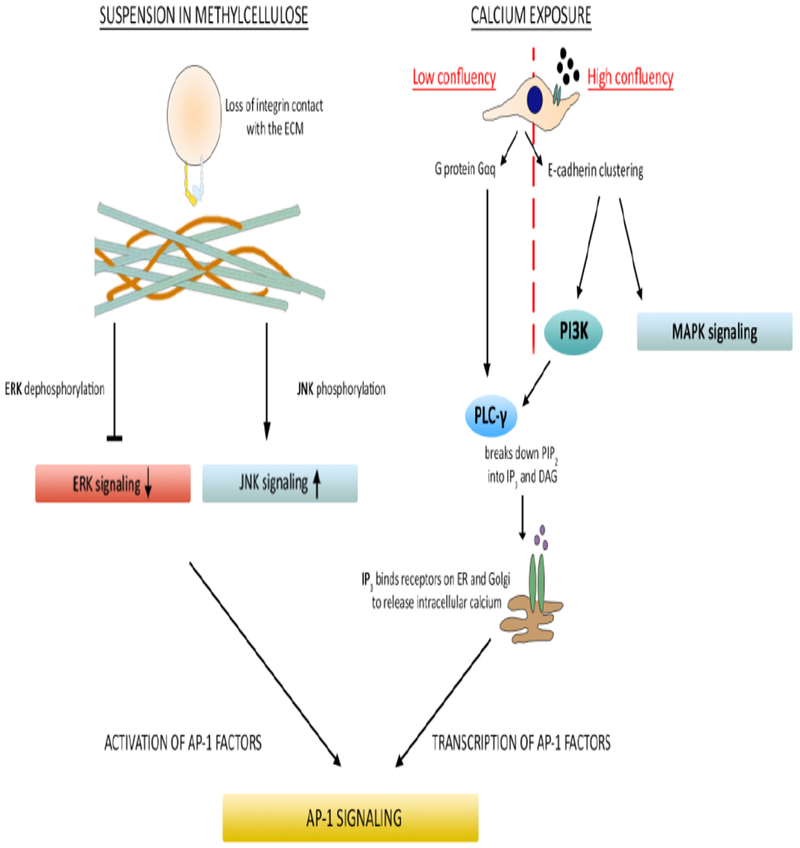
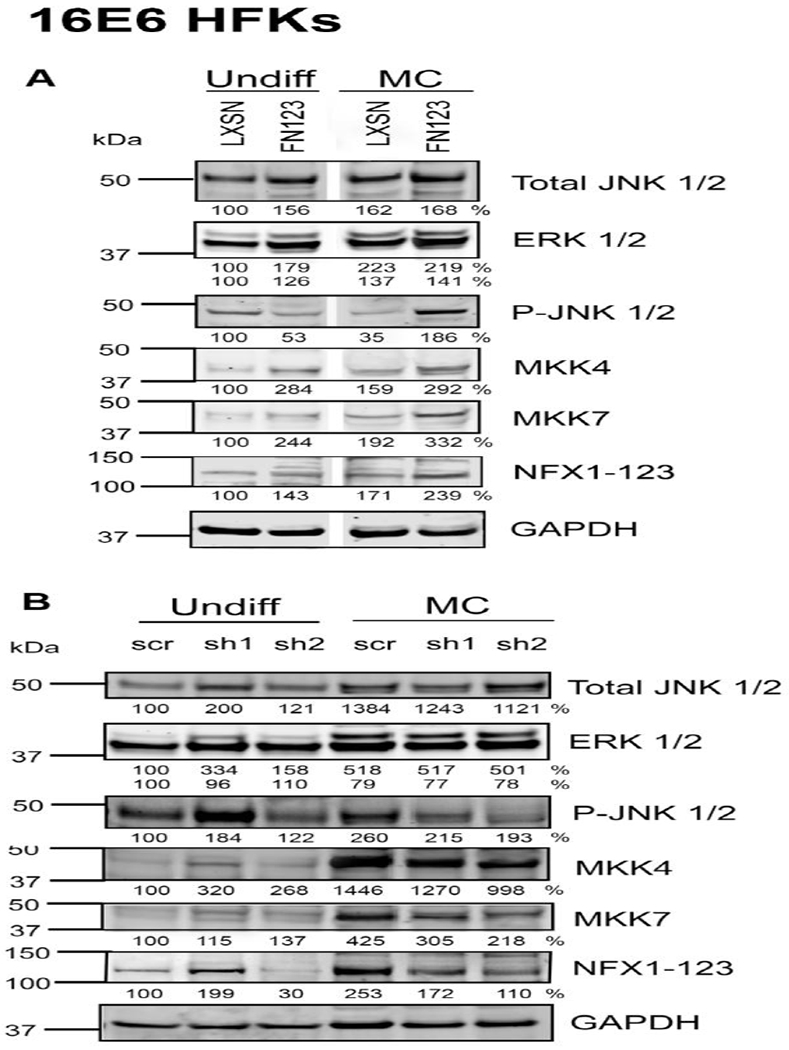
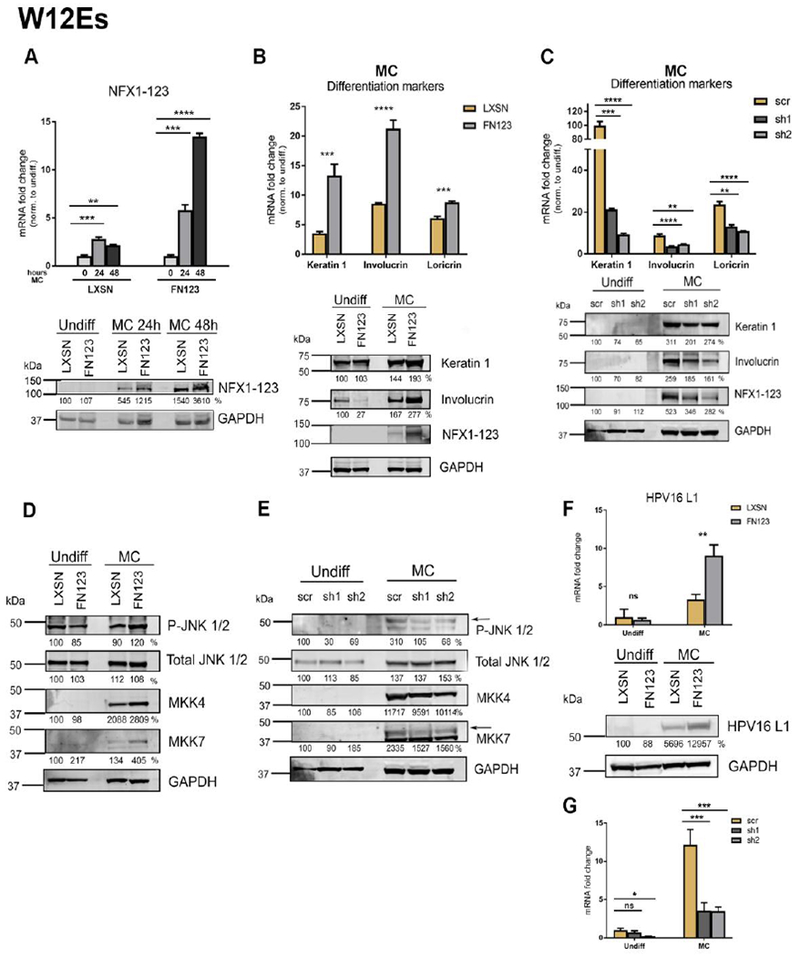
The HPV life cycle is differentiation-dependent, with cellular differentiation driving initiation of the late, productive stage of the viral life cycle. Here, we identify a role for the protein NFX1-123 in regulating keratinocyte differentiation and events of the late HPV life cycle. NFX1-123 itself increased with differentiation of epithelial cells. Greater NFX1-123 augmented differentiation marker expression and JNK phosphorylation in differentiating 16E6-expressing human foreskin keratinocytes (16E6 HFKs). This was associated with altered expression of MKK4 and MKK7, upstream kinase regulators of JNK phosphorylation. Modulating levels of NFX1-123 in HPV16-positive W12E cells recapitulated the effects on differentiation markers, JNK phosphorylation, and MKK4/7 seen in 16E6 HFKs. Crucially, levels of NFX1-123 also correlated with expression of L1, the capsid protein of HPV. Altogether, these studies define a role for NFX1-123 in mediating epithelial differentiation through the JNK signaling pathway, potentially linking expression of cellular genes and HPV genes during differentiation.

Keywords: Differentiation; HR E6; HR HPV; Keratinocyte; NFX1–123.


Figures

Fig 1.
Fig 1.. NFX1-123 expression increases with keratinocyte differentiation.
(A) Organotypic raft cultures were grown using HFKs, HFKs serially transduced with 16E6 and vector control (16E6/LXSN), and HFKs transduced with 16E6 and FLAG-tagged NFX1-123 overexpression construct (16E6/FN123). These rafts and normal cervical epithelial biopsies were stained for NFX1-123 protein via immunohistochemistry or stained using a rabbit polyclonal IgG as a control. Staining intensity was measured over a linear distance from the basal layer in ImageJ and the average of four plots over two sections is shown. (B and C) 16E6/LXSN and 16E6/FN123 HFKs were differentiated with 1.8mM Ca2+ treatment for 0, 72, or 120 hours (B) or suspension in 1.7% methylcellulose medium (MC) (C) and total mRNA and protein collected. Mean expression of NFX1-123 mRNA was measured by qPCR and compared to 16E6/LXSN 0 hours. Protein levels of NFX1-123 were measured by Western blot using actin or GAPDH as a loading control. Induction of the differentiation marker Keratin 1 indicates successful differentiation. White spaces in Western blots indicate removal of empty or irrelevant lanes from original image for clarity. (D) HFKs transduced with empty vector or with 16E6 were differentiated with 1.8mM Ca2+ treatment for 0, 72, or 120 hours, and total mRNA and protein collected. Mean expression of NFX1-123 mRNA was measured by qPCR and each sample was compared to HFK/vector 0 hours. Protein levels of NFX1-123 were measured by Western blot using actin as a loading control. For B, C, and D, mRNA expression of NFX1-123 for each sample was normalized to the housekeeping gene 36B4, and all error bars represent 95% confidence intervals from replicates. Protein expression of NFX1-123 for each sample was quantified using ImageJ and normalized to the loading control for that sample. One representative experiment is shown from at least three conducted in biologically independent HFK cell lines. Statistical significance was calculated using one-way ANOVA with Bonferroni correction. * p≤0.05, ** p≤0.01, *** p≤0.001, **** p≤0.0001
Fig 2.
Fig 2.. NFX1-123 regulates expression of differentiation markers in 16E6 HFKs.
(A) 16E6/LXSN and 16E6/FN123 raft cultures were stained for protein expression of differentiation markers Keratin 1 and Loricrin via immunohistochemistry. Total staining intensity for the section area was calculated in ImageJ. (B and C) 1×10⁶ 16E6/LXSN and 16E6/FN123 HFKs (B) or 3×10⁵ 16E6/LXSN and 16E6/FN123 HFKs (C) were plated and treated with 1.8mM Ca2+ for 0 or 72 hours, and total mRNA and protein collected. (D) 1×10⁶ 16E6/LXSN and 16E6/FN123 HFKs were suspended in methylcellulose (MC) for 0 or 24 hours, and total mRNA and protein collected. (B, C, and D) mRNA levels of Keratin 1, Involucrin, and Loricrin were measured by qPCR and compared to 16E6/LXSN 0 hours. Protein levels of Keratin 1, Involucrin, and NFX1-123 were assessed by Western blot. GAPDH was used as a loading control. Densitometry analysis was done in ImageJ. Protein levels were normalized to the loading control, and all samples compared to undifferentiated 16E6/LXSN. Statistical significance was calculated using unpaired t-tests. White spaces in Western blots indicate removal of empty or irrelevant lanes from original image for clarity. (E) 16E6 HFKs were transduced with short hairpins targeting NFX1-123 (sh1 and sh2) or scramble short hairpin control (scr). 1×10⁶ scr, sh1, and sh2 cells were suspended in methylcellulose (MC) for 0 or 24 hours, and total mRNA and protein collected. mRNA levels of Keratin 1, Involucrin, and Loricrin were measured by qPCR and compared to scr 0 hours. Statistical significance was calculated using one-way ANOVA with Bonferroni correction. Protein levels of Keratin 1, Involucrin, and NFX1-123 were assessed by Western blot. GAPDH was used as a loading control. Densitometry analysis was done in ImageJ. Protein levels were normalized to the loading control, and all samples compared to undifferentiated 16E6/scr. For B, C, D, and E, expression levels of genes of interest were normalized to the housekeeping gene GAPDH, and all error bars represent 95% confidence intervals from replicates. One representative experiment is shown from at least three conducted in biologically independent HFK cell lines. * p≤0.05, ** p≤0.01, *** p≤0.001, **** p≤0.0001
Fig 3.
Fig 3.. Diagram of intracellular signaling pathways activated by differentiation stimuli.
A representation of the intracellular signaling pathways known to be activated by differentiation stimuli used in Figures 1 and 2. Following suspension in methylcellulose, phosphorylation and signaling activity of extracellular signal-regulated kinase (ERK) decreases. Phosphorylation and signaling activity of c-Jun N-terminal kinase (JNK) increases. This leads to activation of AP-1 transcription factors and subsequent transcriptional expression of differentiation markers. For cells plated at low confluency, exposure to extracellular calcium activates the G protein Gαq, which in turn activates phospholipase C gamma (PLC-γ). PLC-γ hydrolyzes the second messenger phosphatidylinositol 4,5-bisphosphate (PIP2) and activates a series of reactions that lead to the transcription of AP-1 subunits, AP-1 signaling and subsequent transcriptional expression of differentiation markers. For cells plated at high confluency, exposure to extracellular calcium leads to E-cadherin clustering, activating mitogen-activated protein kinase (MAPK) and phosphoinositide 3-kinase (PI3K) activity. PI3K activates PLC-γ and here, the pathway converges with that of low confluency cells treated with calcium terminating in AP-1 signaling and transcription of differentiation markers.
Fig 4.
Fig 4.. NFX1-123 regulates phosphorylation of JNK through MKK4 and MKK7.
(A) 1×10⁶ 16E6/LXSN and 16E6/FN123 HFKs were suspended in methylcellulose (MC) for 0 or 24 hours, and total protein collected. Protein levels of phosphorylated JNK (P-JNK), total JNK, total ERK, total MKK4, and total MKK7 were assessed by Western blot. GAPDH was used as a loading control. Densitometry analysis was done in ImageJ. Protein levels were normalized to the loading control, and all samples compared to undifferentiated 16E6/LXSN. White spaces in Western blots indicate removal of empty or irrelevant lanes from original image for clarity. (B) 16E6 HFKs were transduced with a short hairpin targeting NFX1-123 (sh1 or sh2) or a scramble short hairpin control (scr). 1×10⁶ scr, sh1, and sh2 cells were suspended in methylcellulose for 0 or 24 hours, and total protein collected. Protein levels of P-JNK, total JNK, total ERK, total MKK4, and total MKK7 were assessed by Western blot. Densitometry analysis was done in ImageJ. Protein levels were normalized to the loading control, and all samples compared to undifferentiated scr. For A and B, one representative experiment is shown from at least three conducted in biologically independent HFK cell lines.
Fig 5.
Fig 5.. NFX1-123 mediates differentiation and L1 expression in HPV16-positive W12E cells.
(A) W12E cells were transduced with LXSN control vector (LXSN) or FLAG-tagged NFX1-123 overexpression construct (FN123) and 1×10⁶ cells were suspended in methylcellulose (MC) for 0, 24, or 48 hours. Mean expression of NFX1-123 mRNA measured by qPCR and compared to LXSN 0 hours. Protein levels of NFX1-123 were measured by Western blot using GAPDH as a loading control. (B) 1.5×10⁶ LXSN and FN123 W12E cells were suspended in methylcellulose (MC) for 24 hours and total mRNA and protein collected. mRNA levels of Keratin 1, Involucrin, and Loricrin were measured by qPCR and compared to W12E/LXSN 0 hours. Statistical significance was calculated using unpaired t-tests. Protein levels of Keratin 1, Involucrin, and NFX1-123 were assessed by Western blot. GAPDH was used as a loading control. Protein levels were normalized to the loading control, and all samples compared to undifferentiated LXSN. (C) W12E cells were transduced with a short hairpin targeting NFX1-123 (sh1 or sh2) or a scramble short hairpin control (scr), and 1.5×10⁶ cells differentiated by suspension in methylcellulose for 0 or 24 hours. mRNA expression of Keratin 1, Involucrin, and Loricrin was measured by qPCR and compared to scr 0 hours. Statistical significance was calculated using one-way ANOVA with Bonferroni correction and p values for the difference in means between scr and sh1 or sh2 are shown. Protein levels of Keratin 1, Involucrin, and NFX1-123 were measured by Western blot using GAPDH as a loading control. (D and E) Protein levels of P-JNK, total JNK, total ERK, total MKK4, and total MKK7 were assessed by Western blot in LXSN and FN123 W12E cells (D) or scr, sh1, and sh2 W12E cells (E). (F) mRNA expression levels of HPV16 L1 were measured by qPCR and compared to LXSN or scr W12E cells. Protein levels of L1 were assessed by Western blot in LXSN and FN123 W12E cells. (G) . For all qPCRs, expression levels of the genes of interest were normalized to the housekeeping gene GAPDH, and all error bars represent 95% confidence intervals from replicates. For all Western blots, protein levels were normalized to the loading control GAPDH, and all samples compared to the undifferentiated control (LXSN in 5A, B, D, F; or scr in 5C and E). Densitometry analysis was done in ImageJ. All experiments in Figure 5 were performed three independent times. * p≤0.05, ** p≤0.01, *** p≤0.001, **** p≤0.0001

Similar articles

Cited by

References

    1. Doorbar J, Quint W, Banks L, Bravo IG, Stoler M, Broker TR, Stanley MA. 2012. The Biology and Life-Cycle of Human Papillomaviruses. Vaccine 30, Supplement 5:F55–F70. - PubMed
    1. zur Hausen H 2002. Papillomaviruses and cancer: from basic studies to clinical application. Nat Rev Cancer 2:342–350. - PubMed
    1. Bosch FX, Lorincz A, Munoz N, Meijer CJLM, Shah KV. 2002. The causal relation between human papillomavirus and cervical cancer. J Clin Pathol 55:244–265. - PMC - PubMed
    1. Muñoz N, Bosch FX, de Sanjosé S, Herrero R, Castellsagué X, Shah KV, Snijders PJF, Meijer CJLM, International Agency for Research on Cancer Multicenter Cervical Cancer Study Group. 2003. Epidemiologic classification of human papillomavirus types associated with cervical cancer. N Engl J Med 348:518–527. - PubMed
    1. zur Hausen H 2009. Papillomaviruses in the causation of human cancers — a brief historical account. Virology 384:260–265. - PubMed

Publication types

MeSH terms

Substances