. 2019 Mar 13;11(483):eaaq1238.
doi: 10.1126/scitranslmed.aaq1238.

ZEB1 suppression sensitizes KRAS mutant cancers to MEK inhibition by an IL17RD-dependent mechanism

Affiliations

ZEB1 suppression sensitizes KRAS mutant cancers to MEK inhibition by an IL17RD-dependent mechanism

David H Peng et al. Sci Transl Med. .

Abstract

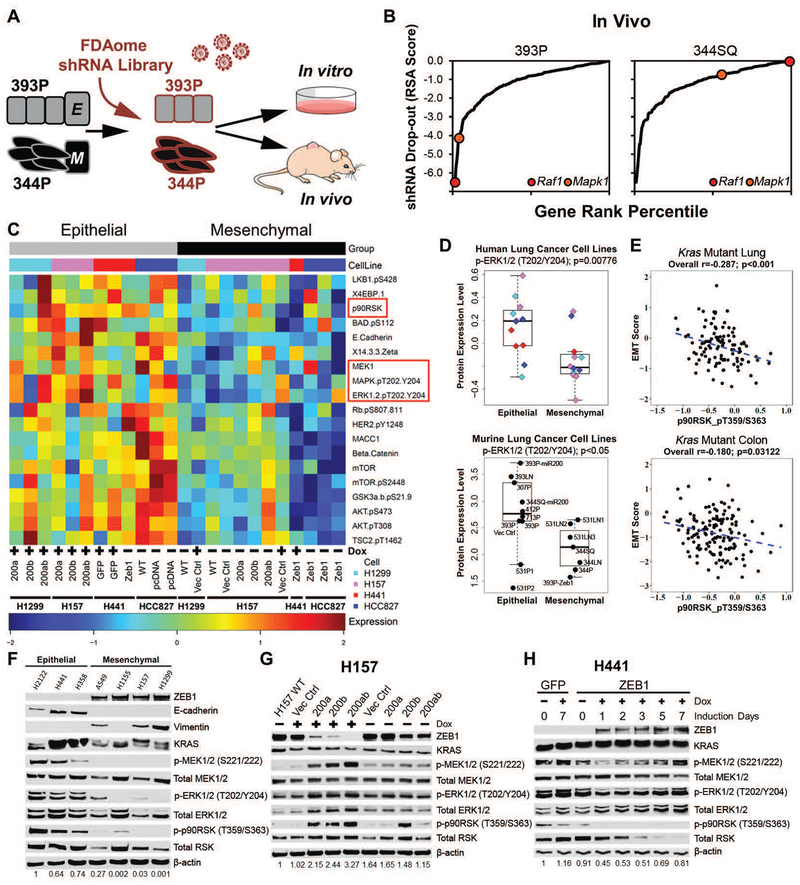
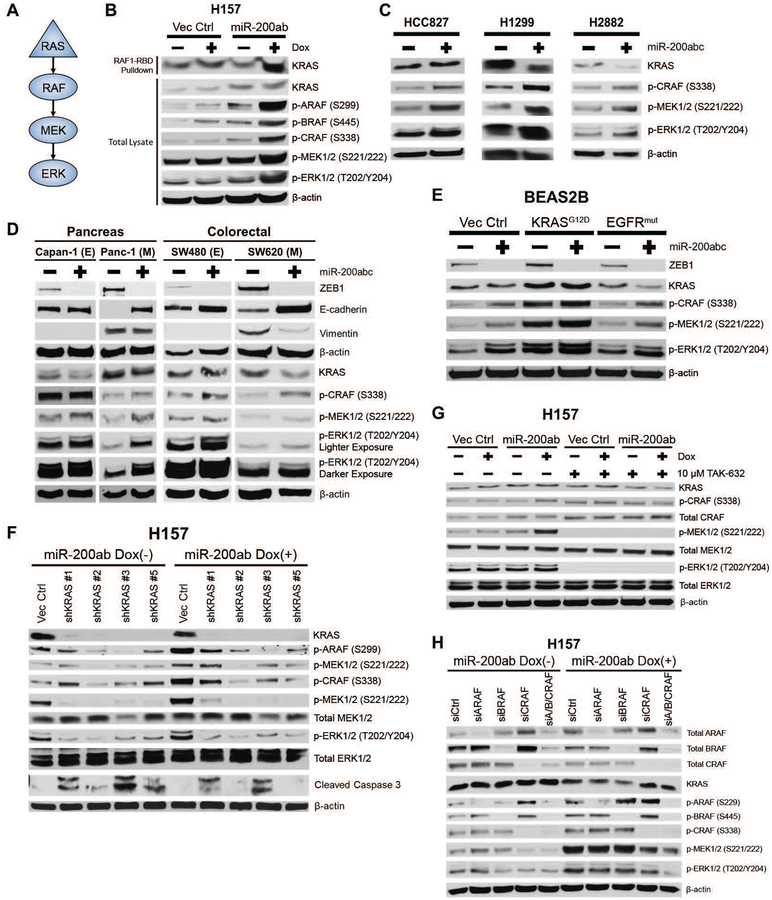
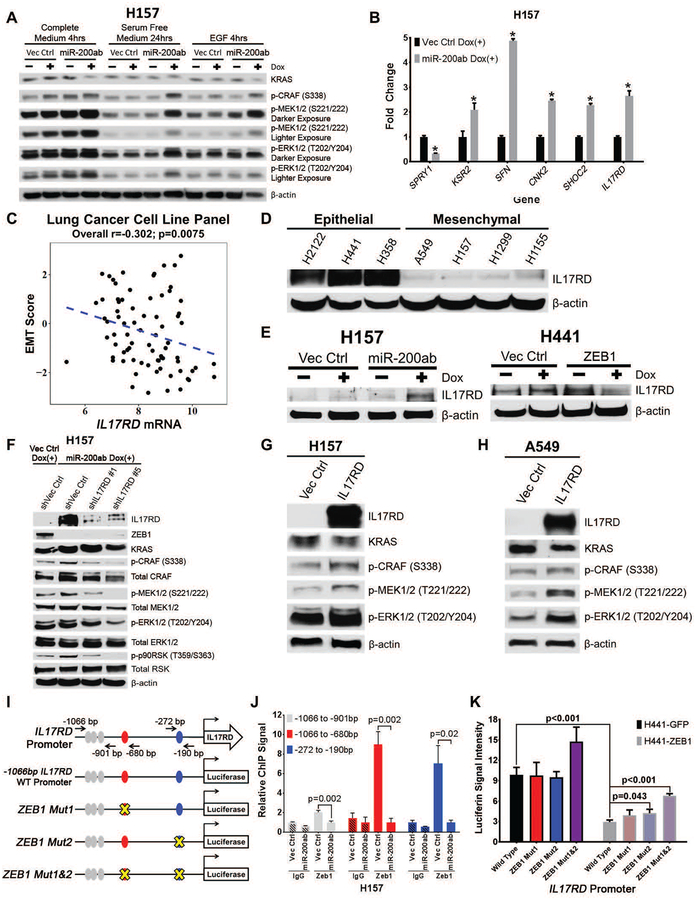
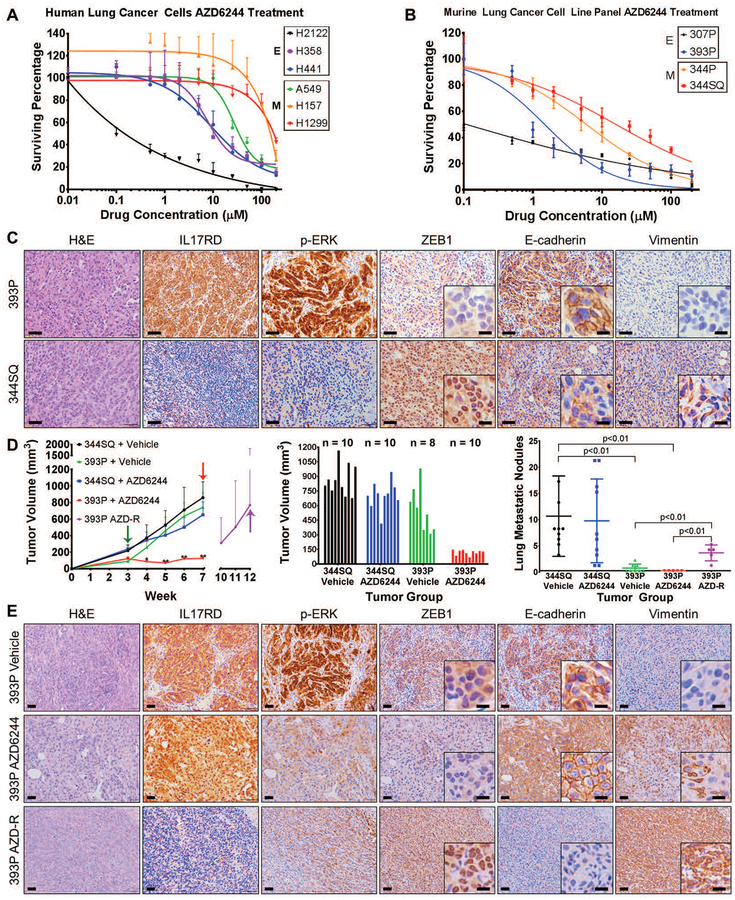
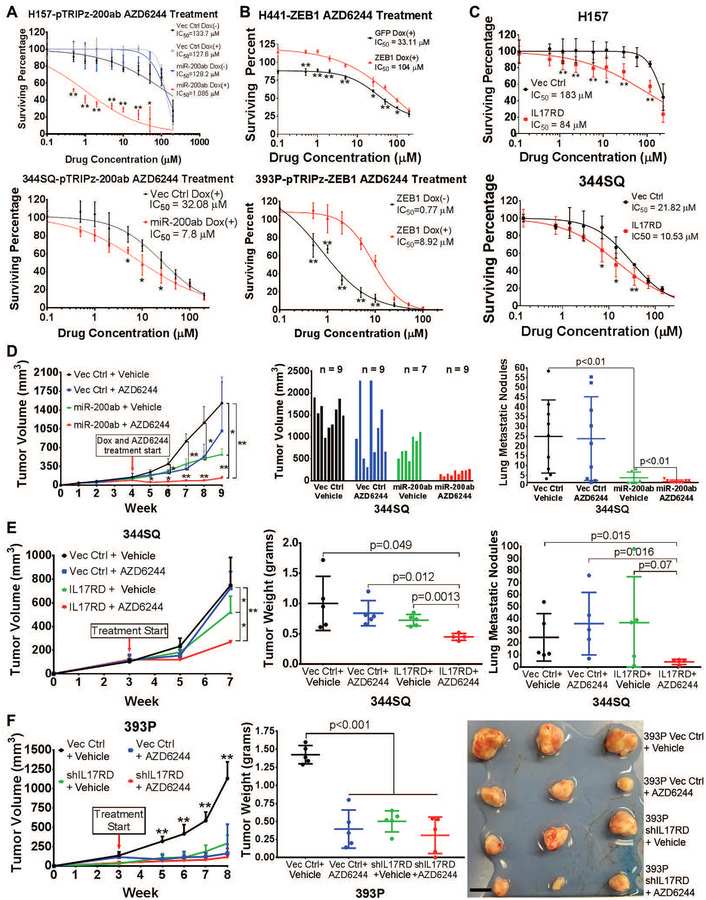
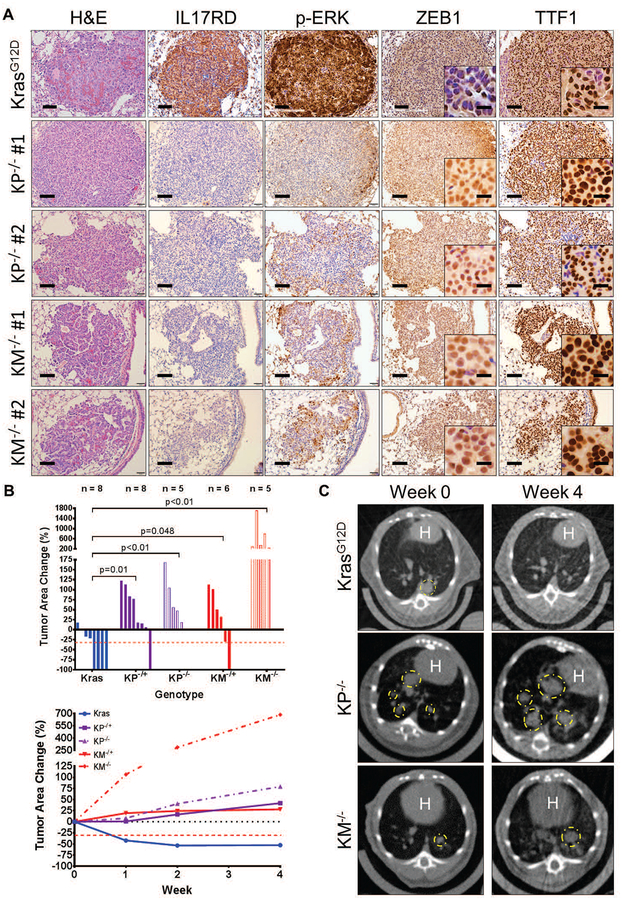
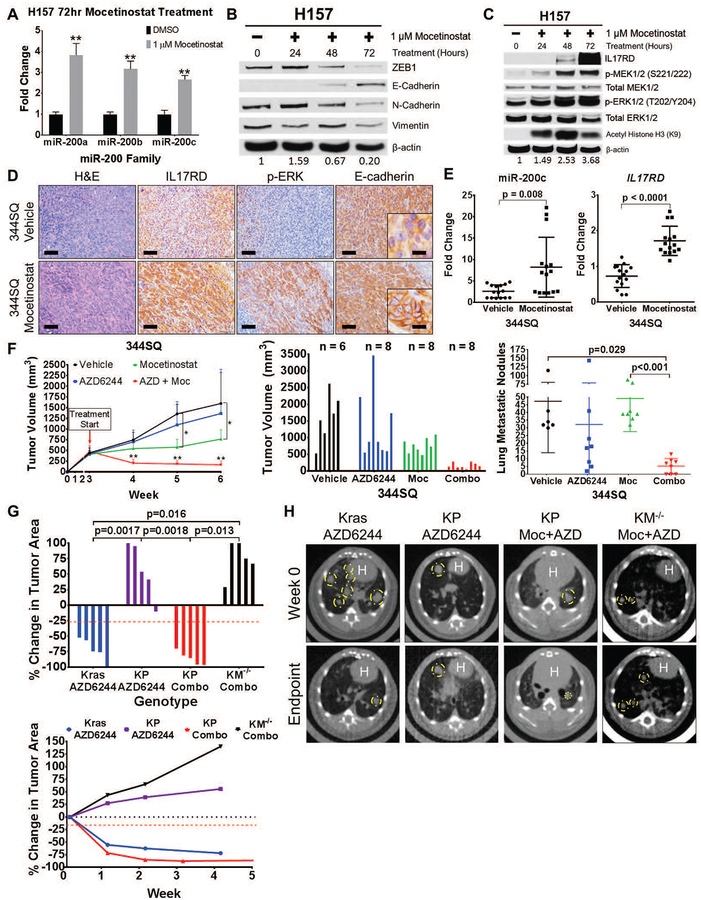
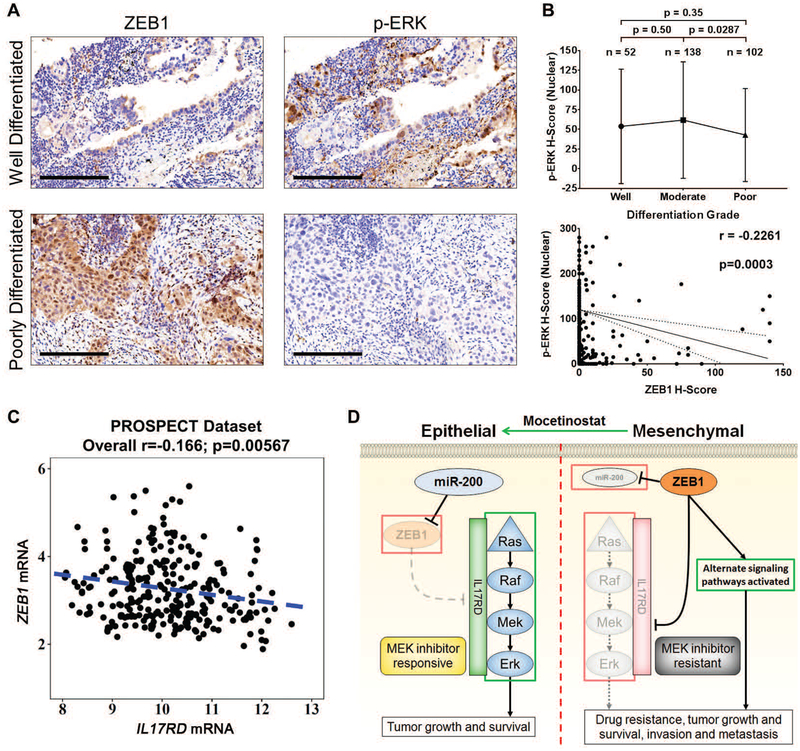
Mitogen-activated protein kinase (MAPK) kinase (MEK) inhibitors have failed to show clinical benefit in Kirsten rat sarcoma (KRAS) mutant lung cancer due to various resistance mechanisms. To identify differential therapeutic sensitivities between epithelial and mesenchymal lung tumors, we performed in vivo small hairpin RNA screens, proteomic profiling, and analysis of patient tumor datasets, which revealed an inverse correlation between mitogen-activated protein kinase (MAPK) signaling dependency and a zinc finger E-box binding homeobox 1 (ZEB1)-regulated epithelial-to-mesenchymal transition. Mechanistic studies determined that MAPK signaling dependency in epithelial lung cancer cells is due to the scaffold protein interleukin-17 receptor D (IL17RD), which is directly repressed by ZEB1. Lung tumors in multiple Kras mutant murine models with increased ZEB1 displayed low IL17RD expression, accompanied by MAPK-independent tumor growth and therapeutic resistance to MEK inhibition. Suppression of ZEB1 function with miR-200 expression or the histone deacetylase inhibitor mocetinostat sensitized resistant cancer cells to MEK inhibition and markedly reduced in vivo tumor growth, showing a promising combinatorial treatment strategy for KRAS mutant cancers. In human lung tumor samples, high ZEB1 and low IL17RD expression correlated with low MAPK signaling, presenting potential markers that predict patient response to MEK inhibitors.


Conflict of interest statement

Competing Interests: D.L.G. declares advisory board work for Janssen, AstraZeneca, GlaxoSmithKline and Sanofi. D.L.G. receives research grant funding from AstraZeneca, Janssen, and Takeda. L.A.B. declares consulting work for AstraZeneca, AbbVie, GenMab, BergenBio, Pharma Mar, SA. L.A.B. receives research grant funding from AbbVie, AstraZeneca, GenMab, Tolero Pharmaceuticals. All other authors declare that they have no competing interests.

Figures

Fig. 1.
Fig. 1.. Epithelial tumors have greater MAPK signaling dependency for growth
(A) Experimental design for FDAome shRNA drop-out screens in epithelial (393P) and mesenchymal (344P) murine lung cancer cell lines implanted subcutaneously in vivo (nude mice) and grown in parallel in vitro (20 doublings). (B) Gene rank analysis highlighting the behavior of RAF1 and MAPK1 genes in the FDAome in vivo screens executed in epithelial (393P) and mesenchymal (344P) murine lung cancer cell lines. ShRNA dropout score was calculated as the log of the redundant shRNA activity (RSA) value shown in table S1 in data file S1. (C) Heatmap of reverse phase protein array (RPPA) profile showing statistically significant (p<0.05) differentially regulated proteins in isogenically-matched epithelial and mesenchymal human lung cancer cell lines. Cell lines expressed doxycycline (Dox) inducible miR-200 or ZEB1, as indicated. ZEB1 was constitutively expressed in HCC827 cells, rather than Dox-inducible. (D) Dot plot of ERK phosphorylation (T202/Y204) from RPPA dataset in a panel of mesenchymal and epithelial murine (epithelial: 393P, 393P Vector Control, 393P-miR200, 393LN, 307P, 412P, 713P, 531P1, 531P2, 344SQ-miR200; mesenchymal: 531LN1, 531LN2, 531LN3, 344P, 344LN, 344SQ, 393P-Zeb1) and human lung cancer cells. (E) Cluster plot analysis of Spearman’s rank correlation between EMT score and the activated downstream MAPK signaling molecule p-p90RSK (T359/S363) in KRAS mutant lung and colorectal cancer patient samples from TCGA RPPA datasets. (F) Western blot of the EMT markers ZEB1, E-cadherin, and vimentin and MAPK signaling molecules in a panel of human KRAS mutant lung cancer cell lines. Numbers at the bottom indicate relative quantification of western blot signal for p-ERK, relative to β-actin. (G and H) Western blot of indicated proteins in (G) H157 cells after Dox-induced miR-200 expression for 7 days and (H) H441 cells after Dox-induced ZEB1 expression at the indicated time points. Numbers at the bottom indicate relative quantification of western blot signal for p-ERK, relative to β-actin.
Fig. 2.
Fig. 2.. RAS-RAF-MEK-ERK regulate MAPK signaling in epithelial cancer cells
(A) Schematic of RAS-RAF-MEK-ERK MAPK pathway signaling. (B) Top: Western blot of KRAS from RAS-GTP pulldown with the RAS binding domain (RBD) of RAF1 after miR-200ab induction in mesenchymal H157 lung cancer cell line. Bottom: Western blots of whole cell lysates of MAPK signaling molecules in H157 cells with induced miR-200 expression. (C) Western blots of MAPK signaling proteins in HCC827 (EGFR mutant), H1299 (NRAS mutant), and H2882 (EGFR and NRAS WT) human lung cancer cell lines after 96-hour transient expression of miR-200abc. (D) Western blot of ZEB1, E-cadherin, and vimentin and MAPK signaling proteins in epithelial (E) and mesenchymal (M) KRAS mutant pancreatic and colorectal cancer cell lines after 6-day transient expression of miR-200a/b/c. (E) Western blots of MAPK signaling proteins in non-transformed BEAS2B epithelial human lung cell lines expressing mutant KRAS or mutant EGFR in conjunction with transient expression of miR-200a/b/c. (F – H) Western blots of MAPK signaling proteins in H157 cells with induced miR-200ab expression after (F) KRAS knockdown by shRNA, (G) inhibition of pan-RAF enzymatic activity for 24 hours with TAK-632, and (H) 48-hour siRNA-mediated knockdown of RAF isoforms individually or in combination.
Fig. 3.
Fig. 3.. ZEB1 regulates MAPK signaling by suppressing the scaffold protein IL17RD
(A) Western blot of MAPK signaling molecules in H157 cells +/− miR-200 expression after 24 hours of serum-free starvation, followed by stimulation with complete serum medium, serum-free medium, or EGF for 4 hours. (B) QPCR analysis for relative expression of SPRY1, KSR2, 14-3-3σ/SFN, CNK2, SHOC2, and IL17RD in H157 cells with inducible miR-200 expression. *p<0.05. (C) Cluster plot analysis of Spearman’s rank correlation between IL17RD gene expression and EMT scores of 77 human lung cancer cell lines. (D and E) Western blots of IL17RD in (D) a panel of human epithelial and mesenchymal KRAS mutant lung cancer cell lines and (E) H157 or H441 cells with induced miR-200 or ZEB1 expression, respectively. (F) Western blot of IL17RD and MAPK signaling molecules after transient shRNA knockdown of IL17RD in H157 cells with induced miR-200 expression for 72 hours. (G and H) Western blots of IL17RD and MAPK signaling molecules after 48-hour constitutive expression of IL17RD in (G) H157 and (H) A549 cells. (I) Schematic of human IL17RD promoter region containing predicted ZEB1 binding sites represented by color-coded ellipses. Black arrows indicate location of genomic region used for qPCR amplification, containing potential ZEB1 binding sites in the IL17RD promoter after ZEB1 chromatin immunoprecipitation (ChIP). The IL17RD promoter was cloned 1,066 base pairs upstream of the transcriptional start site and inserted into a luciferase reporter vector. Mutations of potential ZEB1 binding sites indicated with yellow X. (J) Fold enrichment by qPCR analysis of IL17RD promoter segments containing potential ZEB1 binding sites after endogenous ZEB1 ChIP in H157 cells with inducible vector control or miR-200 expression, using ZEB1 antibody or IgG control antibody. Promoter regions analyzed by qPCR labeled with black arrows in (I). (K) Relative luciferase activity of IL17RD promoter reporter constructs in (I) transfected into epithelial H441 cells with induced GFP control or ZEB1 expression. Relative luciferin signal was normalized to promoter-less vector control signal.
Fig. 4.
Fig. 4.. Lung cancer cells and tumors with high ZEB1 are resistant to MEK inhibition
(A and B) In vitro cell survival response after 72-hour selumetinib (AZD6244) treatment in a panel of epithelial and mesenchymal (A) human and (B) murine RAS mutant lung cancer cell lines. (C) H&E, IL17RD, p-ERK, ZEB1, E-cadherin, and vimentin IHC stains of primary tumor tissues generated by subcutaneous injection of epithelial 393P and mesenchymal 344SQ murine lung cancer cell lines in syngeneic wild-type mice (n=8 tumors per group). Scale bars, 100 μm. Inset scale bars, 20 μm. (D) Left: In vivo volume measurements at the indicated time points for 393P and 344SQ subcutaneous tumors in syngeneic wild-type mice after daily treatment with 25 mg/kg AZD6244 MEK inhibitor or vehicle control. Treatment start time denoted by green arrow, endpoint denoted by red arrows, and resistant tumors denoted by purple arrow. Treatment performed in experimental duplicate with 4 to 5 mice per replicate in each treatment group. Sample size is as indicated in the middle graph. Tumor volume data plotted as the mean and standard deviation. Purple data points represent 393P tumors that were initially responsive to MEK inhibition and developed resistance over time. Middle: Tumor volume measurements at Week 7 (at the endpoint, after 4 weeks of AZD6244 treatment). Right: Quantification of lung metastatic surface nodules in the indicated experimental groups at Week 7 of the experiment or at Week 12 in 393P tumors that developed resistance to AZD6244 (393P AZD-R). *: p<0.05, **: p<0.01. (E) Stains for the indicated markers in 393P tumors in mice that received vehicle or AZD6244 until Week 7 of the experiment in (D) (top and middle panels), or in tumors that developed resistance to AZD6244 (393P AZD-R) at Week 12 of the experiment in (D) (bottom panel). Scale bars, 50 μm. Inset scale bars, 20 μm. Images are representative of n=5 tissues per group.
Fig. 5.
Fig. 5.. MiR-200 or IL17RD sensitizes mesenchymal lung tumors to MEK inhibition
(A-C) In vitro cell survival response after 72 hours of AZD6244 treatment in: (A) Mesenchymal human H157 (top) and murine 344SQ (bottom) cells with or without inducible miR-200 expression. *: p<0.05, **: p<0.01. (B) Epithelial human H441 (top) and murine 393P (bottom) cells with or without inducible ZEB1 expression. *: p<0.05, **: p<0.01. (C) Mesenchymal human H157 (top) and murine 344SQ (bottom) cells with stable vector control or IL17RD expression. *: p<0.05, **: p<0.01. (D) Left: In vivo subcutaneous tumor volume measurements at the indicated time points for 344SQ tumors +/− doxycycline-inducible miR-200 expression, treated daily with AZD6244 or vehicle control. Starting time of treatment denoted by red arrow. Treatment performed in experimental duplicate with 3 to 5 mice per replicate and total sample size denoted in the middle graph. Tumor volume data plotted as the mean and standard deviation. Middle: Final tumor volume measurements at Week 9 of experiment (5 weeks of treatment). Right: Quantification of lung metastatic surface nodules in the indicated experimental groups at Week 9 of experiment. *: p<0.05, **: p<0.01. (E) Left: In vivo subcutaneous tumor volume measurements at the indicated time points for 344SQ tumors +/− IL17RD expression, treated daily with AZD6244 or vehicle control. Starting time of treatment denoted by red arrow; n=4 to 5 mice per treatment group. Tumor volume data plotted as the mean and standard deviation. *: p<0.05, **: p<0.01. Middle: Final tumor weight measurements at Week 7 of experiment (4 weeks of treatment). Right: Quantification of lung metastatic surface nodules in the indicated experimental groups at Week 7 of experiment. (F) Left: In vivo subcutaneous tumor volume measurements at the indicated time points for 393P tumors +/− IL17RD knockdown, treated daily with AZD6244 or vehicle control starting at the time indicated by the red arrow; n = 5 mice per treatment group. Tumor volume data plotted as the mean and standard deviation. Middle: Final tumor weight measurements at Week 8 of experiment (5 weeks of treatment). Right: Images of 3 representative primary subcutaneous tumors for each of the indicated treatment groups. Scale bar, 1 cm. **: p<0.01.
Fig. 6.
Fig. 6.. ZEB1 expression correlates with decreased IL17RD, decreased MAPK signaling, and MEK inhibitor resistance in KRAS mutant mouse lung tumors
(A) H&E, IL17RD, p-ERK, ZEB1, and TTF1 IHC stains of lung tumor tissue from KrasG12D, KP−/−, and KM−/− mice (n=6 tissues per group). KP and KM lung tumor images show regions from two different mice. Scale bars, 100 μm. Inset scale bars, 20 μm. (B) Top: Percent change in overall lung tumor area of age-matched KrasG12D, KP−/+, KP−/−, KM−/+, and KM−/− mice after 4 weeks of daily treatment with 25 mg/kg AZD6244, as assessed by micro-CT imaging of mouse lungs. Bottom: Trendlines of percent change in overall tumor area at indicated time points for each cohort over 4 weeks of daily treatment with AZD6244. Mouse sample sizes are indicated in the top graph. Percent change in tumor volume data plotted as the mean. (C) Representative cross-sectional micro-CT images of KrasG12D, KP−/−, and KM−/− mouse lungs before AZD6244 administration (Week 0) and at the treatment endpoint (Week 4). Yellow circles outline representative target lesions. White “H” indicates mouse heart.
Fig. 7.
Fig. 7.. Mocetinostat increases miR-200 and IL17RD expression and sensitizes resistant tumor cells to MEK inhibition
(A) QPCR analysis for relative expression of miR-200a, miR-200b, and miR-200c in H157 cells after 72 hours of treatment with mocetinostat. **: p<0.01. (B) Western blots of EMT markers in H157 cells after treatment with mocetinostat for the indicated time course. (C) Western blots of IL17RD and MAPK signaling proteins in H157 cells after treatment with mocetinostat for the indicated time course. Acetylated histone (H3K9) is included to confirm HDAC inhibition by mocetinostat. (D) H&E, IL17RD, p-ERK, and E-cadherin IHC stains of primary 344SQ tumor tissues in syngeneic wild-type mice after 3-week treatment with 80 mg/kg mocetinostat or vehicle control daily (n=5 tumors per group). Scale bars, 100 μm, inset scale bars, 20 μm. (E) QPCR analysis of miR-200c and IL17RD expression in 344SQ tumor tissues treated with mocetinostat or vehicle control from (D). Technical triplicates of 5 tumor tissue samples from each treatment group were analyzed for each qPCR. (F) Left: Tumor volume measurements at the indicated time points for 344SQ subcutaneous syngeneic tumors treated daily with single agent 25 mg/kg AZD6244 (AZD), single agent 80 mg/kg mocetinostat (Moc), or both drugs in combination (Combo). Starting time of treatment denoted by red arrow; n=5 mice per treatment group. Tumor volume data plotted as the mean and standard deviation. Middle: Final tumor volume measurements at Week 6 of experiment (3 weeks of treatment). Right: Quantification of lung metastatic surface nodules in the indicated treatment groups at Week 6 of experiment. (G) Top: Percent change in overall tumor area of KrasLA1-G12D (Kras), KrasLA1-G12D;p53R172HΔG/+ (KP), and KM−/− mice after 4 to 5 weeks of daily treatment with single agent 25 mg/kg AZD6244 or daily combinatorial treatment with AZD6244 and 80 mg/kg mocetinostat (Combo). Bottom: Trendline of percent change in overall tumor area at the indicated time points for Kras, KP, and KM mice with single agent AZD6244 treatment or combinatorial treatment with AZD6244 and mocetinostat; n=5 mice per treatment group. Percent change in tumor volume data plotted as the mean. (H) Representative micro-CT images of Kras, KP, and KM−/− mice before treatment (Week 0) and at treatment endpoint (Week 4 or Week 5). White “H” indicates location of mouse heart.
Fig. 8.
Fig. 8.. Lung adenocarcinoma patients with high ZEB1 have lower phosphorylation of ERK
(A) Examples of well- and poorly-differentiated human lung ADC tissue sections stained by IHC for ZEB1 and p-ERK. Scale bars, 200 μm. (B) Top: Nuclear H-scores of p-ERK in ADC specimens of different differentiation grades. Bottom: Cluster plot analysis of Spearman’s rank correlation between ZEB1 and nuclear p-ERK H-scores in ADC specimens. Solid line indicates the linear correlation and dotted lines represent 90% confidence bands. (C) Cluster plot analysis of Spearman’s rank correlation between ZEB1 and IL17RD mRNA expression in human lung cancer patient tumor samples from PROSPECT dataset. (D) Proposed model demonstrating differential MAPK signaling pathway activation and sensitivity to MEK inhibitor treatment between epithelial and mesenchymal lung cancer cells due to ZEB1 regulation of IL17RD expression.

Similar articles

Cited by

References

    1. Sharma SV, Haber DA, Settleman J, Cell line-based platforms to evaluate the therapeutic efficacy of candidate anticancer agents. Nat Rev Cancer 10, 241–253 (2010). - PubMed
    1. Herbst RS, Heymach JV, Lippman SM, Lung cancer. N Engl J Med 359, 1367–1380 (2008). - PMC - PubMed
    1. Rodenhuis S, Slebos RJ, Clinical significance of ras oncogene activation in human lung cancer. Cancer Res 52, 2665s–2669s (1992). - PubMed
    1. Wang Y, Kaiser CE, Frett B, Li H.-y., Targeting Mutant KRAS for Anticancer Therapeutics: A Review of Novel Small Molecule Modulators. Journal of Medicinal Chemistry 56, 5219–5230 (2013). - PMC - PubMed
    1. Mascaux C, Iannino N, Martin B, Paesmans M, Berghmans T, Dusart M, Haller A, Lothaire P, Meert AP, Noel S, Lafitte JJ, Sculier JP, The role of RAS oncogene in survival of patients with lung cancer: a systematic review of the literature with meta-analysis. British journal of cancer 92, 131–139 (2005). - PMC - PubMed

Publication types

MeSH terms