. 2017 Oct 19;27(39):1700489.
doi: 10.1002/adfm.201700489. Epub 2017 Aug 14.

Nanotechnology for Neuroscience: Promising Approaches for Diagnostics, Therapeutics and Brain Activity Mapping

Affiliations

Nanotechnology for Neuroscience: Promising Approaches for Diagnostics, Therapeutics and Brain Activity Mapping

Anil Kumar et al. Adv Funct Mater. .

Abstract

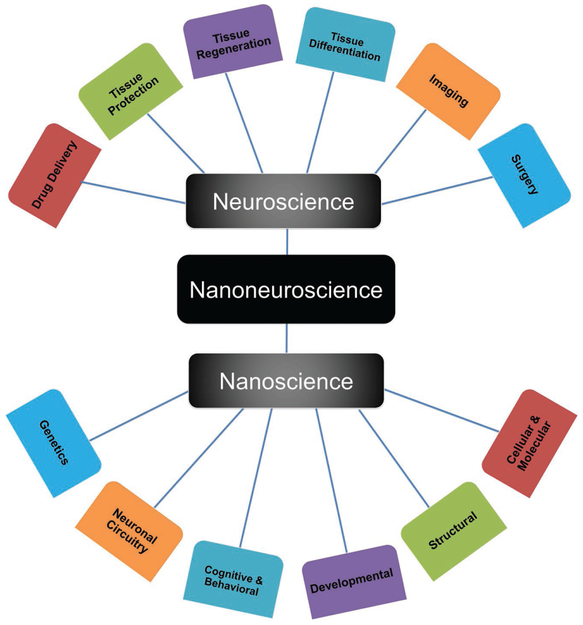
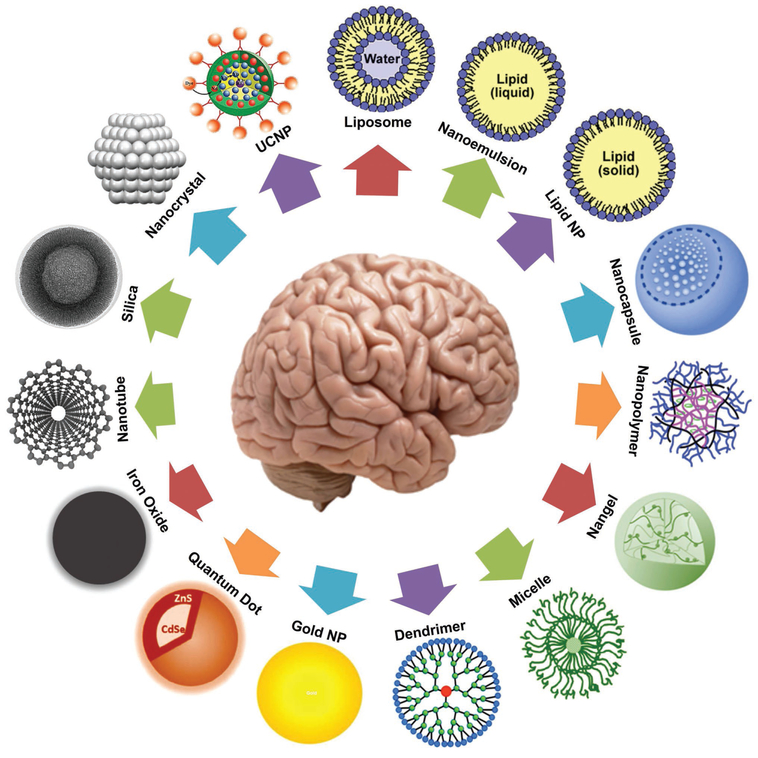
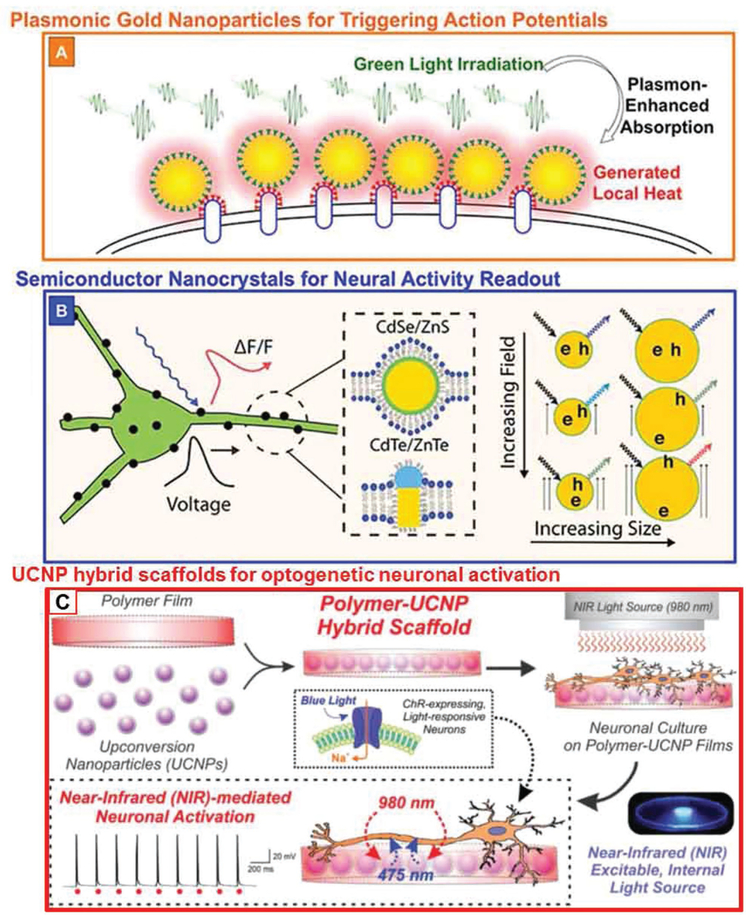
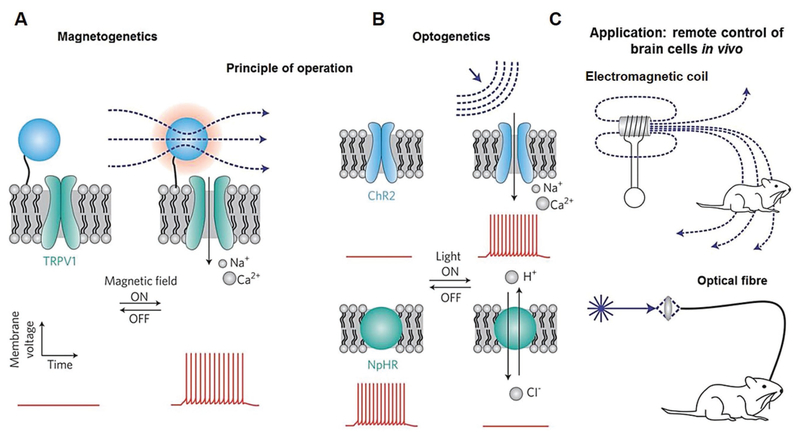
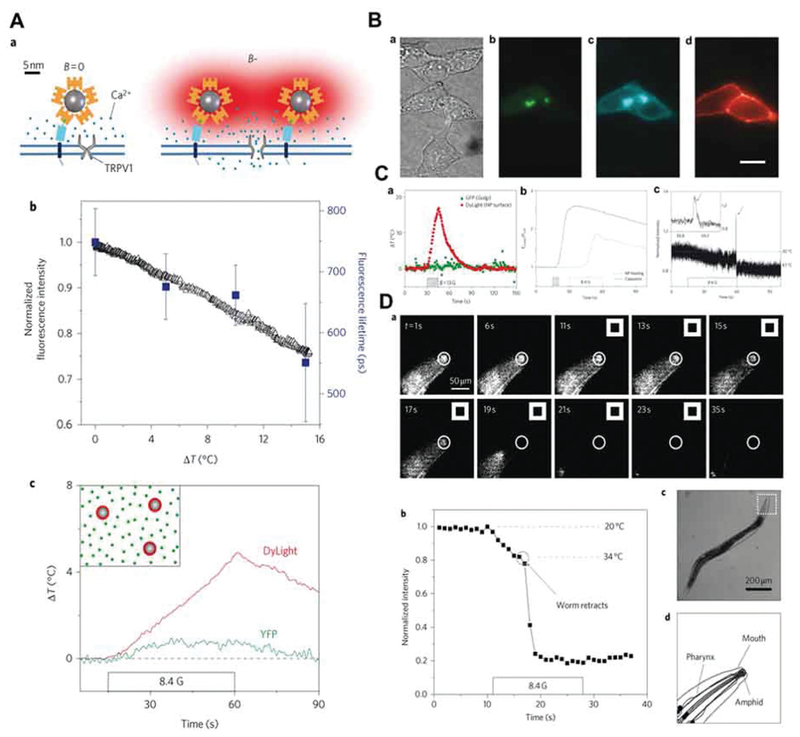
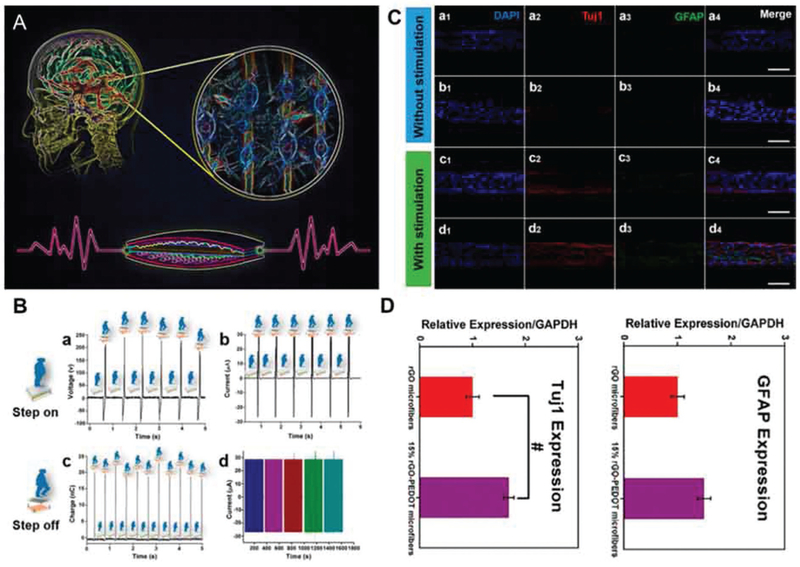
Unlocking the secrets of the brain is a task fraught with complexity and challenge - not least due to the intricacy of the circuits involved. With advancements in the scale and precision of scientific technologies, we are increasingly equipped to explore how these components interact to produce a vast range of outputs that constitute function and disease. Here, an insight is offered into key areas in which the marriage of neuroscience and nanotechnology has revolutionized the industry. The evolution of ever more sophisticated nanomaterials culminates in network-operant functionalized agents. In turn, these materials contribute to novel diagnostic and therapeutic strategies, including drug delivery, neuroprotection, neural regeneration, neuroimaging and neurosurgery. Further, the entrance of nanotechnology into future research arenas including optogenetics, molecular/ion sensing and monitoring, and piezoelectric effects is discussed. Finally, considerations in nanoneurotoxicity, the main barrier to clinical translation, are reviewed, and direction for future perspectives is provided.

Keywords: brain activity mapping (BAM); nanoneuroscience; nanoneurotoxicity; neural regeneration; neuroimaging; optogenetics.


Conflict of interest statement

Conflict of Interest The authors declare no conflict of interest.

Figures

Figure 1.
Figure 1.
Schematic illustration of the relationship between nanotechnology and neuroscience. The two fields are closely intertwined, and it is difficult to clearly separate any one subfield. A new field (nanoneuroscience) is emerging with the combination of two different sciences to gain a better understanding of brain function.
Figure 2.
Figure 2.
Schematic representation of different types of nanoparticle-based platforms and their roles in neuroscience applications. These nanoparticles (NPs) have been extensively used in neuroscience to investigate their potential applications for the diagnosis, treatment and monitoring of several neurological diseases. Some of the polymer NP images were adapted from Gu et al. with modification. Reproduced with permission.[15] Copyright 2011, RSC Publishing. UCNP figure credit: Reproduced with permission.[221] Copyright 2015, ACS Publisihing. Nanocrystal figure credit: Reproduced with permission.[222] Copyright 2012, PNAS Publishing. Silica figure credit: reproduced with permission.[227] Copyright, AMES Laboratory/US Dept of Energy. Nanogel figure credit: reproduced with permission.[223] Copyright 2010, Taylor and Francis Publishing Group. Liposome, nanoemulsion, micelle, lipid NP figure credit: reproduced with permission.[224] Copyright 2014, InTech. Nanocapsule figure credit: Reproduced with permission.[225] Copyright 2015, SCIELO Publishing. Dendrimer figure credit: Reproduced with permission.[226] Copyright 2014 RSC Publishing.
Figure 3.
Figure 3.
ORP and its therapeutic evaluation in a mouse model of TBI. A) Schematic representation of ORP synthesis and chemical structure. B) T2 RARE (TE = 90 ms, TR = 3000 ms) images show the oedema caused by TBI and provide an indication of the extent of damage (white arrows). High signal intensity regions depicting OPR accumulation can be seen in the T1 RARE images and correlate with the damaged regions depicted in the T2 RARE images. C) T1 signal intensity quantification from a single animal, revealing uptake and retention of ORP in damaged areas of the brain but absence in other areas. D) FluorJade C staining showing evidence of reduction of neurodegeneration in the initial and surrounding injury site after 24 hours in mice treated with ORP. A count of damaged neurons was manually performed in each of the following regions: I) the CCI site, II) the deep margin of the CCI site subject to secondary damage, III) the contralateral cortex, and IV) the contralateral striatum. Untreated is indicated by UT. Reproduced with permission.[102] Copyright 2016, Wiley-VCH.
Figure 4.
Figure 4.
Schematic illustrating injured nerve regeneration in the central and peripheral nervous systems. A) Physiological attempts at central repair result in glial scar tissue formation due to the combination of inhibitory glial factors and a general non-permissive environment. B) The peripheral recovery process entails regeneration involving the activity of Schwann cells, macrophages and monocytes. C) Scanning electron micrograph images demonstrating neural cell adhesion to carbon nanotube/fiber substrates, which act as a scaffold similar to muscle fiber as predicted in Figures A&B above. (a) Neonatal hippocampal neurons adherent to MWCNT glass substrates, with extended neurites by 8 days. (b) Inset image showing a single neurite in close contact with carbon nanotubes. Reproduced with permission.[124] Copyright 2015, American Chemical Society. (c, d, e) PC-12 neural cells grown free-standing on vertically aligned CNFs coated with polypyrrole at various magnifications. Reproduced with permission.[126] Copyright 2008, Elsevier. D) Graphene-coated on a polymeric nanofiber hybrid scaffold promotes the selective differentiation of neural stem cells into oligodendrocytes. Reproduced with permission.[127] Copyright 2014, Wiley-VCH.
Figure 5.
Figure 5.
A) A scanning electron microscope (SEM) image of the NanoRU system with NSCs growing on top B) Quantitative graph showing the dependence of GFP (green fluorescence protein) knockdown on silica NP size in the NanoRU system. Reproduced with permission. by Nature Publishing Group Ref. [133]. Copyright 2013, Nature Publishing Group.
Figure 6.
Figure 6.
Quantum dot (QD)-labelling with B-nerve growth factor (BNGF): A) Primary rat cortical neurons labelled with QD-anti-β-tubulin III antibody conjugates. β-tubulin is a neuron-specific intermediate filament protein and thus an effective neuronal marker. B) Primary rat astrocytes labelled with QD-anti-glial fibrillary acid protein (GFAP) antibody conjugates. GFAP is a glial-specific intermediate filament protein. C) QD nanotechnology offers the advantage of providing both quantitative and qualitative datasets. Individual QDs can be counted across a sample image to generate information pertaining to the distribution and number of ligand-target receptor interactions. This particular graph illustrates the number of QDs with a given intensity. D) QDs can be functionalized for single-particle tracking of ligand-target pairs – such as the motion of a receptor within a lipid bilayer. This diagram illustrates the trajectory of a field of 55 QDs undergoing Brownian diffusion. Reproduced with permission.[3] Copyright 2006, Nature Publishing Group.
Figure 7.
Figure 7.
MRI scans from a patient receiving iron oxide nanoparticle-labelled neural stem cells. The scan obtained prior to implantation A) showed no pronounced hypointense signal around the lesion in the left temporal lobe (asterisks). One day after implantation, areas of hypointense signals were apparent. (B) Hypointense signals (black arrows) were observed at injection sites around the lesion on days 1, 7, 14 and 21 (C–F). On day 7 (D), dark signals (white arrows) were observed posterior to the lesion, consistent with the presence of the labelled cells. By day 14 (E), the hypointense signals at the injection sites had faded, and another dark signal (white arrowhead) had appeared and spread along the border of the damaged brain tissue. By day 21 (F), the dark signal had expanded and extended further along the lesion (white arrow). The scans in Panels (G) and (H), from a patient who underwent implantation of unlabelled cells, were obtained on days 0 and 1, respectively, and the magnified views in (I–L) were obtained on days 1, 7, 14, and 21, respectively. A slightly hypointense signal was present around the injection sites in (I–L). In these panels, the black arrows indicate the hypointense signal, and the asterisks indicate the lesion. Reproduced with permission.[147] Copyright 2006, Mass. Med. Soc.
Figure 8.
Figure 8.
Schematic representation of the triple-modality MPR concept (MPR stands for magnetic resonance imaging-photoacoustic imaging-Raman imaging). MPRs are injected intravenously into a mouse bearing an orthotopic brain tumor and can cross the BBB and subsequently accumulate in the tumor (above). MRI techniques allow preoperative detection and surgical planning to delineate the tumor. A single dose of the intravenously injected (MPR) probe resulted in efficient accumulation in the tumor and clear detection during the surgical process, even after several days, due to retention. Photoacoustic techniques were used to image the bulk tumor with relatively high resolution during surgery. Raman techniques were used for ultrahigh sensitivity, and spatial resolution was used to remove microscopic residual tumors. Raman probes can be further used to examine the specimen to verify clear tumor margins. Reproduced with permission. Copyright 2012, Nature Publishing Group.[159]
Figure 9.
Figure 9.
NPs for optical modulation. A) Green light is absorbed by AuNPs, thus generating local heating. Reprocuded with permission.[185] Copyright 2013, Americal Chemical Society. B) When the semiconductor nanocrystals are placed near the membrane (lipid bilayer), they sense voltage by detecting fluorescence fluctuations (ΔF/F) generated by the time-dependent electric field. Reprocuded with permission.[182] Copyright 2016, the authors. C) Schematic diagram of upconversion nanoparticles (UCNPs) embedded within polymeric films to form biocompatible hybrid scaffolds for neuronal culture. These UCNPs serve as internally excitable light source platform that converts NIR light into blue light, thus facilitating optogenetic activation of channelrhodopsin (ChR)-expressing neurons. Reproduced with permission.[71] Copyright 2015, Royal Society of Chemistry.
Figure 10.
Figure 10.
External control in genetically targeted nerve cells by light (optogenetics) or magnetic fields (magnetogenetics) relies on molecular actuators. These molecular actuators will excite or inhibit the cell when activated by a certain wavelength of light (right) or an altering magnetic field (left). A) The magnetic actuators utilize the heating of paramagnetic NPs (blue spheres) when activated by a magnetic field to cause an influx of cations in thermosensitive ion channels (TRPV1). Brain cells can be exposed to an alternating magnetic field through a remote coil. B) In the case of optical actuators, the ion channels (e.g., channelrhodopsin-2(ChR2, blue)) or ion pumps (e.g., Np-halorhodopsin (NpHR, green sphere)) are light sensitive. More specifically, these optical actuators are gated by photoabsorption. The membrane-potential traces (red lines) on the right illustrate the generation of light-activated and light-inhibited action potentials by ChR2 and NpHR, respectively. C) Implanted optical fibers, for example, may be used as a light delivery method. Reproduced with permission.[190] Copyright 2010, Nature Publishing Group.
Figure 11.
Figure 11.
A) NP heating for ion channel stimulation. a) Heating of superparamagnetic NPs coated in streptavidin-DyLight549 in an RF magnetic field induced the opening of TRPV1 by heat. b) Temperature dependence of the fluorescence intensity and lifetime of streptavidin-DyLight549. c) Graph indicating that applying an RF magnetic field to the NPs induced a change in the surface temperature of the NPs (red line) with little change in solution temperature (green line). B) Genetic targeting of NPs to specific cells: a) an image of cells by differential interference contrast (DIC), b) Golgi localized GFP, c) marking of the membrane protein AP-CFP-TM, d) fluorescence of DyLight549. C) a) Temperature change in an RF magnetic field of the plasma membrane (red) and Golgi apparatus (green). b) Capsaicin stimulation (solid line) and NP heating (dashed line) effect on TRPV1 opening and calcium influx in HEK 293 cells. c) Induction of action potentials in hippocampal neurons coated in NPs by an RF magnetic field. D) Remote thermal stimulation of C. elegans. a) C. elegans labelled with fluorescein-PEG-coated NPs, b) fluorescence intensity vs time in the amphid region, c) image of C. elegans with head region indicated by the square, d) schematic indicating basic structure of the head region in C. elegans. Reproduced with permission.[206] Copyright 2010, Nature Publishing Group.
Figure 12.
Figure 12.
A) Future application of TENG for neuron differentiation and regeneration in the human brain. B) TENG can be operated with human motions, and the typical a) induced voltage, b) current and c) transferred charge of TENG is driven by walking steps. d) Stability of the TENG current output in 1500 s (about 4500 pulses). C) Cells were immunostained with (1) DAPI (blue) for the nucleus and neural-specific antibodies (2) Tuj1 (red, cy3), (3) GFAP (green, FITC) after being cultured under stimulation conditions without TENG electrical stimulation (a,b) or with human-motion-driven TENG electrical stimulation (c,d) for 21 days on rGO microfibers (a,c) and 15% rGO–PEDOT hybrid microfibers (b,d). (Right) Merged fluorescence images (scale bar = 100 μm). D) Expression levels of neural-specific genes of Tuj1 (a) and GFAP (b) on the rGO microfibers and 15% rGO–PEDOT hybrid microfibers; cells were stimulated by human-walking-driven TENG for 21 days. Reproduced with permission.[209] Copyright 2016, American Chemical Society.
Figure 13.
Figure 13.
Considerations in nanotoxicology studies and clinical management. A) Typical nanotoxicology studies involve methods to investigate the factors affecting the toxicology of nanomaterials in the application of neuroscience. B) Management of nanomaterials for better, health care solutions. C) Necessary experimental information required in nanotoxicity databases for efficient use in clinical settings.

Similar articles

Cited by

References

    1. Alivisatos AP, Chun M, Church GM, Greenspan RJ, Roukes ML, Yuste R, Neuron 2012, 74, 970. - PMC - PubMed
    1. Bargmann CI, Marder E, Nat. Methods 2013, 10, 483. - PubMed
    1. Silva GA, Nat. Rev. Neurosci 2006, 7, 65. - PubMed
    1. Alivisatos AP, Andrews AM, Boyden ES, Chun M, Church GM, Deisseroth K, Donoghue JP, Fraser SE, Lippincott-Schwartz J, Looger LL, Masmanidis S, McEuen PL, Nurmikko AV, Park H, Peterka DS, Reid C, Roukes ML, Scherer A, Schnitzer M, Sejnowski TJ, Shepard KL, Tsao D, Turrigiano G, Weiss PS, Xu C, Yuste R, Zhuang X, ACS Nano 2013, 7, 1850. - PMC - PubMed
    1. Cabral J, Kringelbach ML, Deco G, Prog. Neurobiol 2014, 114, 102. - PubMed

LinkOut - more resources