

Suboptimal bone microarchitecure in adolescent girls with obesity compared to normal-weight controls and girls with anorexia nervosa
- PMID: 30853658
- PMCID: PMC6636859
- DOI: 10.1016/j.bone.2019.03.007
Suboptimal bone microarchitecure in adolescent girls with obesity compared to normal-weight controls and girls with anorexia nervosa
Abstract
Background: Despite their higher areal bone mineral density (aBMD), adolescents with obesity (OB) have an increase in fracture risk, particularly of the extremities, compared with normal-weight controls. Whereas bone parameters that increase fracture risk are well characterized in anorexia nervosa (AN), the other end of nutritional spectrum, these data are lacking in adolescents with obesity.
Objective: Our objective was to compare bone parameters in adolescent girls across the nutritional spectrum, to determine whether suboptimal bone adaptation to increased body weight may explain the increased fracture risk in OB.
Methods: We assessed bone endpoints in 153 adolescent girls 14-21 years old: 50 OB, 48 controls and 55 AN. We used (i) DXA to assess aBMD at the lumbar spine, proximal femur and whole body, and body composition, (ii) high resolution peripheral quantitative CT (HRpQCT) to assess bone geometry, microarchitecture and volumetric BMD (vBMD), and (iii) finite element analysis to assess failure load (a strength estimate) at the distal radius and tibia. All aBMD, microarchitecture and FEA analyses were controlled for age and race.
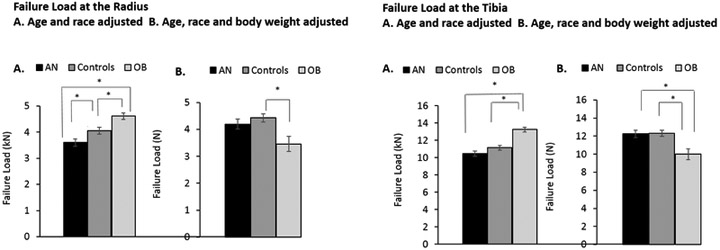
Results: Groups did not differ for age or height. Areal BMD Z-scores at all sites were highest in OB, intermediate in controls and lowest in AN (p < 0.0001). At the radius, cortical area and thickness were higher in OB compared to AN and control groups (p = 0.001) while trabecular area did not differ across groups. Compared to controls, OB had higher cortical porosity (p = 0.003), higher trabecular thickness (p = 0.024), and higher total, cortical and trabecular vBMD and rod BV/TV (p < 0.04). Plate BV/TV did not differ in OB vs. controls, but was higher than in AN (p = 0.001). At the tibia, total, cortical, and trabecular area and cortical thickness were higher in OB vs. controls and AN (p < 0.005). OB also had higher cortical porosity (p < 0.007) and lower trabecular thickness (p < 0.02) than the other two groups. Trabecular number, total and trabecular vBMD, and rod BV/TV were higher in OB vs. controls and AN (p < 0.02), while cortical vBMD and plate BV/TV did not differ in OB vs. the other two groups. Finally, failure load (a strength estimate) was higher in OB at the radius and tibia compared to controls and AN (p < 0.004 for all). However, after adjusting for body weight, failure load was lower in OB vs. controls at both sites (p < 0.05), and lower than in AN at the distal tibia.
Conclusion: Not all bone parameters demonstrate appropriate adaptation to higher body weight. Cortical porosity and plate BV/TV at the radius and tibia, and cortical vBMD and trabecular thickness at the tibia are particularly at risk. These effects may contribute to the higher risk for fracture reported in OB vs. controls.
Keywords: Adolescents; Bone density; Bone geometry; Bone microarchitecture; Bone strength; Obesity.
Copyright © 2019. Published by Elsevier Inc.
Conflict of interest statement
Figures
Similar articles
-
Bone Metabolism in Adolescents Undergoing Bariatric Surgery.J Clin Endocrinol Metab. 2021 Jan 23;106(2):326-336. doi: 10.1210/clinem/dgaa836. J Clin Endocrinol Metab. 2021. PMID: 33196832 Free PMC article. Review.
-
Adolescent girls with anorexia nervosa have impaired cortical and trabecular microarchitecture and lower estimated bone strength at the distal radius.J Clin Endocrinol Metab. 2013 May;98(5):1923-9. doi: 10.1210/jc.2012-4153. Epub 2013 Mar 18. J Clin Endocrinol Metab. 2013. PMID: 23509107 Free PMC article.
-
Marrow adipose tissue in adolescent girls with obesity.Bone. 2019 Dec;129:115103. doi: 10.1016/j.bone.2019.115103. Epub 2019 Oct 14. Bone. 2019. PMID: 31622774 Free PMC article.
-
The Role of Body Weight on Bone in Anorexia Nervosa: A HR-pQCT Study.Calcif Tissue Int. 2017 Jul;101(1):24-33. doi: 10.1007/s00223-017-0254-7. Epub 2017 Feb 21. Calcif Tissue Int. 2017. PMID: 28224178 Free PMC article.
-
A structural approach to the assessment of fracture risk in children and adolescents with chronic kidney disease.Pediatr Nephrol. 2007 Nov;22(11):1815-24. doi: 10.1007/s00467-007-0490-6. Epub 2007 Jul 11. Pediatr Nephrol. 2007. PMID: 17622566 Free PMC article. Review.
Cited by
-
Differences in bone accrual over one year in young girls with obesity compared to Normal weight controls.Bone. 2023 Jul;172:116757. doi: 10.1016/j.bone.2023.116757. Epub 2023 Apr 6. Bone. 2023. PMID: 37030498 Free PMC article.
-
Bone Metabolism in Adolescents Undergoing Bariatric Surgery.J Clin Endocrinol Metab. 2021 Jan 23;106(2):326-336. doi: 10.1210/clinem/dgaa836. J Clin Endocrinol Metab. 2021. PMID: 33196832 Free PMC article. Review.
-
Skeletal Effects of Sleeve Gastrectomy in Adolescents and Young Adults: A 2-Year Longitudinal Study.J Clin Endocrinol Metab. 2023 Mar 10;108(4):847-857. doi: 10.1210/clinem/dgac634. J Clin Endocrinol Metab. 2023. PMID: 36314507 Free PMC article.
-
Prediction of Cortical Bone Thickness Variations in the Tibial Diaphysis of Running Rats.Life (Basel). 2022 Feb 3;12(2):233. doi: 10.3390/life12020233. Life (Basel). 2022. PMID: 35207520 Free PMC article.
-
Load-to-strength ratio at the radius is higher in adolescent and young adult females with obesity compared to normal-weight controls.Bone. 2022 Nov;164:116515. doi: 10.1016/j.bone.2022.116515. Epub 2022 Aug 7. Bone. 2022. PMID: 35948256 Free PMC article.
References
-
- Lucas AR, Melton LJ 3rd, Crowson CS, O'Fallon WM. Long-term fracture risk among women with anorexia nervosa: a population-based cohort study. Mayo Clin Proc. 1999;74(10):972–977. - PubMed
-
- Goulding A, Jones IE, Taylor RW, Williams SM, Manning PJ. Bone mineral density and body composition in boys with distal forearm fractures: a dual-energy x-ray absorptiometry study. J Pediatr. 2001;139(4):509–515. - PubMed
-
- Pollock NK, Laing EM, Hamrick MW, Baile CA, Hall DB, Lewis RD. Bone and fat relationships in postadolescent black females: a pQCT study. Osteoporos Int. 2011;22(2):655–665. - PubMed
-
- Davidson PL, Goulding A, Chalmers DJ. Biomechanical analysis of arm fracture in obese boys. J Paediatr Child Health. 2003;39(9):657–664. - PubMed
Publication types
MeSH terms
Grants and funding
LinkOut - more resources
Full Text Sources
Medical
Miscellaneous
