. 2019 Jul;176(13):2111-2130.
doi: 10.1111/bph.14657. Epub 2019 May 23.

Androgen receptor antagonism accelerates disease onset in the SOD1G93A mouse model of amyotrophic lateral sclerosis

Affiliations

Androgen receptor antagonism accelerates disease onset in the SOD1G93A mouse model of amyotrophic lateral sclerosis

Victoria M McLeod et al. Br J Pharmacol. 2019 Jul.

Abstract

Background and purpose: Amyotrophic lateral sclerosis (ALS) is a fatal neurodegenerative disease typically more common in males, implicating androgens in progression of both patients and mouse models. Androgen effects are mediated by androgen receptor which is highly expressed in spinal motor neurons and skeletal muscles. To clarify the role of androgen receptors in ALS, we therefore examined the effect of androgen receptor antagonism in the SOD1G93A mouse model.

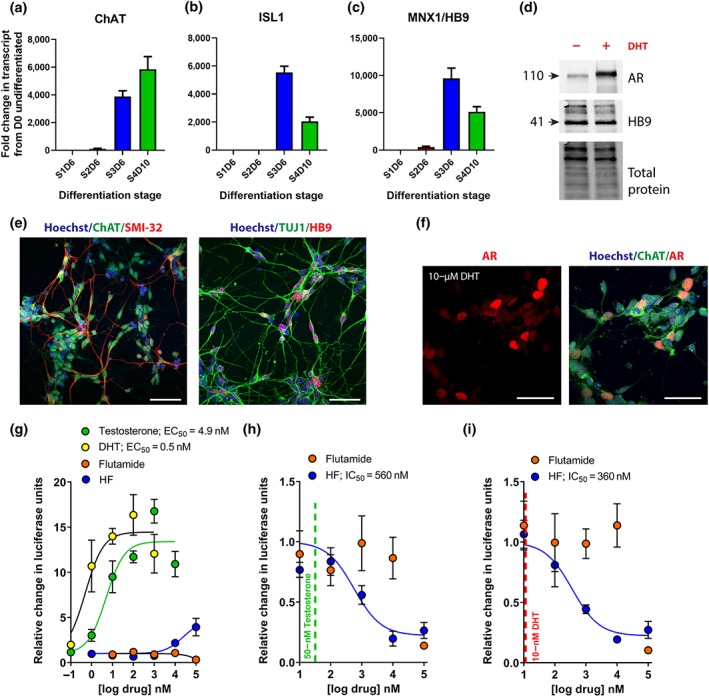
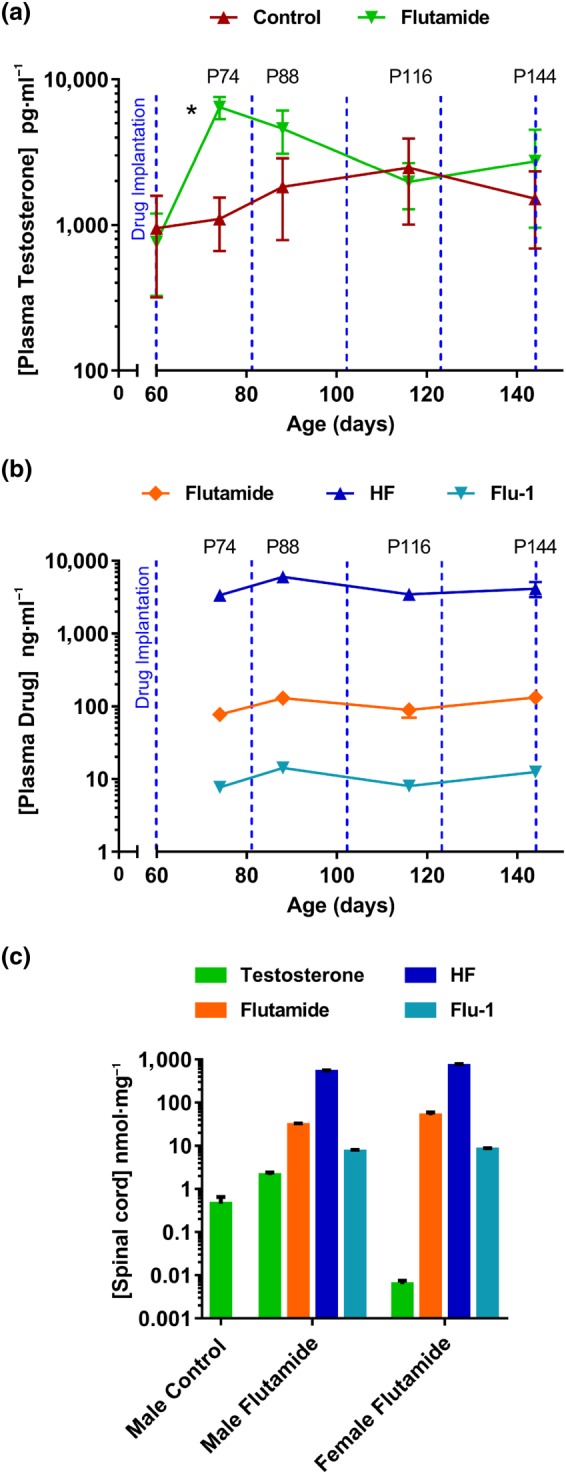
Experimental approach: The androgen receptor antagonist, flutamide, was administered to presymptomatic SOD1G93A mice as a slow-release subcutaneous implant (5 mg·day-1 ). Testosterone, flutamide, and metabolite levels were measured in blood and spinal cord tissue by LC-MS-MS. Effects on disease onset and progression were assessed using motor function tests, survival, muscle, and neuropathological analyses.

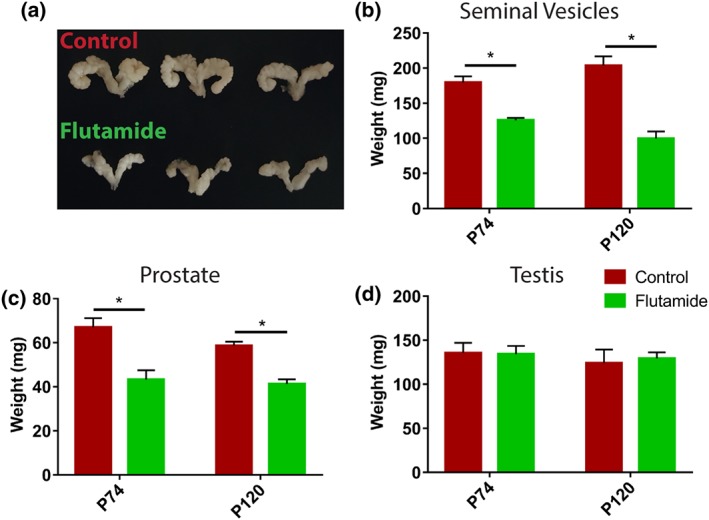
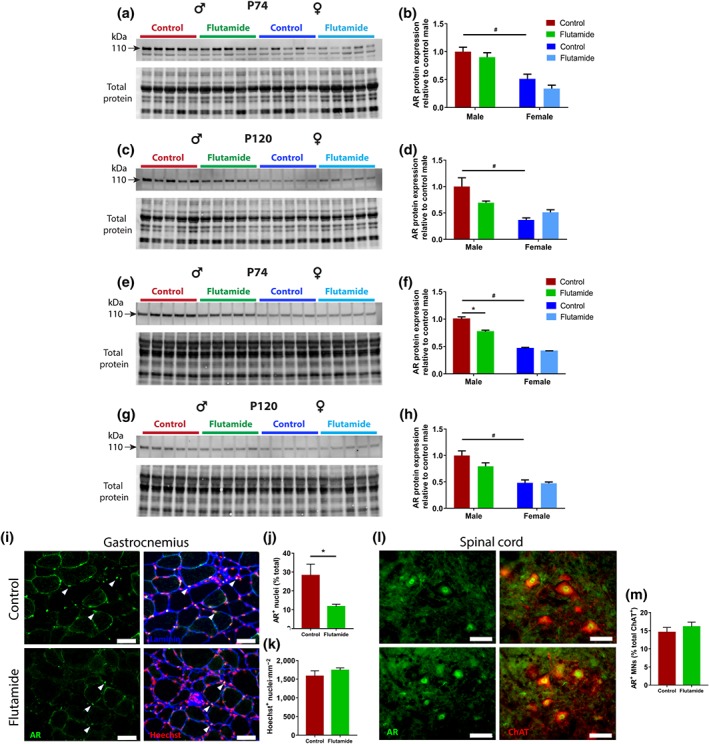
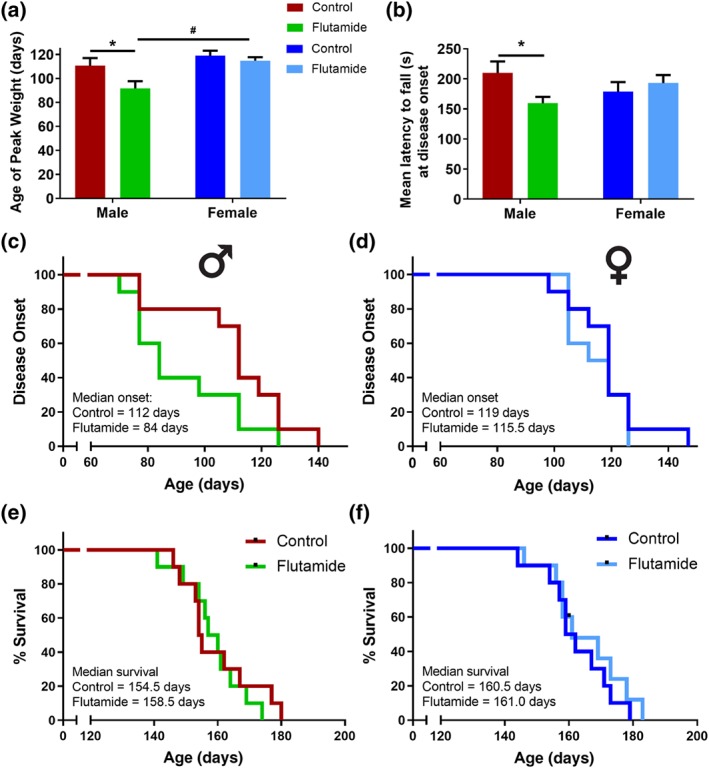
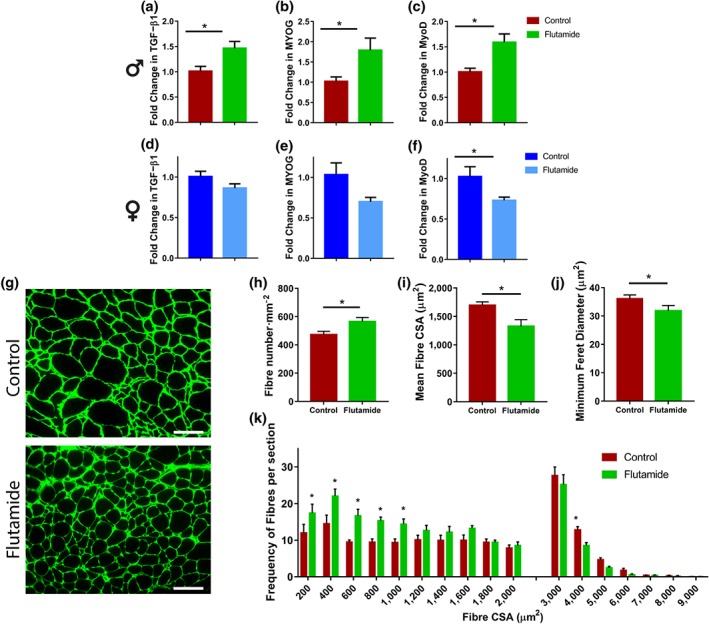
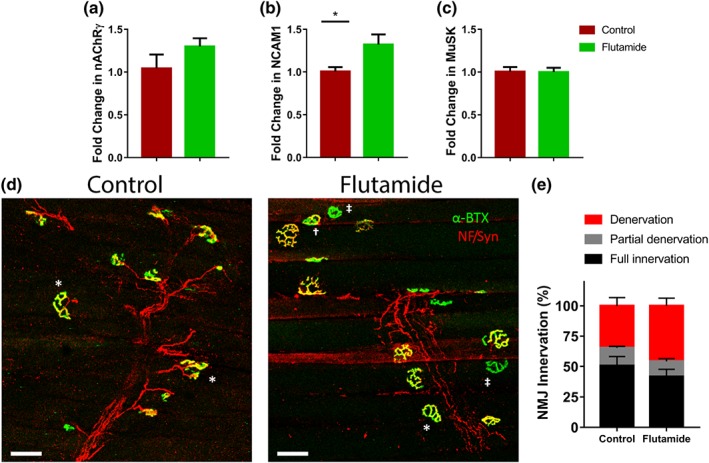
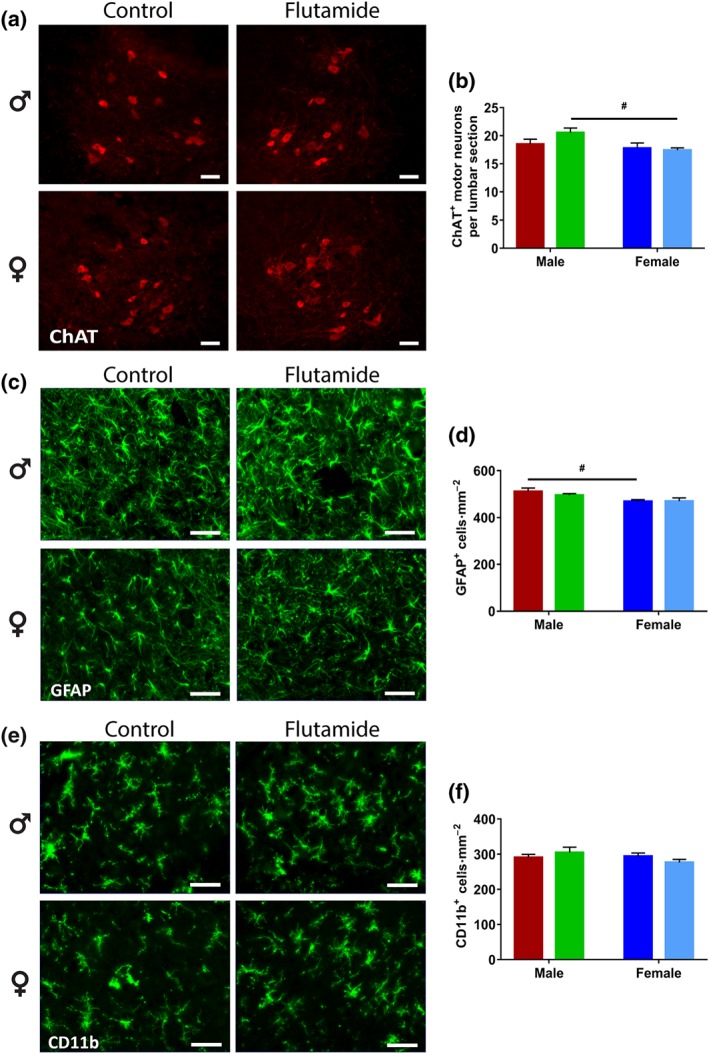
Key results: Flutamide was metabolised to 2-hydroxyflutamide achieving steady-state plasma levels across the study duration and reached the spinal cord at pharmacologically active concentrations. Flutamide treatment accelerated disease onset and locomotor dysfunction in male SOD1G93A mice, but not female mice, without affecting survival. Analysis of hindlimb muscles revealed exacerbation of myofibre atrophy in male SOD1G93A mice treated with flutamide, although motor neuron pathology was not affected.

Conclusion and implications: The androgen receptor antagonist accelerated disease onset in male SOD1G93A mice, leading to exacerbated muscle pathology, consistent with a role of androgens in modulating disease severity, sexual dimorphism, and peripheral pathology in ALS. These results also demonstrate a key contribution of skeletal muscle pathology to disease onset, but not outcome, in this mouse model of ALS.


Conflict of interest statement

The authors declare no conflicts of interest.

Figures

Figure 1
Figure 1
Agonist and antagonist dose responses of the luciferase androgen receptor reporter assay in human embryonic stem cell‐derived motor neurons. qRT‐PCR analysis of (a) ChAT, (b) ISL1, and (c) MNX1/HB9 expression various stages of the differentiation (Stages 1–4) compared to undifferentiated cells at Day 0. (d) Western blot confirming HB9 protein expression and androgen receptor (AR) expression in experimental motor neurons in the presence or absence of 10‐μM DHT. (e) Immunocytochemistry confirming the expression of mature neuronal (TUJ1 and SMI‐32) and motor neuron‐specific (ChAT and HB9) markers in experimental motor neurons. Scale bar = 50 μm. (f) Expression of androgen receptors in motor neurons showing nuclear localisation in the presence of 10‐μM DHT. Scale bar = 50 μm. (g) Activation of androgen receptors following 16‐hr treatment with testosterone, DHT, flutamide, and HF over a 0.1‐ to 105‐nM concentration range with the EC50 indicated where applicable. (h) Activation of androgen receptors following 16‐hr co‐treatment with testosterone and increasing concentrations of antagonist with IC50 value indicated for HF. Green dotted line indicates the basal 50‐nM testosterone concentration. (i) Activation of androgen receptors following 16‐hr co‐treatment with DHT and increasing concentrations of antagonist with IC50 value indicated for HF. Red dotted line indicates the basal 10‐nM DHT concentration. Data are presented as mean ± SEM, n = 3 independent experiments
Figure 2
Figure 2
Testosterone, flutamide, and metabolite concentrations in plasma and spinal cord of male SOD1G93A mice treated with either a placebo control or a flutamide‐releasing s.c. implant from postnatal day 60 (P60). (a) Plasma testosterone levels in control‐ and flutamide‐treated male mice from pre‐implant to endstage of disease (n = 5–14 mice per group). *P < 0.05, significantly different to control; two‐way ANOVA with Fisher's least significant difference test. (b) Plasma flutamide, HF, and Flu‐1 levels in plasma of flutamide‐treated male mice from 14 days post‐implant (P74) to endstage of disease (n = 5–10 mice per group). Blue lines indicate when a 21‐day slow‐release pellet was implanted. (c) Spinal cord testosterone, flutamide, HF, and Flu‐1 drug levels after 14 days post‐treatment (P74) in male and female mice (n = 5 mice per group). Data represent mean ± SEM
Figure 3
Figure 3
Effect of chronic flutamide treatment on the weights of male sex organs in SOD1G93A mice. (a) Representative images of seminal vesicles at postnatal day 120 (P120). (b) Seminal vesicle weights at P74 and P120. *P < 0.05 significantly different from control; two‐way ANOVA with Fisher's least significant difference test. (c) Prostate weights. *P < 0.05 significantly different from control; two‐way ANOVA with Fisher's least significant difference test. (d) Testis weights. Data represent mean ± SEM, n = 5 mice per group
Figure 4
Figure 4
Expression of androgen receptor protein and cellular distribution in skeletal muscle and spinal cord from control‐ and flutamide‐treated male and female SOD1G93A mice. (a) Immunoblot analysis of androgen receptors in gastrocnemius muscle relative to total protein levels at postnatal day 74 (P74) and (c) P120. Quantification of androgen receptor levels relative to male control group is shown for (b) P74 and (d) P120. # P < 0.05, significantly different to male counterpart; two‐way ANOVA with Fisher's least significant difference (LSD) test comparing sex effect. (e) Immunoblot analysis of androgen receptors in spinal cord relative to total protein at P74 and (g) P120. Quantification of androgen receptor levels relative to male control group is shown for (f) P74 and (h) P120. # P < 0.05, significantly different to male counterpart; two‐way ANOVA with Fisher's LSD test comparing sex. *P < 0.05, significantly different to male control; two‐way ANOVA with Fisher's LSD test comparing treatments. (i) Immunohistochemical analysis of androgen receptors in gastrocnemius muscle of male mice at P120. Androgen receptor‐positive nuclei are indicated by arrowheads. Gastrocnemius myocyte nuclei were identified by positive Hoechst labelling with quantification for (j) androgen receptor‐positive nuclei and (k) total nuclei. *P < 0.05, significantly different to control; Mann–Whitney test. (l) Immunohistochemical analysis of androgen receptors in lumbar spinal cords of male mice at P120. Ventral horn motor neurons identified by ChAT immunolabelling with (m) quantification of androgen receptor‐positive nuclei in ChAT‐positive motor neurons shown. Data represent mean ± SEM, n = 5 mice per group. Scale bar = 50 μm
Figure 5
Figure 5
Flutamide treatment accelerates disease onset and motor dysfunction in male SOD1G93A mice. (a) Mean disease onset determined by body weight loss onset was significantly advanced in male mice receiving flutamide, compared to male control. *P < 0.05, significantly different to control; # P < 0.05, significantly different to male counterpart; two‐way ANOVA with Fisher's least significant difference test comparing treatment and sex. (b) Rotarod function at the time of disease onset was significantly impaired in male mice treated with flutamide, compared to male controls. *P < 0.05, significantly different to control; two‐way ANOVA with Fisher's least significant difference test comparing treatment. (c, d) Kaplan–Meier curves of age at which mice showed onset of disease and (e, f) age to reach endstage of disease defined by hindlimb paralysis in flutamide and control male and female mice. Data represent mean ± SEM, n = 10 mice per group
Figure 6
Figure 6
Flutamide treatment aggravates hindlimb skeletal muscle atrophy in male SOD1G93A mice. qRT‐PCR analysis of (a) TGF‐β1, (b) myogenin, and (c) MyoD mRNA levels in gastrocnemius muscles of male mice at postnatal day 120 (P120). qRT‐PCR analyses of (d) TGF‐β1, (e) myogenin, and (f) MyoD mRNA levels in gastrocnemius muscles of female mice at P120. *P < 0.05, significantly different to control ; Student's t test or Mann–Whitney test where unequal variance was indicated. (g) Photomicrograph of gastrocnemius muscle cross sections with laminin immunohistochemistry. Scale bar = 100 μm. Quantification of (h) fibre number per unit of area, (i) mean cross‐sectional area (CSA) of measured fibres, and (j) mean minimum Feret diameter of measured fibres. *P < 0.05, significantly different to control; Student's t test. (k) The distribution of measured fibre CSAs in flutamide‐treated males, compared to control treated. *P < 0.05, significantly different to control; two‐way ANOVA using repeated measures with Fisher's least significant difference test comparing treatment. Data represent mean ± SEM, n = 5 mice per group
Figure 7
Figure 7
Effect of flutamide treatment on hindlimb skeletal muscle denervation in male SOD1G93A mice. qRT‐PCR analysis of (a) nAChRγ, (b) NCAM1, and (c) MuSK mRNA levels in gastrocnemius muscle of flutamide‐ and control‐treated mice at postnatal day 120 (P120). *P < 0.05, significantly different to control; Student's t test. (d) Histochemical staining of neuromuscular junctions (NMJs) within the gastrocnemius muscle; postsynaptic motor endplates labelled with α‐bungarotoxin (BTX) and immunolabelling of presynaptic nerves (NF) and nerve terminals (Syn). *denotes full innervation, represents partial innervation, and shows denervated endplates. Scale bar = 50 μm. (e) Quantification of innervated, partially denervated, and fully denervated endplates (n = 4 mice per group)
Figure 8
Figure 8
Effects of flutamide treatment on motor neuron and glial cell pathology in lumbar spinal cord ventral horns of SOD1G93A mice at postnatal day 120 (P120). (a) Representative immunostaining of ChAT‐positive motor neurons with (b) quantification. # P < 0.05, significantly different to male counterpart; two‐way ANOVA with Fisher's least significant difference test comparing sex effect. (c) Representative immunostaining of GFAP‐positive astrocytes with (d) quantification of astrocytes. # P < 0.05, significantly different to male counterpart; two‐way ANOVA with Fisher's least significant difference test comparing sex effect. (e) Representative immunostaining of CD11b‐positive microglia with (f) quantification of microglial cell counts. Data represent mean ± SEM, n = 5 mice per group. Scale bars = 50 μm

Similar articles

Cited by

References

    1. Aare, S. , Spendiff, S. , Vuda, M. , Elkrief, D. , Perez, A. , Wu, Q. , … Hepple, R. T. (2016). Failed reinnervation in aging skeletal muscle. Skeletal Muscle, 6, 29 10.1186/s13395-016-0101-y - DOI - PMC - PubMed
    1. Acsadi, G. , Anguelov, R. A. , Yang, H. , Toth, G. , Thomas, R. , Jani, A. , … Shy, M. E. (2002). Increased survival and function of SOD1 mice after glial cell‐derived neurotrophic factor gene therapy. Human Gene Therapy, 13, 1047–1059. 10.1089/104303402753812458 - DOI - PubMed
    1. Aggarwal, T. , Polanco, M. J. , Scaramuzzino, C. , Rocchi, A. , Milioto, C. , Emionite, L. , … Pennuto, M. (2014). Androgens affect muscle, motor neuron, and survival in a mouse model of SOD1‐related amyotrophic lateral sclerosis. Neurobiology of Aging, 35, 1929–1938. 10.1016/j.neurobiolaging.2014.02.004 - DOI - PubMed
    1. Aizawa, Y. , Ikemoto, I. , Kishimoto, K. , Wada, T. , Yamazaki, H. , Ohishi, Y. , … Ueda, M. (2003). Flutamide‐induced hepatic dysfunction in relation to steady‐state plasma concentrations of flutamide and its metabolites. Molecular and Cellular Biochemistry, 252, 149–156. 10.1023/A:1025560513308 - DOI - PubMed
    1. Alexander, S. P. H. , Cidlowski, J. A. , Kelly, E. , Marrion, N. V. , Peters, J. A. , Faccenda, E. , … CGTP Collaborators . (2017). The Concise Guide to PHARMACOLOGY 2017/18: Nuclear hormone receptors. British Journal of Pharmacology, 174(Suppl 1), S208–S224. 10.1111/bph.13880 - DOI - PMC - PubMed

Publication types

MeSH terms