. 2019 Feb 21:11:3.
doi: 10.3389/fnsyn.2019.00003. eCollection 2019.

Altered Regulation of Striatal Neuronal N-Methyl-D-Aspartate Receptor Trafficking by Palmitoylation in Huntington Disease Mouse Model

Affiliations

Altered Regulation of Striatal Neuronal N-Methyl-D-Aspartate Receptor Trafficking by Palmitoylation in Huntington Disease Mouse Model

Rujun Kang et al. Front Synaptic Neurosci. .

Abstract

N-methyl-D-aspartate receptors (NMDARs) play a critical role in synaptic signaling, and alterations in the synaptic/extrasynaptic NMDAR balance affect neuronal survival. Studies have shown enhanced extrasynaptic GluN2B-type NMDAR (2B-NMDAR) activity in striatal neurons in the YAC128 mouse model of Huntington disease (HD), resulting in increased cell death pathway activation contributing to striatal vulnerability to degeneration. However, the mechanism(s) of altered GluN2B trafficking remains unclear. Previous work shows that GluN2B palmitoylation on two C-terminal cysteine clusters regulates 2B-NMDAR trafficking to the surface membrane and synapses in cortical neurons. Notably, two palmitoyl acyltransferases (PATs), zDHHC17 and zDHHC13, also called huntingtin-interacting protein 14 (HIP14) and HIP14-like (HIP14L), directly interact with the huntingtin protein (Htt), and mutant Htt disrupts this interaction. Here, we investigated whether GluN2B palmitoylation is involved in enhanced extrasynaptic surface expression of 2B-NMDARs in YAC128 striatal neurons and whether this process is regulated by HIP14 or HIP14L. We found reduced GluN2B palmitoylation in YAC128 striatum, specifically on cysteine cluster II. Consistent with that finding, the palmitoylation-deficient GluN2B Cysteine cluster II mutant exhibited enhanced, extrasynaptic surface expression in striatal neurons from wild-type mice, mimicking increased extrasynaptic 2B-NMDAR observed in YAC128 cultures. We also found that HIP14L palmitoylated GluN2B cysteine cluster II. Moreover, GluN2B palmitoylation levels were reduced in striatal tissue from HIP14L-deficient mice, and siRNA-mediated HIP14L knockdown in cultured neurons enhanced striatal neuronal GluN2B surface expression and susceptibility to NMDA toxicity. Thus, altered regulation of GluN2B palmitoylation levels by the huntingtin-associated PAT HIP14L may contribute to the cell death-signaling pathways underlying HD.

Keywords: Huntington disease (HD); NMDAR palmitoylation; huntingtin interacting protein 14 (HIP14); huntingtin interacting protein 14-like (HIP14L); palmitoyl acyltransferase (PAT).


Figures
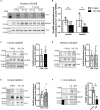
FIGURE 1
FIGURE 1
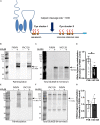
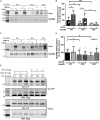
Palmitoylation of GluN2B but not GluB2A is significantly reduced in YAC128 striatum. Brain striatal and cortex tissues were dissected from FVB/N wild-type and YAC128 mice, rapidly frozen by liquid nitrogen, and saved at –80°C before forwarding to ABE/western analysis. Each panel of image data shows results from one representative gel and the dividing line(s) indicate where lanes were removed for ease of comparing genotypes from specific tissues and ages. (A) Representative blot shows that the palmitoylation of GluN2B as a proportion to total was significantly reduced in striatal tissues from 1- and 3 month- old YAC128 mice compared to FVB/N (wild-type). The HAM – and + indicate lysates treated without/with hydroxylamine (HAM); lysates without HAM treatment are controls for non-specific protein precipitation by streptavidin-linked beads and only HAM+ lanes were analyzed. Quantification of GluN2B palmitoylation was measured as the band intensity in the purified palmitoyl-proteins (top panel: Palm) ratio to the level of the corresponding unpurified total protein extracts (middle panel: total GluN2B); actin expression reflects protein loading control (lower panel). The graph analysis (B) indicates the corresponding GluN2B palmitoylation level for YAC128 normalized to FVB/N wild-type control within the same experiment. Data are presented for eight independent experiments from 1 month-old and five independent experiments from 3 month-old FVB/N and YAC128 mice. Bars represent means ± SD p < 0.05 (two-way ANOVA, p = 0.0409 for genotype; p = 0.5235 for interaction and age). Data points from the same blot are connected by lines. (C) The palmitoylation of GluN2B was not altered in cortical tissues from 1 month-old YAC128 mice. The graph analysis, generated from raw data as in (B), is from 5 independent experiments. (D,E) The GluN2A palmitoylation level was similar in both striatal and cortical tissues from 1 month-old YAC128 and FVB/N control mice. Data are presented from six independent experiments. The protein ladder lane image was contrast-enhanced using Adobe Photoshop in (E). (F) Rapid turnover rate of palmitate on GluN2B. MSN-CTX co-cultures at DIV 14 were treated with 100 μM 2-bromo-palmitate (2BP) for 5 h and then harvested for ABE/western analysis. Representative blots show significant reduction of palmitoylation of GluN2B in the absence of any protein expression change. Graph was generated with data from three independent experiments. Bars represent means ± SD p < 0.05 (paired t-test).
FIGURE 2
FIGURE 2
Calpain cleavage of GluN2B to isolate Cys cluster II-containing C-terminal fragment reveals reduced palmitoylation in YAC128 striatum. (A) Cartoon indicating relative location of GluN2B Cys clusters I and II and the major calpain cleavage site. Each panel of image data shows results from one representative gel and the dividing line(s) indicate where lanes were removed for ease of comparing genotypes under identical experimental conditions. (B–D) Palmitoylation of Cys cluster II-containing C-terminal fragment was examined by IP/Btn-BMCC method. Representative blots show that palmitoylation (detected by probing with streptavidin Alexa 680, B) of GluN2B Cys cluster II-containing C-terminal fragment as a ratio to total GluN2B levels (detected by C-terminal specific antibody MA1-2014, as shown in C) was significantly decreased in striatum from YAC128 compared to FVB/N wild-type mice. Black arrow = ∼62 kDa cluster II-containing C-terminal fragment. (D) Summary graph indicates the corresponding ratio of palmitoylation signal (calculated as in Figure 1) for YAC128 normalized to the FVB/N control. Data presented for striatal tissue from 10 independent experiments; bars represent means ± SD p < 0.05 (paired t-test) and data points from same experiment are connected by lines. (E–G) Palmitoylation of Cys cluster I-containing N-terminal fragment was examined by ABE/western blotting method. (E) Purified palmitoylated GluN2B was detected with GluN2B N-terminal specific antibody (AGC-003); total GluN2B expression is shown in representative blot in (F), using the same ACG-003 antibody. Black arrow = ∼115 kDa cluster I-containing N-terminal fragment. (G) Palmitoylation level of cluster I-containing fragment of GluN2B was calculated as ratio of palmitoylation signal (shown in E) to the total protein signal (in F); summary graph indicates corresponding palmitoylation level in YAC128 normalized to FVB/N, as in Figure 1. Data presented for striatal tissue from 7 independent experiments; bars represent means ± SD and data points from same experiment are connected by a line.
FIGURE 3
FIGURE 3
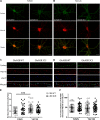
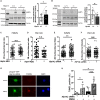
Loss of Cys cluster I (GluN2B 3CS) palmitoylation of GluN2B does not affect the surface expression of 2B-NMDARs in striatal neurons. GFP-tagged GluN2B wild type (WT) and Cys cluster I mutant (GluN2B 3CS) were nucleofected in striatal neurons co-cultured with cortical neurons. (A) Images representing the surface/internal expression of GluN2B in striatal neurons in MSN-CTX co-cultures from FVB/N mice. Neuronal cultures were live stained for surface GluN2B (green) with GFP antibody at DIV 18, then fixed and stained for internal GluN2B (red). Merged image shows the total GluN2B expression. Scale bars, 20 μm. (B) Representative images of surface (green)/internal (red) expression of GluN2B in striatal neurons co-cultured with cortical neurons from YAC128 mice. (C,D) Images representing the colocalization of surface GluN2B (green) with excitatory synaptic markers, PSD-95 (red) and vGLUT1 (blue), in striatal neurons in MSN-CTX co-cultures expressing the wild type and Cys cluster I mutant (GluN2B 3CS). Scale bars, 10 μm. (E) Quantitative analysis for the ratio of surface/internal GluN2B intensity. Data from FVB/N and YAC128 co-cultures were acquired in paired experiments (N = 4 paired culture batches, 52 cells for each genotype and construct). GluN2B WT surface intensity was significantly enhanced in YAC128 vs. FVB/N striatal neurons (two-way ANOVA, p = 0.0310 for mouse genotype, p = 0.7749 for GluN2B construct, and p = 0.0036 for interaction; ∗∗∗p < 0.001 by Bonferroni’s post hoc test). (F) Summary graph of the colocalization of surface puncta of GluN2B with PSD-95 and vGLUT1. Data show no significant difference between genotype or GluN2B construct (two-way ANOVA, p = 0.4987 for genotype, p = 0.1318 for 3CS mutant, p = 0.8475 for interaction; n.sp > 0.05 by Bonferroni’s post hoc tests). Colocalization data were from 3 independent experiments/38 cells analyzed in FVB/N and 3 independent experiments/44 cells analyzed in YAC128.
FIGURE 4
FIGURE 4
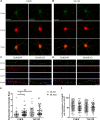
Loss of Cys cluster II (GluN2B 5CS) palmitoylation of GluN2B regulates the surface expression of GluN2B in striatal neurons. GFP-tagged GluN2B wild type (WT) and Cys cluster II mutant (GluN2B 5CS) were nucleofected in striatal neurons co-cultured with cortical neurons. (A) Images representing the surface (green)/internal (red) expression of GluN2B in striatal neurons in MSN-CTX co-cultures from FVB/N mice. Merged image shows the total GluN2B expression. Scale bars, 20 μm. (B) Representative images of surface (green)/internal (red) expression of GluN2B in striatal neurons co-cultured with cortical neurons from YAC128 mice. (C,D) Representative images of surface GluN2B puncta colocalization with the excitatory synaptic markers PSD-95 and vGLUT1 for GluN2B WT and 5CS in FVB/N and YAC128 DIV 18 striatal neurons in MSN-CTX co-cultures. Scale bars, 10 μm. (E) Quantitative analysis for the ratio of surface to internal GluN2B intensity was performed for data from paired experiments from 4 batches each of FVB/N and YAC128 MSN-CTX co-cultures. Similar to results shown in Figure 3E, GluN2B WT surface intensity was significantly enhanced in YAC128 vs. FVB/N striatal neurons; as well, surface intensity was significantly enhanced in FVB/N but not YAC128 striatal neurons expressing the GluN2B 5CS [FVB/N: N = 4(48 cells), YAC128: N = 4(42 cells)] when compared to neurons expressing GluN2B WT [FVB/N: N = 4(48 cells), YAC128: N = 4(42 cells)]. Significant by two-way ANOVA, p = 0.0012 for genotype, p = 0.0129 for 2B construct, and p = 0.9970 for interaction; ∗∗p < 0.01, p < 0.05 by Bonferroni’s post hoc test. (F) Summary graph shows similar colocalization of GluN2B WT and 5CS punctae with both PSD-95 and vGLUT1. Colocalization data were from 4 independent experiments/38 cells analyzed in FVB/N and 4 independent experiments/36 cells analyzed in YAC128. Two-way ANOVA, p = 0.1785 for genotype, p = 0.0592 for 5CS mutant, p = 0.1571 for interaction; p > 0.05 by Bonferroni’s post hoc test.
FIGURE 5
FIGURE 5
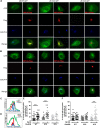
HIP14 and HIP14L differentially modulate trafficking of GluN2B in COS-7 cells. Flag-tagged HIP14 or HIP14L construct, together with GFP-tagged GluN2B WT, GluN2B 5CS or GluN2B 3CS, and HA-tagged GluN1-1A, were transfected into COS-7 cells. 2B-NMDAR and/or HIP14/HIP14L subcellular distribution was assessed by immunostaining with anti-GFP (green channel, GluN2B), anti-Flag (red channel, HIP14 or HIP14L) and cis- and medial-Golgi marker, GOLPH4 (blue channel) 36 h after transfection. (A) GFP-tagged GluN2B alone localizes to the cytoplasm in a diffuse pattern. Exogenous HIP14 promotes the accumulation of GluN2B WT and GluN2B 5CS into the perinuclear region (indicated by GOLPH4). (B) Exogenous HIP14L preferentially promotes the accumulation of GluN2B 3CS into the perinuclear region. Scale bars, 20 μm. (C) Examples of line scan profiles in perinuclear region for GluN2B WT-GFP cotransfected with HIP14-Flag. (D) Examples of line scan profiles in perinuclear region for GluN2B WT-GFP co-transfected with HIP14L-Flag. (E) Line scan analysis for perinuclear region distribution was obtained from 30 cells/condition with or without HIP14 co-transfection. Consistent with images, HIP14 overexpression increases the percentage of cells showing perinuclear colocalization of GluN2B WT and 5CS with GOLPH4. Data was obtained from 3 independent experiments and bars represent means ± SD. Two-way ANOVA, p = 0.013 for interaction, p = 0.016 for mutant, ∗∗∗p < 0.0001 by Bonferroni post hoc tests. (F) Line scan analysis for perinuclear region distribution was obtained from 30 cells/condition with or without HIP14L co-transfection. HIP14L overexpression enhances the percentage of cells showing perinuclear colocalization of GluN2B 3CS with GOLPH4 in perinuclear regions. Data was obtained from 3 independent experiments and bars represent means ± SD. Two-way ANOVA, p = 0.001 for interaction, p = 0.0728 for mutant, ∗∗∗p < 0.0001 by Bonferroni post hoc tests.
FIGURE 6
FIGURE 6
Huntingtin-interacting protein 14 (HIP14) and HIP14L differentially modulate palmitoylation of GluN2B on Cys clusters I and II. GFP-tagged GluN2B WT, GluN2B 5CS and GluN2B 3CS constructs together with HA-tagged GluN1-1A, were transfected in COS cells with or without HIP14-Flag or HIP14L-Flag for 36 h, and GluN2B palmitoylation level changes were detected by ABE assay/western analysis. Each of the representative western blot panels is an example from one blot; the dividing line in (E) indicates where some lanes on the original blot were removed. (A) Representative western blots show that HIP14 significantly enhanced the palmitoylation of GluN2B WT and GluN2B 5CS, but not GluN2B 3CS. (B) Graph summarizing the quantitative analysis for GluN2B palmitoylation with HIP14-Flag co-transfection. The value indicates the percentage of GluN2B antibody intensity where 100% refers to the GluN2B WT control without HIP14. Data is presented from 4 independent experiments as mean ± SD (Two-way ANOVA, p = 0.0114 for HIP14, p = 0.0014 for mutant GluN2B, p = 0.1127 for interaction; p < 0.05, ∗∗∗p < 0.001 by Bonferroni post hoc tests). (C) Representative western blots show that HIP14L enhanced the palmitoylation of GluN2B 3CS but not GluN2B WT or 5CS. (D) Graph summarizing the quantitative analysis from 7 independent experiments (Two-way ANOVA, p = 0.7158 for HIP14L, p = 0.0959 for mutant GluN2B, p = 0.8228 for interaction). Notably, each of the mutant GluN2B constructs showed reduced palmitoylation compared to GluN2B WT in absence of HIP14 (B) or HIP14L (D) by paired t-test (p < 0.05), and the palmitoylation of GluN2B 3CS was increased back to the GluN2B WT level with HIP14L co-transfection in COS-7 cells (paired t-test, p = 0.0343 for 3CS mutant with/without HIP14L). (E) GFP-GluN2B (WT, 5CS, and 3CS) together with HA-GluN1-1A constructs were transfected with either HIP14-Flag or HIP14L-Flag in COS-7 cells; cells were lysed after 36 h and subjected to co-immunoprecipitation with GFP antibody. The interactions were detected with Flag antibody by western blot. Interaction between GluN2B and HIP14L requires the presence of Cluster II cysteines; in contrast, the association of GluN2B with HIP14 is observed in the absence of either one of the GluN2B Cys clusters.
FIGURE 7
FIGURE 7
HIP14L deficiency reduces GluN2B palmitoylation and increases 2B-NMDAR surface expression and NMDA-induced cell death in striatal neurons. Each of the representative western blot panels is an example from one blot; the dividing line in (B) indicates where some lanes on the original blot were removed. (A) GluN2B palmitoylation was significantly increased (41.2 ± 5.32%) in striatum from Hip14–/– mice vs. Hip14+/+ control. Data are presented from 8 independent experiments in which tissue from HIP14–/– and wild-type control were paired; lines connect the points from paired data. Bars represent means ± SD p < 0.05 (Paired t-test, p = 0.0411). (B) GluN2B palmitoylation was significantly decreased in striatum from Hip14L–/– mice (19.1 ± 1.05%) when compared with Hip14L+/+ control. Data are presented from 9 independent experiments, as described in (A). p < 0.05 (Paired t-test, p = 0.0336). (C) The surface expression of 2B-NMDARs in striatal neurons of MSN-CTX co-cultures from FVB/N mice showed a trend toward an increase with 250 nM Hip14 ASO treatment for 10 days (N = 6/38 cells; n.s. p = 0.0676, Non-parametric test, Mann–Whitney U). Representative images are shown in Supplementary Figure S3A. (D) A trend toward decreased surface 2B-NMDARs was observed in MSN-CTX co-cultured striatal neurons from YAC128 mice with 250 nM Hip14 ASO treatment for 10 days (N = 5/42 cells; n.sp = 0.0770, Non-parametric test, Mann–Whitney U). However, these trends did not reach statistical significance for either genotype. Representative images are shown in Supplementary Figure S3B. (E,F) The surface expression of GFP-GluN2B measured at DIV 18 in striatal neurons of MSN-CTX co-cultures from FVB/N mice was significantly increased (22.6 ± 5.72%) when GFP-GluN2B WT was co-transfected with pSuper-Hip14L siRNA (N = 5/51 cells; ∗∗p = 0.0058, non-parametric test, Mann–Whitney U). However, knockdown of HIP14L had no effect on surface expression of GFP-GluN2B in striatal neurons from YAC128 MSN-CTX co-cultures. Representative images are shown in Supplementary Figures 3C,D. (G,H) Neurons were transfected with pSuper-GFP Hip14L siRNA (siRNA+) or pSuper-GFP Scrambled siRNA (control–), treated at DIV 14 with vehicle or 50 μM NMDA for 15 min, returned to conditioned medium at 37°C for 1 h, then fixed and stained with GFP antibody (green, siRNA construct), red stain for TUNEL-positive neurons and DAPI (blue) to identify nuclei. (G) Representative images from cells transfected with pSuper-GFP Hip14L siRNA show a typical TUNEL-positive neuron in the bottom panel (NMDA treated), in which the nucleus is condensed and homogeneously stained with DAPI, and the red TUNEL stain fills the nucleus. (H) The percentage of TUNEL-positive cells among all siRNA-transfected (green) neurons (representing apoptotic cell death) after NMDA treatment was significantly increased upon knockdown of HIP14L in striatal neurons of MSN-CTX co-cultures from FVB/N mice. Experiments were repeated five times and 100–200 cells in each experiment were counted. The results are presented as mean ± SD (one-way ANOVA, p < 0.05, ∗∗∗p < 0.001, Bonferroni’s multiple comparison test).
FIGURE 8
FIGURE 8
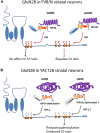
Differential regulation of palmitoylation on two GluN2B Cys clusters by HIP14 and HIP14L. Cartoon diagram of GluN2B structure and modulation by palmitoylation on clusters I and II. (A) In FVB/N striatal neurons, wild-type Htt associates with HIP14 and acts as cofactor to promote HIP14 PAT activity, which can palmitoylate GluN2B Cys cluster I. Wild-type Htt also associates with HIP14L, which can palmitoylate cluster II when cluster I palmitoylation is reduced. Palmitoylation of Cys cluster II but not Cys cluster I regulates GluN2B surface localization in FVB/N striatal neurons. (B) In YAC128 striatal neurons, aggregated mHtt protein decreases its association with HIP14, leading to reduced palmitoylation and PAT enzyme activity, which should impact GluN2B Cys cluster I palmitoylation; however, it is possible that Cys cluster I palmitoylation is compensated by other PATs. As well, aggregated mHtt protein decreases its association with HIP14L, which may contribute to reduced palmitoylation of GluN2B on Cys cluster II and increased surface expression of GluN2B-containing NMDARs. S/I Ratio (surface/internal ratio); formula image Cysteine; formula image palmitate; formula image wtHtt; formula image mHtt; formula image Ankyrin repeat domain (ARD); formula image transmembrane domain (TMD); formula image DHHC domain; formula image DHHC dysfunction.

Similar articles

Cited by

References

    1. Aarts M., Liu Y., Liu Y., Besshoh S., Arundine M., Gurd J. W., et al. (2002). Treatment of ischemic brain damage by perturbing NMDA receptor- PSD-95 protein interactions. Science 298 846–850. 10.1126/science.1072873 - DOI - PubMed
    1. Adibekian A., Martin B. R., Wang C., Hsu K. L., Bachovchin D. A., Niessen S., et al. (2011). Click-generated triazole ureas as ultrapotent in vivo-active serine hydrolase inhibitors. Nat. Chem. Biol. 7 469–478. 10.1038/nchembio.579 - DOI - PMC - PubMed
    1. Arning L., Kraus P., Valentin S., Saft C., Andrich J., Epplen J. (2005). NR2A and NR2B receptor gene variations modify age at onset in Huntington disease. Neurogenetics 6 25–28. 10.1007/s10048-004-0198-8 - DOI - PubMed
    1. Arning L., Saft C., Wieczorek S., Andrich J., Kraus P. H., Epplen J. T. (2007). NR2A and NR2B receptor gene variations modify age at onset in Huntington disease in a sex-specific manner. Hum. Genet. 122 175–182. 10.1007/s00439-007-0393-4 - DOI - PubMed
    1. Arundine M., Tymianski M. (2003). Molecular mechanisms of calcium-dependent neurodegeneration in excitotoxicity. Cell Calcium 34 325–337. 10.1016/S0143-4160(03)00141-6 - DOI - PubMed

LinkOut - more resources