. 2019 Mar;567(7747):244-248.
doi: 10.1038/s41586-019-1003-z. Epub 2019 Mar 6.

S-Geranylgeranyl-L-glutathione is a ligand for human B cell-confinement receptor P2RY8

Affiliations

S-Geranylgeranyl-L-glutathione is a ligand for human B cell-confinement receptor P2RY8

Erick Lu et al. Nature. 2019 Mar.

Abstract

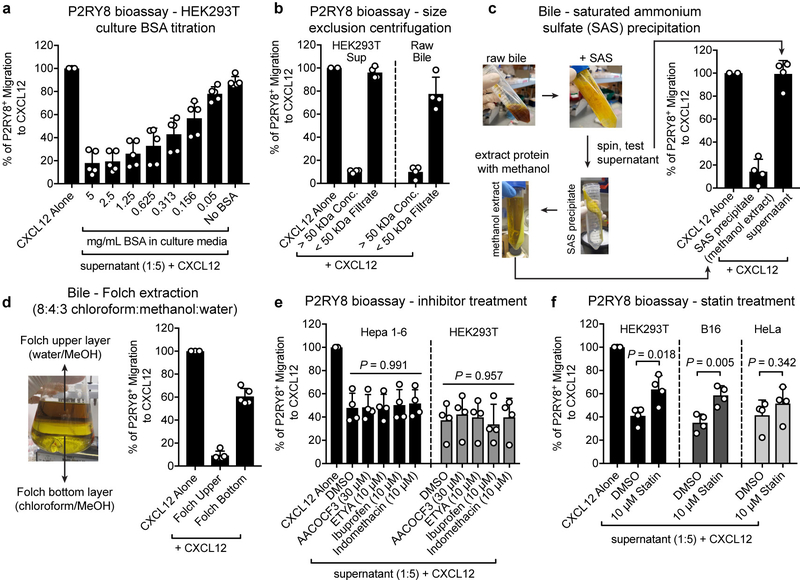
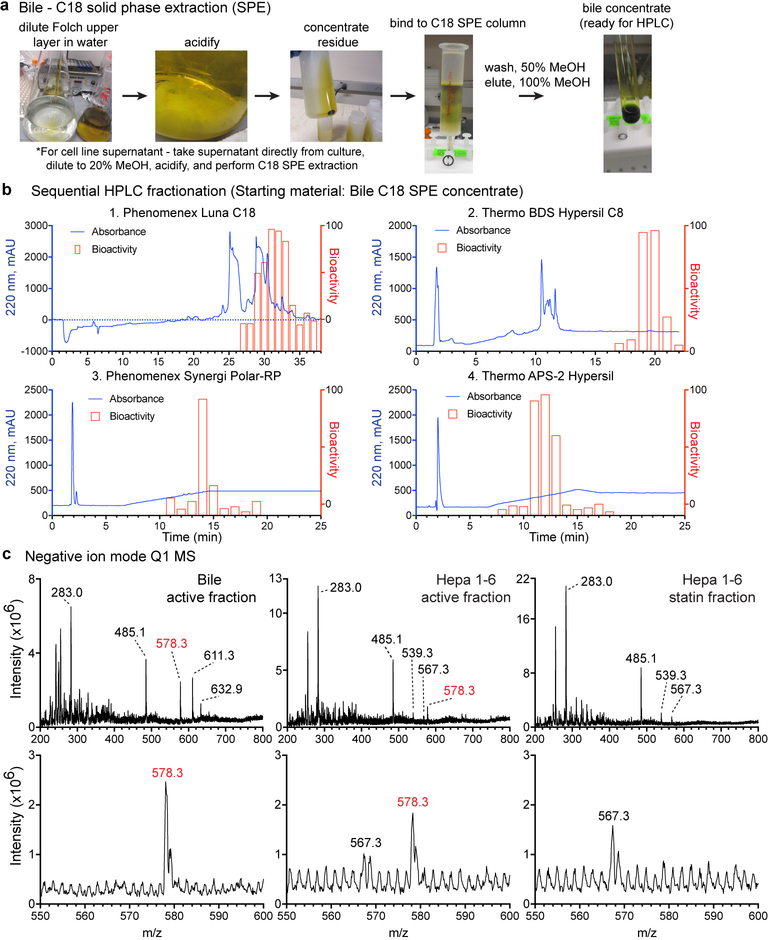
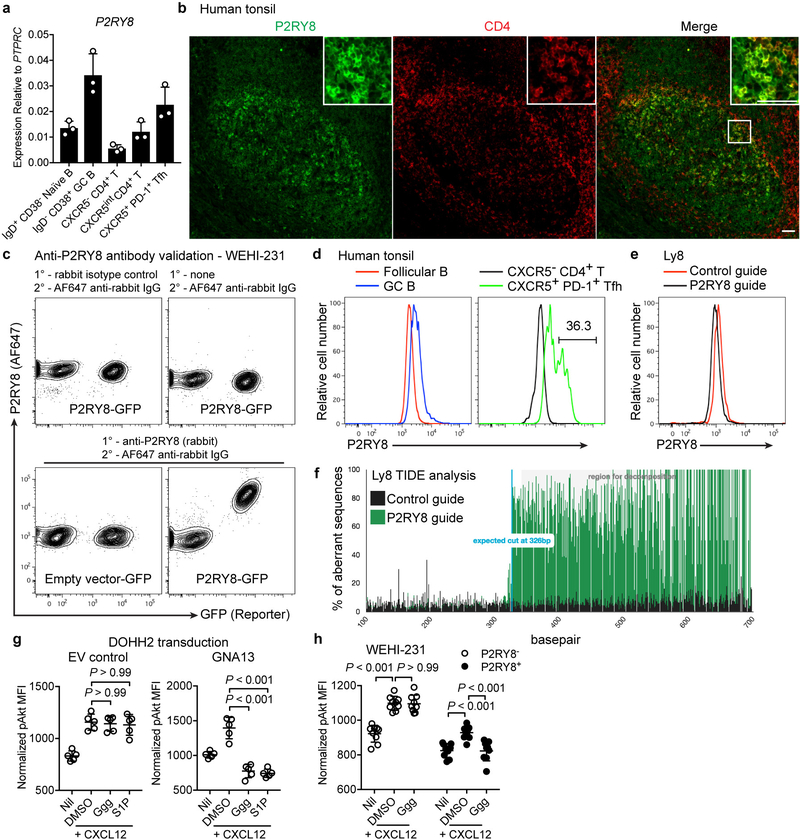
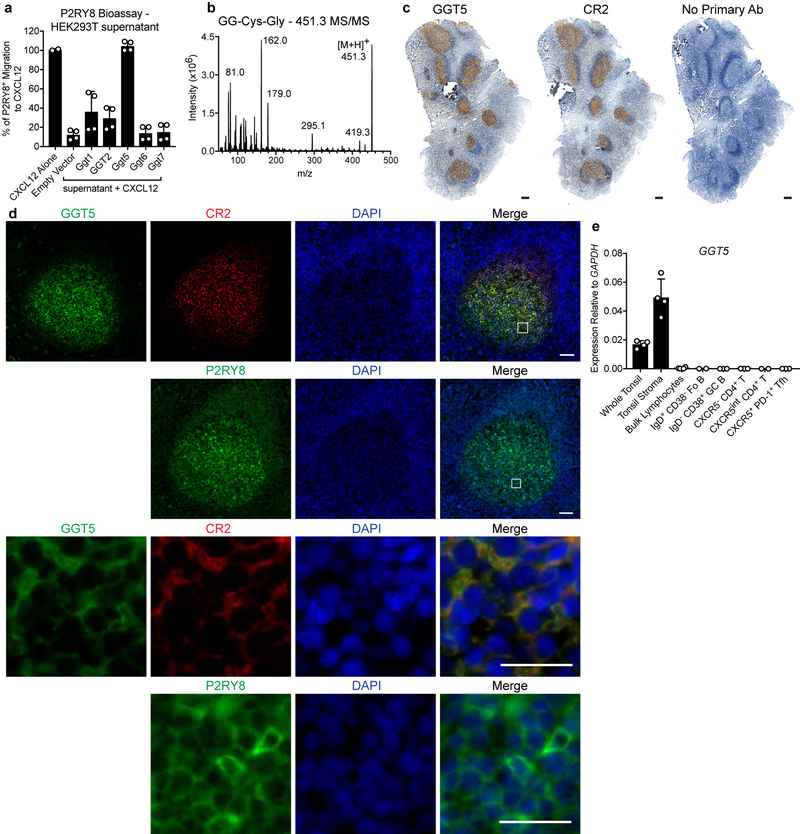
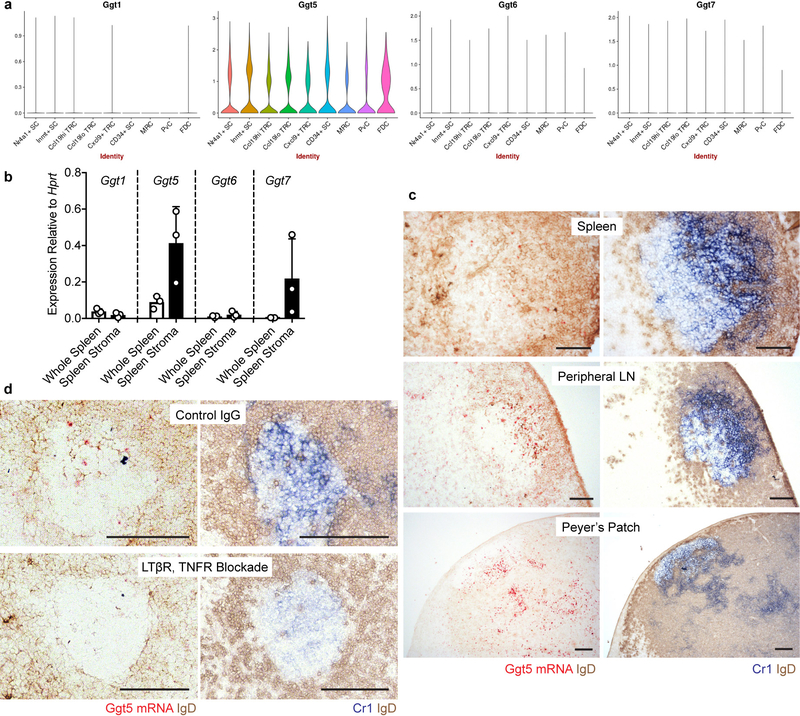
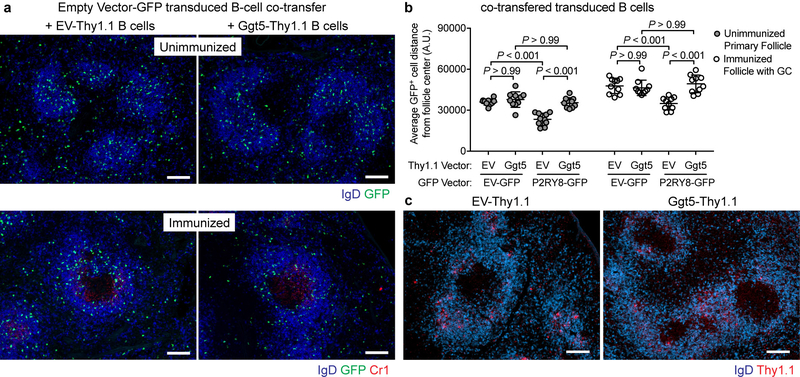
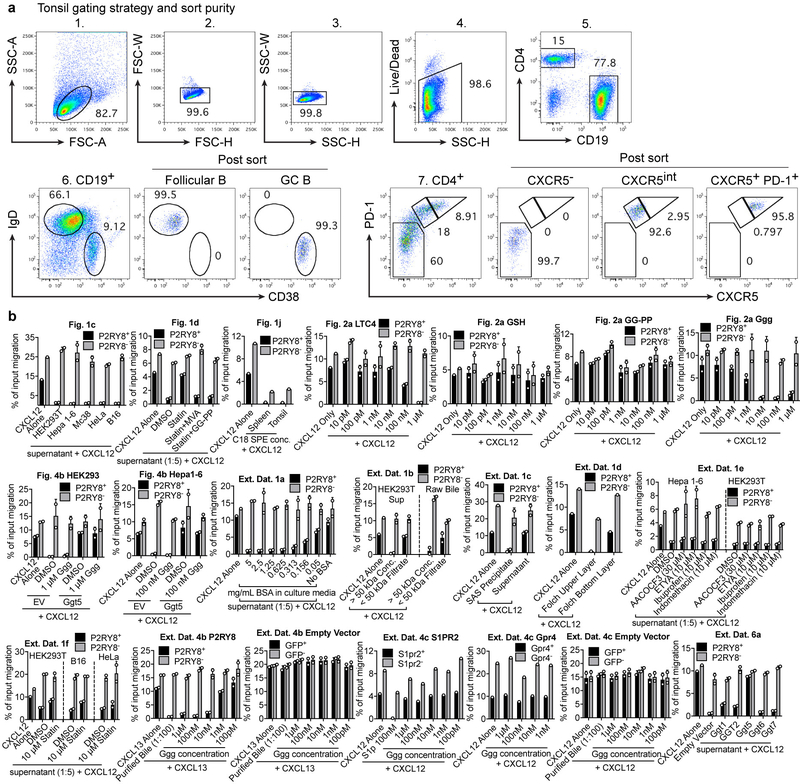
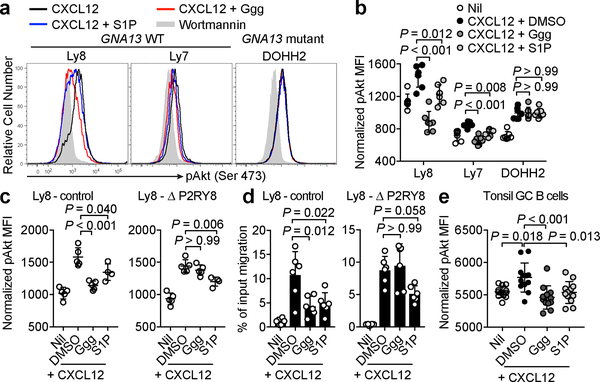
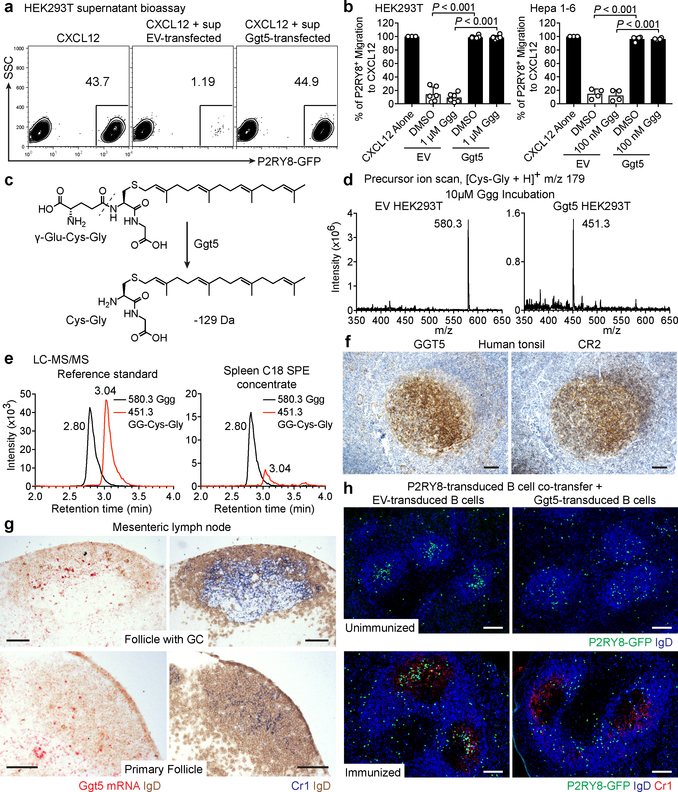
Germinal centres are important sites for antibody diversification and affinity maturation, and are also a common origin of B cell malignancies. Despite being made up of motile cells, germinal centres are tightly confined within B cell follicles. The cues that promote this confinement are incompletely understood. P2RY8 is a Gα13-coupled receptor that mediates the inhibition of migration and regulates the growth of B cells in lymphoid tissues1,2. P2RY8 is frequently mutated in germinal-centre B cell-like diffuse large B cell lymphoma (GCB-DLBCL) and Burkitt lymphoma1,3-6, and the ligand for this receptor has not yet been identified. Here we perform a search for P2RY8 ligands and find P2RY8 bioactivity in bile and in culture supernatants of several mouse and human cell lines. Using a seven-step biochemical fractionation procedure and a drop-out mass spectrometry approach, we show that a previously undescribed biomolecule, S-geranylgeranyl-L-glutathione (GGG), is a potent P2RY8 ligand that is detectable in lymphoid tissues at the nanomolar level. GGG inhibited the chemokine-mediated migration of human germinal-centre B cells and T follicular helper cells, and antagonized the induction of phosphorylated AKT in germinal-centre B cells. We also found that the enzyme gamma-glutamyltransferase-5 (GGT5), which was highly expressed by follicular dendritic cells, metabolized GGG to a form that did not activate the receptor. Overexpression of GGT5 disrupted the ability of P2RY8 to promote B cell confinement to germinal centres, which indicates that GGT5 establishes a GGG gradient in lymphoid tissues. This work defines GGG as an intercellular signalling molecule that is involved in organizing and controlling germinal-centre responses. As the P2RY8 locus is modified in several other types of cancer in addition to GCB-DLBCL and Burkitt lymphoma, we speculate that GGG might have organizing and growth-regulatory roles in multiple human tissues.


Conflict of interest statement

Competing interests

The authors declare no competing interests.

Figures

Extended Data Figure 1.
Extended Data Figure 1.. Dependence of P2RY8 bioactivity production on albumin and the isoprenoid biosynthetic pathway.
(a) Serum-free media containing the indicated amounts of fatty acid-free BSA was placed on HEK293T cells for 16–18 hr. The supernatants from these cultures were combined with CXCL12 in migration media (1:5 dilution) and tested for P2RY8 bioactivity (n=5). (b) P2RY8 ligand bioassay on 50 kDa concentrate (molecules > 50 kDa) vs filtrate (molecules < 50 kDa) from serum-starved HEK293T supernatant (left) or raw mouse bile (right) (n=4). (c) Diagram of protein precipitation from pig bile using saturated ammonium sulfate (SAS) and methanol extraction of the SAS protein precipitate. Graph shows P2RY8 ligand bioassay of the SAS supernatant and methanol extracts from the protein precipitate, as indicated by arrows (n=4). (d) P2RY8 ligand bioassay of the two layers of a Folch extraction prepared by adding chloroform and water to the methanol extract of the SAS precipitate described in (c) (n=5). (e) P2RY8 ligand bioassay on supernatants from Hepa1-6 or HEK293T cells treated with the indicated inhibitors for 16hr (n=4, one-way ANOVA). (f) P2RY8 ligand bioassay on supernatants from HEK293T, HeLa, or B16 cells treated with 10 μM mevastatin or vehicle (DMSO) for 16hr (n=4, unpaired two-tailed t-test for the indicated comparisons). Data are pooled from 3 (a,b,c,d,e,f) independent experiments. Graphs depict mean with s.d. and each point represents a biological replicate.
Extended Data Figure 2.
Extended Data Figure 2.. HPLC Fractionation of P2RY8 bioactivity from bile and Q1 MS candidate identification.
(a) Preparation of a concentrated bile extract from the Folch upper layer described in Extended Data Fig. 1d using acid precipitation, centrifugation, and C18 solid phase extraction. (b) HPLC chromatograms (blue) showing absorbance at 220 nm for each column used for fractionation. Columns were initially tested with a small amount of extract to determine the interval where bioactivity eluted. The bioactivity graphs (red) corresponding to 1 minute fractions are overlaid for the bioactive interval. (c) Full scan (Q1 MS) of purified fractions from the indicated conditions, in negative ion mode. Zoomed-in spectra between m/z 550–600 are shown directly below each Q1 scan. Data are representative of 2 (a,b) or 1 (c) independent experiments.
Extended Data Figure 3.
Extended Data Figure 3.. High resolution MS and fragmentation analysis supports that the bioactive compound is a derivative of glutathione and geranylgeranyl.
(a) Positive ion mode LC-MS total ion chromatogram of purified bile bioactive fraction (red) overlaid with an adjacent non-bioactive fraction (black), on left. High-resolution MS spectra from time 1.79 of the active fraction, on right. (b) MS/MS fragmentation spectra of glutathione in positive ion mode (top left) and negative ion mode (top right), compared with MS/MS spectra of purified bile positive ion 580.3 (bottom left) and negative ion 578.3 (bottom right). CE, collision energy. (c) Positive ion mode MS/MS/MS fragmentation spectra of the 273.1 ion present in the MS/MS spectra of GG-PP (top) and purified bile ion 580.3 (bottom; zoom-in of spectra shown in (b)). (d) Positive ion mode LC-MS total ion chromatogram (left) and high-resolution MS spectra from time 1.79 of chemically synthesized Ggg (right). (e) Negative ion mode MS/MS spectra of the 578.3 ion from chemically synthesized Ggg. Compare to the MS/MS spectra for the 578.3 ion from purified bile in (b). Data are representative of 2 (b,c,e) or 1 (a,d) independent experiments.
Extended data Figure 4.
Extended data Figure 4.. Ggg specifically inhibits migration of P2RY8-expressing WEHI-231 cells.
(a) Representative flow cytometry plots of migration inhibition assays performed with 50 ng/mL CXCL12 and 100 nM Ggg on WEHI-231 cells transduced with empty vector-GFP, P2RY8-GFP, S1PR2-Thy1.1, or Gpr4-Thy1.1. (b) Transwell migration inhibition assay using 500 ng/mL CXCL13 and the indicated amounts of Ggg for P2RY8-GFP and empty vector-GFP transduced WEHI-231 cells (n=4). (c) Summarized data for S1PR2-Thy1.1, Gpr4-Thy1.1, and empty vector-GFP transduced WEHI-231 cells from assays of the type in (a) (S1PR2 and Gpr4 n = 3, empty vector n=4). Data are representative of 2 independent experiments in (a) and pooled from 2 independent experiments in (b, c). Graphs depict mean with s.d. and each point represents a biological replicate.
Extended Data Figure 5.
Extended Data Figure 5.. P2RY8 expression and distribution in human tonsil.
(a) qPCR for expression of P2RY8 in the indicated subsets sorted from human tonsil, relative to PTPRC. (n=3) (b) Immunofluorescence for P2RY8 (green) and CD4 (red) in PFA-fixed human tonsil sections. Inset depicts P2RY8+ and P2RY8high expressing CD4+ cells within the GC and at the GC border. Scale bars, 50 μm. (c) Intracellular flow cytometry using the anti-P2RY8 antibody from (b), which binds the C-terminus of P2RY8, on empty vector-GFP or P2RY8-GFP transduced WEHI-231 (mouse) cells, compared to rabbit isotype control or no-primary antibody staining conditions. (d) Intracellular flow cytometry for P2RY8 in tonsil IgD+ CD38- follicular B cells, IgD- CD38+ GC B cells, CXCR5- CD4+ T cells, or CXCR5+ PD-1+ Tfh cells. (e) Intracellular flow cytometry for P2RY8 in Ly8 cells edited using CRISPR-Cas9 with a control non-targeting guide (red) or a guide targeting P2RY8 (black). (f) TIDE analysis of edited Ly8 cells showing editing efficiency around the expected cut site. (g) pAkt levels in DOHH2 cells transduced with either GNA13 or empty vector (EV), treated as in Figure 3a (n=5). (h) pAkt levels in P2RY8-expressing or control WEHI-231 cells, treated as indicated (n=9). Data are representative of or pooled from 3(a), 4(b) or 2 (d) tonsils, 4 (h), 2 (c,e,g) or 1 (f) experiments. Graphs depict mean with s.d. Points represent biological replicates. One-way ANOVA with Bonferroni’s multiple comparisons test (g,h).
Extended Data Figure 6.
Extended Data Figure 6.. Expression of Ggt5 by human tonsil follicular dendritic cells and fragmentation pattern of S-geranylgeranyl-L-Cys-Gly.
(a) P2RY8 ligand bioassay on supernatants from HEK293T cells transfected with the indicated enzymes (n=4 biological replicates). (b) Positive ion mode MS/MS spectra of the m/z 451.3 metabolite from extracts of the type in Figure 4d, corresponding to S-geranylgeranyl-L-Cys-Gly. (c) Immunohistochemistry for GGT5 or CR2 (brown), in serial sections of human tonsil, counterstained with hematoxylin (blue). Scale bars, 200 μm. (d) Immunofluorescence for GGT5 (green), CR2 (red), and DAPI (blue) in tonsil sections. Serial sections were stained for P2RY8 (green) and DAPI (blue) to visualize the difference between FDC-extensions and GC B-cell membranes. The indicated regions in the upper panels (scale bars, 100 μm) are enlarged in the lower panels (scale bars, 25 μm). (e) qPCR for GGT5 in the indicated tissues and cells from human tonsil, relative to GAPDH. Points within each category represent individual tonsils (whole tonsil=4, tonsil stroma=4, bulk lymphocytes=4, FoB=2, GC B=3, CXCR5- CD4+ T=3, CXCR5int CD4+ T=2, Tfh=3). Data are representative of or pooled from 2 (a,b) independent experiments and data in (c, d) are representative of 4 tonsil specimens. Graphs depict mean with s.d.
Extended Data Figure 7.
Extended Data Figure 7.. Ggt5 is expressed by mouse follicular dendritic cells.
(a) Violin plots from a single cell RNAseq dataset showing relative expression level of Ggt1, Ggt5, Ggt6, and Ggt7 in the indicated stromal cell subsets. (b) qPCR for expression of Ggt1, Ggt5, Ggt6, and Ggt7 in whole spleen tissue or spleen stroma, relative to Hprt. (n=3 biological replicates) (c, d) RNAscope detection of Ggt5 mRNA (red) counterstained with IgD (brown) in the indicated tissues in mice 8 days after immunization with SRBCs (c) or in lymph nodes from mice treated with LTβR-Fc and TNFR-Fc, or a control-IgG for 4 days (d). Serial sections are stained for Cr1 (blue) and IgD (brown). Scale bars, 100 μm. Each point in (b) corresponds to a biological replicate. Data are representative of 5 (c), 2 (d), or 1 (a) biological replicates per condition. Graphs depict mean with s.d. The violin plots in (a) were generated by a webtool (http://scorpio.ucsf.edu/shiny/LNSC/) which does not display the exact minima, maxima, centre, percentiles, or n for each group.
Extended Data Figure 8.
Extended Data Figure 8.. Controls for transduced B-cell co-transfer experiments.
(a) Immunofluorescence images tracking positioning of adoptively transferred B cells overexpressing empty-vector-GFP (green), co-transferred with either empty-vector-Thy1.1 or Ggt5-Thy1.1 overexpressing B cells, in unimmunized (top) or SRBC-immunized (bottom) mice, relative to endogenous B cells (IgD, blue). (b) Quantitation of images of the type in (a) and in Figure 4h, measuring the average distance (A.U., arbitrary units) of GFP+ cells from the center of B-cell follicles using IMARIS software. Each point represents a B-cell follicle, and 3–4 similarly-sized follicles were chosen randomly from 3 mice per condition (n=10 follicles per condition). Graph depicts mean with s.d. One-way ANOVA with Bonferroni’s multiple comparisons test. (c) Immunofluorescence images tracking positioning of adoptively transferred B cells overexpressing Ggt5 or an empty vector control construct from immunized mice of the type in Figure 4h, by staining for Thy1.1 (red) relative to endogenous B cells (IgD, blue). Scale bars, 100 μm. Data are representative of 3 (a,c) biological replicates per condition.
Extended Data Figure 9.
Extended Data Figure 9.. FACS gating strategy and purity.
(a) Flow cytometry plots showing gating scheme used to sort the indicated subsets from human tonsil, along with post-sort purity. (b) For each bioassay performed, representative experiments are graphed as % of input migration for both the transduced and un-transduced WEHI-231 subsets indicated. For Fig 1j, the C18 SPE concentrates exhibited inhibition of overall migration likely due to slight toxicity; however, P2RY8+ cells were more selectively inhibited compared to P2RY8- cells. The baseline migration across experiments differs based on the growth state of the WEHI-231 cells. Graphs depict mean with s.d.
Figure 1.
Figure 1.. Purification and identification of S-geranylgeranyl-L-glutathione as an endogenous compound active on P2RY8.
(a) Diagram of P2RY8 ligand bioassay, depicting migration inhibition of P2RY8+ WEHI-231 cells by extracts containing P2RY8 ligand. (b) Flow cytometry plots of cells from the bottom well of the bioassay described in (a), using mouse liver extract or diluted bile. (c) P2RY8 ligand bioassay of culture media from the indicated cell lines (n=5). (d) P2RY8 ligand bioassay of media from Hepa1-6 cells incubated with the indicated agents (10 μM statin, 100 μM mevalonate (MVA), 100 μM GG-PP or DMSO vehicle) (n=8, one-way ANOVA with Bonferroni’s multiple comparisons test). (e) Diagram of 7-step purification strategy to identify the bioactive compound in bile; asterisks indicate steps used for culture supernatants. Right panel shows scheme for MS detection of candidate ions. (f) Full MS scan (Q1) of purified fractions from the indicated conditions, in positive ion mode. (g) Chemical structure of S-geranylgeranyl-L-glutathione (Ggg). (h) Positive ion mode MS/MS spectra of the 580.3 ion from purified bile (left) and from synthesized Ggg (right). (i) LC-MS/MS quantification of Ggg in C18 solid phase extracts (SPE) of mouse spleen (n=8) and lymph node (n=5), human tonsil (n=6), or mouse bile (n=6). (j) P2RY8 ligand bioassay of C18 SPE concentrates from 500 mg of spleen or tonsil (n=5). Data are representative of or pooled from 3 (b,c,d,h,j,), 2 (i) or 1 (f) experiments. Graphs depict mean with s.d. and each point represents a biological replicate.
Figure 2.
Figure 2.. Ggg inhibits the migration of P2RY8-expressing cells.
(a) P2RY8 ligand bioassay using the indicated concentrations of Ggg, glutathione (GSH), GG-PP, or LTC4 with 50 ng/mL CXCL12 (n=4 biological replicates). (b, c) Transwell migration assays of tonsil cells towards CXCL12 mixed with the indicated concentrations of Ggg. Left plots, representative flow cytometry of CD19+ cells showing the gate for CD38+ IgD- GC B cells (b) or of CD4+ cells showing the gate for PD-1+, CXCR5+ Tfh cells (c). Right graphs show summary data for indicated cell types. (n=3 tonsils, 2 technical replicates each). (d) Internalization assay using cells expressing OX56 epitope-tagged P2RY8, read by measuring surface OX56 levels (representative flow cytometry histogram, left). Right graphs show summarized data for the indicated receptors (n=6 biological replicates, one-way ANOVA with Bonferroni’s multiple comparisons test). Data are pooled from 3 experiments (a,b,c,d). Graphs depict mean with s.d.
Figure 3.
Figure 3.. Ggg suppresses chemokine-induced Akt phosphorylation in cell lines and tonsil GC B cells.
(a, b) Representative histograms (a) and summary data (b) showing pAkt levels in the indicated DLBCL lines treated with wortmannin (grey fill), CXCL12 (black), CXCL12 + S1P (blue), or CXCL12 + Ggg (red) (n=7). (c) pAkt levels in Ly8 cells edited using CRISPR-Cas9 with either a control guide or a guide targeting P2RY8, treated as in (a) (n=5, n=4 for S1P). (d) Transwell migration assay using edited Ly8 cells towards 5 ng/mL CXCL12 along with either 100 nM Ggg, 100 nM S1P, or vehicle (n=6). (e) pAkt levels in tonsil GC B cells, treated as indicated (n = 6 tonsils, 2 replicates each). pAkt MFI data were normalized based on the nil condition. Data are representative of or pooled from 4 (a,b,e) or 3 (c,d) experiments. Graphs depict mean with s.d. Points represent biological replicates. One-way ANOVA with Bonferroni’s multiple comparisons test (b, c, d, e).
Figure 4.
Figure 4.. Ggt5 metabolizes Ggg and regulates P2RY8 function in vivo.
(a, b) Flow cytometry plots (a) and summary data (b) of P2RY8 ligand bioassay of supernatants from the indicated cells overexpressing Ggt5 or empty vector (EV), cultured for 18 hr with Ggg or vehicle (HEK293T n=6, Hepa1-6 n=4 biological replicates, one-way ANOVA with Bonferroni’s multiple comparisons test). Graphs depict mean with s.d. (c) Diagram of Ggg conversion into S-geranylgeranyl-L-Cys-Gly (GG-Cys-Gly). (d) Positive precursor ion scan for m/z 179 to identify ions producing [Cys-Gly]+ fragments, from purified supernatants of HEK293T cells overexpressing EV or Ggt5 and incubated with Ggg. (e) LC-MS/MS MRM for Ggg and GG-Cys-Gly in a mixture of 100 nM Ggg and GG-Cys-Gly, or in C18 SPE concentrates of mouse spleen. (f) Immunohistochemistry for GGT5 or CR2 (brown) in serial sections of tonsil counterstained with hematoxylin (blue). (g) RNAscope for Ggt5 mRNA (red) in mouse lymph node GCs and primary follicles, counterstained with IgD (brown). Serial sections were stained for Cr1 (blue) and IgD (brown). (h) Immunofluorescence for P2RY8-overexpressing B cells (GFP, green) co-transferred with EV or Ggt5-overexpressing B cells, in unimmunized mice without GCs (top), and in GCs (Cr1, red) of immunized mice (bottom), relative to endogenous B cells (IgD, blue). Data are representative of or pooled from 3 (a,b,e) or 2 (d,h) experiments, 3 (h) or 5 (f,g) biological replicates. Scale bars, 100 μm.

Comment in

Similar articles

Cited by

References

    1. Lohr JG et al. Discovery and prioritization of somatic mutations in diffuse large B-cell lymphoma (DLBCL) by whole-exome sequencing. Proc. Natl. Acad. Sci. U. S. A 109, 3879–3884 (2012). - PMC - PubMed
    1. Morin RD et al. Mutational and structural analysis of diffuse large B-cell lymphoma using whole-genome sequencing. Blood 122, 1256–1265 (2013). - PMC - PubMed
    1. Forbes SA et al. COSMIC: mining complete cancer genomes in the Catalogue of Somatic Mutations in Cancer. Nucleic Acids Res. 39, D945–950 (2011). - PMC - PubMed
    1. Muppidi JR et al. Loss of signalling via Galpha13 in germinal centre B-cell-derived lymphoma. Nature 516, 254–258 (2014). - PMC - PubMed
    1. Schmitz R et al. Genetics and Pathogenesis of Diffuse Large B-Cell Lymphoma. N. Engl. J. Med 378, 1396–1407 (2018). - PMC - PubMed

Publication types

MeSH terms