. 2019 Mar 6;10(1):1078.
doi: 10.1038/s41467-019-08902-x.

ABHD5 blunts the sensitivity of colorectal cancer to fluorouracil via promoting autophagic uracil yield

Affiliations

ABHD5 blunts the sensitivity of colorectal cancer to fluorouracil via promoting autophagic uracil yield

Juanjuan Ou et al. Nat Commun. .

Abstract

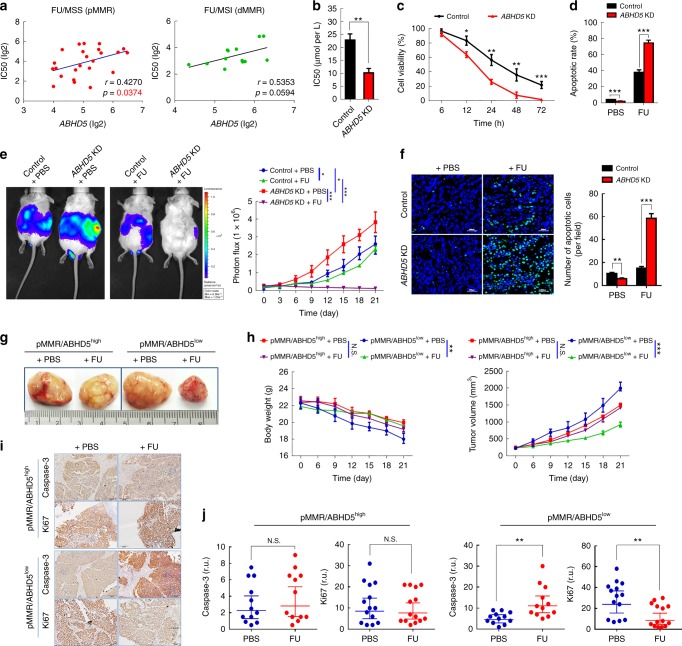
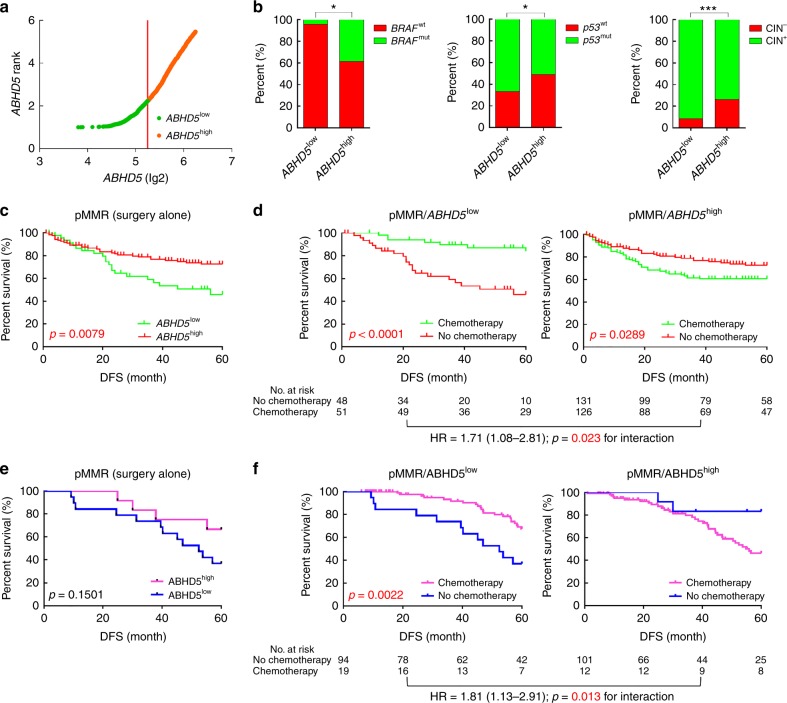
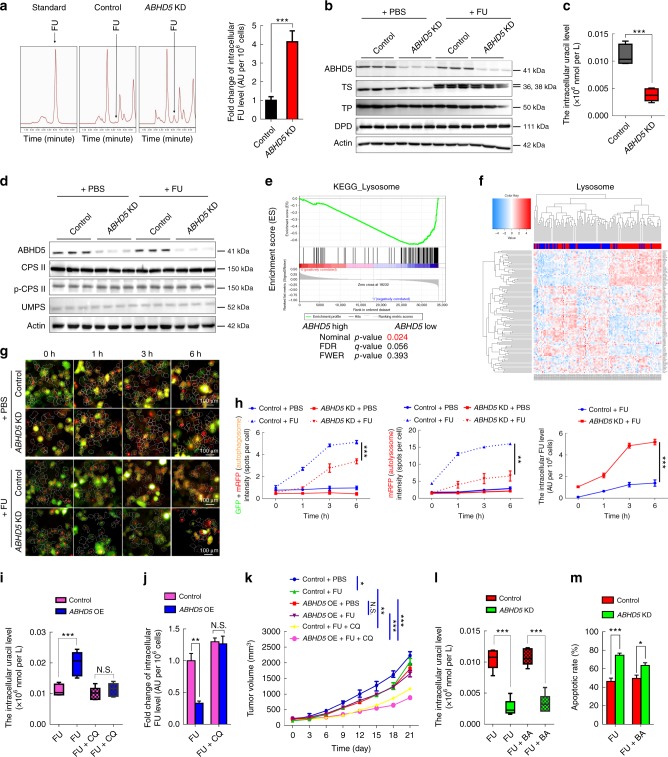
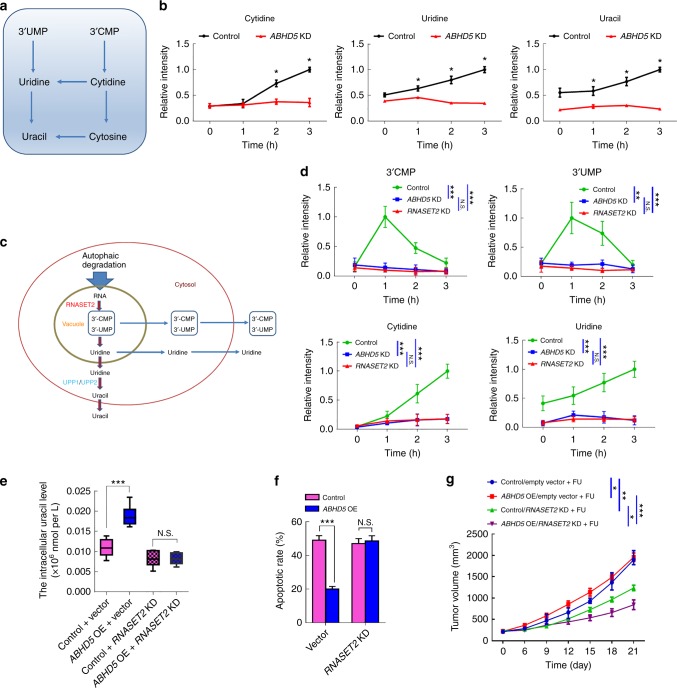
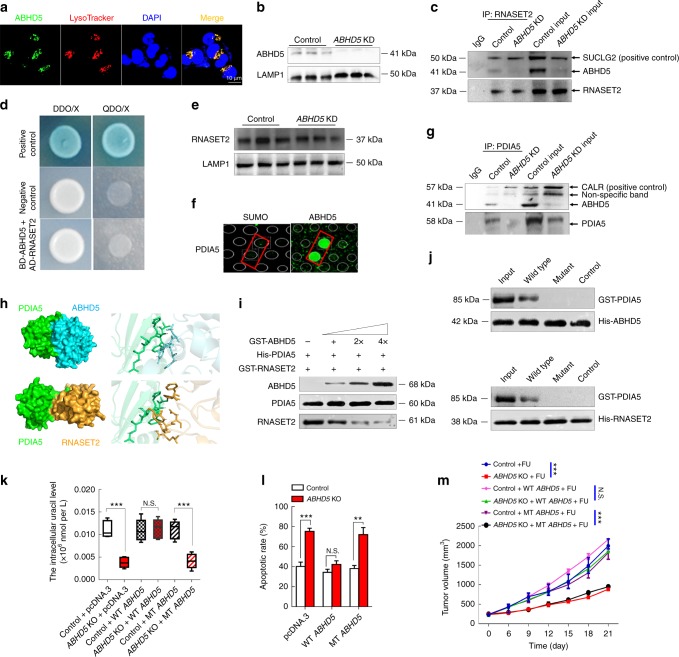
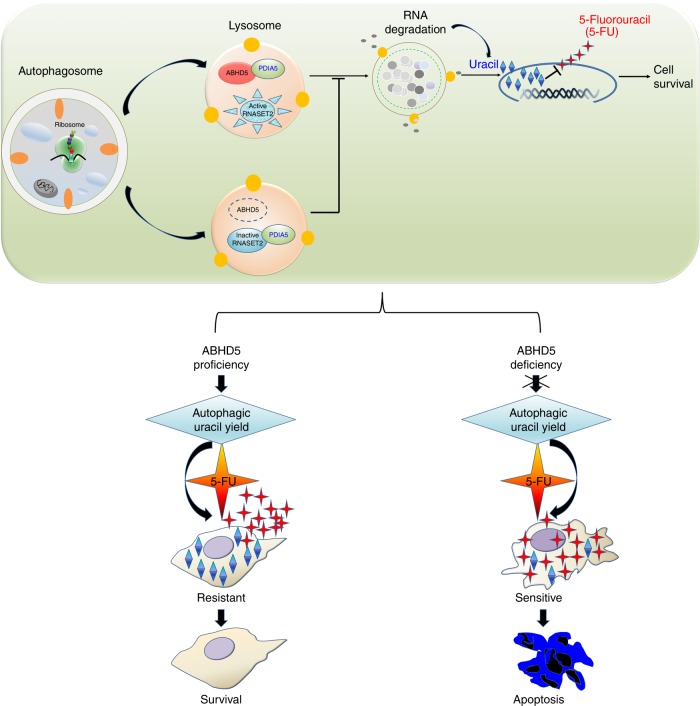
The efficacy of Fluorouracil (FU) in the treatment of colorectal cancer (CRC) is greatly limited by drug resistance. Autophagy has been implicated in chemoresistance, but the role of selective autophagic degradation in regulating chemoresistance remains unknown. In this study, we revealed a critical role of ABHD5 in charging CRC sensitivity to FU via regulating autophagic uracil yield. We demonstrated that ABHD5 localizes to lysosome and interacts with PDIA5 to prevent PDIA5 from interacting with RNASET2 and inactivating RNASET2. ABHD5 deficiency releases PDIA5 to directly interact with RNASET2 and leave RNASET2 in an inactivate state, which impairs RNASET2-mediated autophagic uracil yield and promotes CRC cells to uptake FU as an exogenous uracil, thus increasing their sensitivity to FU. Our findings for the first time reveal a novel role of ABHD5 in regulating lysosome function, highlighting the significance of ABHD5 as a compelling biomarker predicting the sensitivity of CRCs to FU-based chemotherapy.


Conflict of interest statement

The authors declare no competing interests.

Figures

Fig. 1
Fig. 1
ABHD5 impedes the sensitivity of pMMR CRCs to FU. a Analyses from the GDSC (Genomics of Drug Sensitivity in Cancer) dataset revealed the correlation between ABHD5 proficiency and the sensitivity to FU in pMMR or dMMR CRC cell lines (Pearson’s correlations). b MTT assay determining the IC50 of ABHD5 knockdown (ABHD5 KD) and control SW480 cells (n = 3, Student’s t-test). c MTT assay determining the cell viability at different time points during FU (25 μM) treatment (n = 4, Student’s t-test). d Fluorescence activated cell sorting (FACS) showing the apoptotic rate of cells stained with Annexin V-PE/7AAD following 24 h of treatment with PBS or FU (25 μM) (n = 4, Student’s t-test). e, f ABHD5 KD and control SW480 cells were inoculated intra-abdominally into NOD-SCID mice, and intraperitoneal injection (i.p.) of PBS or FU (50 mg per kg) + calcium folinate (80 mg per kg) was administrated once per week for 3 weeks. Tumor burden was measured by bioluminescent imaging (n= 5, Two-way ANOVA) (e), and the xenografts were stained with TUNEL to calculate apoptotic cells (n = 5, Student’s t-test) (f). Scale bar: 200 μm. gj pMMR/ABHD5high or pMMR/ABHD5low xenografts were established in PDX mice, and the mice were treated with PBS or FU (50 mg per kg) + calcium folinate (80 mg per kg) (i.p., once per week for 3 weeks) when tumor volume reached about 100 mm3. Representative macroscopic views showing the xenografts in the indicated subgroups (g); plot representing the evolution of the body weight and tumor volume of xenografts in the indicated groups (n = 5, Two-way ANOVA) (h); the proliferating and apoptotic cells in the dissected xenografts were immunostained with Ki67 or caspase-3 (i) and analyzed (Horizontal lines indicate arithmetic mean values, and error bars show the 95% CI. r.u., relative units. n = 12, Student’s t-test) (j). The quantitative data were presented as mean ± S.D (error bar) (N.S. no significant, *p< 0.05, **p< 0.01, ***p< 0.001)
Fig. 2
Fig. 2
ABHD5 expression and the benefit from FU-based adjuvant chemotherapy. ad The StepMiner algorithm was used to stratify the population of 361 pMMR CRC patients (stage II/III) in the NCBI-GEO dataset into ABHD5high and ABHD5low subgroups, and the association of ABHD5 with prognosis and benefit from FU-based adjuvant chemotherapy was evaluated. a Three hundred and sixty-one pMMR CRC patients were stratified into ABHD5high and ABHD5low subgroups based on mRNA levels (StepMiner). b ABHD5high tumors were significantly more likely to be BRAF mutant (BRAF MT) and p53 wild type (p53 WT) and CIN negative (CIN−), and ABHD5low tumors were significantly more likely to be BRAF wild type (BRAF WT) and p53 mutant (p53 MT) and CIN positive (CIN+) (*p< 0.05, ***p< 0.001, χ2-test). c DFS in the subgroup of pMMR/ABHD5low or pMMR/ABHD5high who received surgery alone (Log-rank test). d DFS in pMMR/ABHD5low or pMMR/ABHD5high subgroup treated with or without FU-based adjuvant chemotherapy (Log-rank test, Cox proportional regression). e, f A human CRC tissue microarray containing 432 pMMR patient tumor samples from our hospital was analyzed. The samples were stratified into pMMR/ABHD5high or pMMR/ABHD5low subgroups based on the immunostaining score for MMR status and ABHD5 proficiency. e DFS in the subgroup of pMMR/ABHD5low or pMMR/ABHD5high who received surgery alone (Log-rank test). f DFS in the pMMR/ABHD5low or pMMR/ABHD5high subgroup treated with or without FU-based adjuvant chemotherapy (Log-rank test, Cox proportional regression)
Fig. 3
Fig. 3
ABHD5 proficiency determines the FU uptake of CRC cells. a The cells were exposed to PBS or FU (25 μM) for 6 h, and the intracellular concentrations of FU were measured by HPLC (n = 3, Student’s t-test). b Western blots of indicated proteins in the cells 24 h following PBS or FU (25 μM) treatment. c The cells were exposed to FU (25 μM) for 6 h, and the concentrations of cellular uracil was analyzed by LC/MS (n = 6, Student’s t-test). d Western blots of indicated proteins in the cells 24 h after exposure to PBS or FU (25 μM). e GSEA analysis of the lysosome pathway. f The hierarchical clustering analysis showing the different expression pattern of the genes involved in the lysosome pathway. g HCS images showing RFP/GFP labeled LC3 staining in the cells at different time points. h Statistical analysis of autophagosome and autolysosome in the cells at different time points, and the corresponding intracellular FU levels are shown (n = 3, Two-way ANOVA);. i, j The cells were treated with FU (25 μM) alone or FU (25 μM) + CQ (50 μM) for 6 h. The concentrations of cellular uracil (i) and the intracellular FU (j) were measured (n = 6, Student’s t-test). k ABHD5 overexpression (ABHD5 OE) and control cells were inoculated subcutaneously in nude mice, and the mice were treated with PBS, FU (50 mg per kg) + calcium folinate (80 mg per kg) or FU (50 mg per kg) + calcium folinate (80 mg per kg) + CQ (150 mg per kg) (i.p., once per week for 3 weeks). Tumor burden was measured every 3 days (n = 5, Two-way ANOVA). l, m The cells were treated with FU (25 μM) alone or FU (25 μM) + BECN1 activator (BA) (10 μM) for 6 h (l) or 24 h (m). The concentrations of intracellular uracil (l) and the apoptotic rate (m) were analyzed (n = 6, Student’s t-test). The quantitative data were presented as mean ± S.D (error bar) (N.S. no significance, *p< 0.05, **p< 0.01, ***p< 0.001)
Fig. 4
Fig. 4
RNASET2 mediates ABHD5-induced autophagic uracil yield. a Schematic representation of reactions of the uracil-related nucleotide degradation pathway. b Nucleosides and nucleobases measurement at the different time points in the cells treated with FU (25 μM). The results are presented as normalized intensities on the basis of the peak height of each metabolite in control cells (n = 6, Student’s t-test). c Schematic representation of the pathway for autophagy-dependent RNA degradation in mammalian cells. d RNASET2 knockdown (RNASET2 KD), ABHD5 KD, and control SW480 cells were treated with FU (25 μM). Nucleosides and 3’-NMPs were analyzed at different time points. The results are presented as normalized intensities on the basis of the peak height of each metabolite in control cells (n = 3, Two-way ANOVA). e RNASET2-silenced ABHD5 OE and control SW480 cells were treated with FU (25 μM) for 6 h, and the concentrations of cellular uracil were analyzed (n = 6, Student’s t-test). f RNASET2-silenced ABHD5 OE and control SW480 cells were treated with FU (25 μM) for 24 h, and the apoptotic rates were analyzed (n = 5, Student’s t-test). g RNASET2-silenced ABHD5 OE and control SW480 were subcutaneously inoculated in nude mice, and the mice were treated with PBS or FU (50 mg per kg) + calcium folinate (80 mg per kg) (i.p., once per week for 3 weeks). Tumor volume was measured every 3 days (n= 5, Two-way ANOVA). The quantitative data were presented as mean ± S.D (error bar) (N.S. no significance, *p< 0.05, **p< 0.01, ***p< 0.001)
Fig. 5
Fig. 5
ABHD5 sustains the activity of RNASET2. a Representative images of immunofluorescent stainings of lysosome (stained by Lysotracker, red) and ABHD5 (green) in SW480 cells. Scale bar: 10 μm. b Western blots showing ABHD5 expression in the lysosome lysates of ABHD5 KD and control cells. LAMP1 was used as a reference. c Immunoprecipitation showing an interaction between ABHD5 and RNASET2. SUCLG2 was used as a positive control. d Yeast two-hybrid assay showing a negative result for the direct interaction between ABHD5 and RNASET2. e Western blots of RNASET2 expression in the lysosome lysates of ABHD5 KD and control cells. f A direct interaction between ABHD5 and PDIA5 was shown based on HuProtTM human protein chip. g Immunoprecipitation showing an interaction between ABHD5 and PDIA5. CALR was used as a positive control. h The interaction complex model between ABHD5, PDIA5, and RNASET2 predicted by protein-protein docking methods. i Competitive binding assays of ABHD5 and RNASET2 to PDIA5. j In vitro binding assay with wild type PDIA5 (W) or mutant PDIA5 (T) and His-tagged RNASET2 or ABHD5 as indicated. k ABHD5 knockout (ABHD5 KO) and control SW480 cells were transfected with wild type ABHD5 or mutant ABHD5 plasmid, and subjected to FU treatment (25 μM) for 6 h. The intracellular uracil was analyzed (n = 6, Student’s t-test). l ABHD5 KO and control SW480 cells were transfected with wild type ABHD5 or mutant ABHD5 plasmid, and subjected to FU treatment (25 μM) for 24 h. The apoptotic rates were analyzed (n = 5, Student’s t-test). m ABHD5 KO and control SW480 cells transfected with wild type ABHD5 or mutant ABHD5 plasmid were subcutaneously inoculated in nude mice, and intraperitoneal injection of PBS or FU (50 mg per kg) + calcium folinate (80 mg per kg) (i.p., once per week for 3 weeks). Tumor volume was measured every 3 days (n= 5, Two-way ANOVA). The quantitative data were presented as mean ± S.D (error bar) (N.S. no significance, **p< 0.01, ***p< 0.001)
Fig. 6
Fig. 6
The proposed mechanism underlying ABHD5-induced FU resistance. ABHD5 localizes to lysosome and shares share a common interaction domain in PDIA5 with RNASET2. ABHD5 directly interacts with PDIA5 to prevent PDIA5 from directly interacting with RNASET2 and inactivating RNASET2. ABHD5 deficiency releases PDIA5 to directly interact with RNASET2 and leave RNASET2 in an inactivate state, which impairs RNASET2-induced autophagic uracil yield. ABHD5 deficiency promotes CRC cells to uptake FU as an exogenous uracil, thus increasing their sensitivity to FU. In contrast, ABHD5 proficient CRC cells showed an inherent resistance to FU due to an increased autophagic uracil yield

Similar articles

Cited by

References

    1. Siegel R, Desantis C, Jemal A. Colorectal cancer statistics, 2014. Ca. Cancer J. Clin. 2014;64:104–117. doi: 10.3322/caac.21220. - DOI - PubMed
    1. Moertel CG, et al. Levamisole and fluorouracil for adjuvant therapy of resected colon carcinoma. N. Engl. J. Med. 1990;322:352–358. doi: 10.1056/NEJM199002083220602. - DOI - PubMed
    1. Zhang N, Yin Y, Xu SJ, Chen WS. 5-fluorouracil: mechanisms of resistance and reversal strategies. Molecules. 2008;13:1551–1569. doi: 10.3390/molecules13081551. - DOI - PMC - PubMed
    1. Levine B, Klionsky DJ. Development by self-digestion: molecular mechanisms and biological functions of autophagy. Dev. Cell. 2004;6:463–477. doi: 10.1016/S1534-5807(04)00099-1. - DOI - PubMed
    1. Rabinowitz JD, White E. Autophagy and metabolism. Science. 2010;330:1344–1348. doi: 10.1126/science.1193497. - DOI - PMC - PubMed

Publication types

MeSH terms