. 2019 Apr 8;49(1):130-144.e6.
doi: 10.1016/j.devcel.2019.01.027. Epub 2019 Feb 28.

Phosphorylation of Syntaxin 17 by TBK1 Controls Autophagy Initiation

Affiliations

Phosphorylation of Syntaxin 17 by TBK1 Controls Autophagy Initiation

Suresh Kumar et al. Dev Cell. .

Abstract

Syntaxin 17 (Stx17) has been implicated in autophagosome-lysosome fusion. Here, we report that Stx17 functions in assembly of protein complexes during autophagy initiation. Stx17 is phosphorylated by TBK1 whereby phospho-Stx17 controls the formation of the ATG13+FIP200+ mammalian pre-autophagosomal structure (mPAS) in response to induction of autophagy. TBK1 phosphorylates Stx17 at S202. During autophagy induction, Stx17pS202 transfers from the Golgi, where its steady-state pools localize, to the ATG13+FIP200+ mPAS. Stx17pS202 was in complexes with ATG13 and FIP200, whereas its non-phosphorylatable mutant Stx17S202A was not. Stx17 or TBK1 knockouts blocked ATG13 and FIP200 puncta formation. Stx17 or TBK1 knockouts reduced the formation of ATG13 protein complexes with FIP200 and ULK1. Endogenous Stx17pS202 colocalized with LC3B following induction of autophagy. Stx17 knockout diminished LC3 response and reduced sequestration of the prototypical bulk autophagy cargo lactate dehydrogenase. We conclude that Stx17 is a TBK1 substrate and that together they orchestrate assembly of mPAS.

Keywords: TBK1; ULK1; autophagy; pre-autophagosomal structure.


Conflict of interest statement

Declaration of Interest: Gary Kasof is employed by Cell Signaling Technology.

Figures

Figure 1.
Figure 1.. TBK1 interacts with and phosphorylates Stx17 at Ser-202
(A) MS analysis showing comparison of GFP or GFP-Stx17 peptides in co-IPs with TBK1, extracted from Table S1(upper panel). Co-IP between endogenous Stx17 and TBK1 in 293T cells (lower panel). (B) Co-IP of FLAG-Stx17 with Myc-TBK1WT or Myc-TBK1K38D in 293 T cells. * indicates the phospho-shift in FLAG-Stx17 induced by Myc-TBK1WT (lane 2) and not by Myc-TBK1K38D (lane 3). (C) Mass-spec analysis showing phosphorylation of FLAG-Stx17 at Ser-202 residue induced by Myc-TBK1 (right panel) and not by Myc alone (left panel). (D) Western blot analysis of Stx17pS202 levels in WT, Stx17KO and TBK1KO HeLa cells treated with 500 ng/ml of LPS for 4h. White asterisk, Stx17pS202 (note minor levels in TBK1 knockout cells). (E) A schematic showing phosphorylation of Stx17 at Ser-202 residue by TBK1. See also Figure S1 and Table S1.
Figure 2.
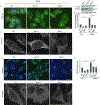
Figure 2.. Stx17pS202 is localized in the Golgi.
(A) Confocal microscopy analysis of colocalization between Stx17pS202 and GM130 in WT (upper panel) or Stx17KO HeLa cells (lower panel). (B) Membrane fractionation using OptiPrep gradients to analyze sub cellular fractionation of Stx17pS202. (C) Confocal microscopy analysis of Stx17pS202 redistribution to peripheral puncta in response to autophagy induction by incubation with EBSS for 1h (Lower panel). (D, E) High content microscopy (HC) of HeLa cells showing colocalization between Stx17pS202 and GM130 in full and starved (1h EBSS) conditions. **, p < 0.01, (n=3) t-test, from 3 independent experiments (>500 primary object examined per well; minimum number of wells, 30). Green masks, algorithm-defined cell boundaries (primary objects); yellow masks, computer-identified overlap between Stx17pS202 and GM130 (target objects); green masks, computer-identified Stx17pS202 dots. Images, a detail form a large database of machine-collected and computer-processed images. (F, G) High content microscopy and quantification to analyze the redistribution of Stx17pS202 to peripheral puncta in response to autophagy induction by starvation. **, p < 0.01, (n=3) t-test. from 3 independent experiments (>500 primary object examined per well; minimum number of wells, 30). White masks, algorithm-defined cell boundaries (primary objects); yellow masks, computer-identified Stx17pS202 dots. Images, a detail form a large database of machine-collected and computer-processed images. (H) A model depicting translocation of Stx17pS202 from Golgi to peripheral puncta upon induction of autophagy with starvation. Scale bars: confocal images 5 μm; HC images, 10 μm. See also Figure S2.
Figure 3.
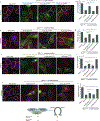
Figure 3.. Stx17 and TBK1 are required for formation of mPAS.
(A,B) HC analysis of effect of Stx17 and TBK1 knockouts on formation of ATG13 puncta in HeLa cells induced for autophagy by incubating in EBSS for 1h. White masks, algorithm-defined cell boundaries (primary objects); green masks, computer-identified ATG13 dots. Images, a detail from a large database of machine-collected and computer-processed images (see B). Western blot panel shows Stx17 and TBK1 knockouts in HeLa cells. Panel to the right, Western blot showing TBK1 and Stx17 knockouts in HeLa cells. (B) High content quantifications showing the effect of Stx17 and TBK1 knockouts on formation of ATG13 puncta in HeLa cells induced for autophagy by incubating in EBSS for 1h. Scale bar 10 μm. **, p < 0.01, (n=3) ANOVA; from 4 independent experiments (>500 primary object examined per well; minimum number of wells, 60). (C) Confocal microscopy showing the effect of Stx17 and TBK1 knockouts on formation of ATG13 puncta in HeLa cells incubated in full media or induced for autophagy by incubation with EBSS for 1h. Scale bar 5 μm. (D, E) High content microscopy and quantifications showing the effect of Stx17 and TBK1 knockouts on formation of FIP200 puncta in HeLa cells incubated in full media or EBSS for 1h. Scale bar 10 μm. **, p < 0.01, (n=3) ANOVA; from 4 independent experiments (>500 primary object examined per well; minimum number of wells, 60). Blue masks, algorithm-defined cell boundaries (primary objects); green masks, computer-identified FIP200 dots. Images, a detail form a large database of machine-collected and computer-processed images. (F) Confocal microscopy analysis of the effect of Stx17 and TBK1 knockouts on formation of FIP200 puncta in HeLa cells induced for autophagy by incubating in EBSS for 1h. Scale bar 5 μm. See also Figure S3.
Figure 4.
Figure 4.. Phosphorylation of Stx17 by TBK1 is required for formation of ATG13 and FIP200 puncta.
(A,B) HC analysis of effect of complementation of Stx17KO cells with FLAG-Stx17WT, FLAG-Stx17S202A and FLAG-Stx17S202D on formation of ATG13 dots in response to autophagy induction by incubation with EBSS for 1h. White masks, computer-identified FLAG positive cells (primary objects); red masks, computer-identified ATG13 dots in FLAG transfected cells. HeLa WT (left) were left un-transfected for control. (Scale bar 10 μm). **, p < 0.01, (n=3) ANOVA. (C,D) HC analysis to analyze the effect of complementation of Stx17KO with FLAG-Stx17 WT, FLAG-Stx17S202A and FLAG-Stx17S202D on formation of FIP200 dots in response to autophagy induction by incubation with EBSS for 1h. White masks, computer-identified FLAG positive cells (primary objects); red masks, computer-identified FIP200 dots in FLAG transfected cells. Scale bar 10 μm. **, p < 0.01, (n=3) ANOVA. (E,F). HC analysis of effect of cross-complementation of TBK1KO cells with FLAG-Stx17WT, FLAG-Stx17S202A and FLAG-Stx17S202D on formation of FIP200 dots in response to autophagy induction by incubation with EBSS for 1h. White masks, computer-identified FLAG positive cells (primary objects); red masks, computer-identified ATG13 dots in FLAG transfected cells.White masks, computer-identified FLAG positive cells (primary objects); red masks, computer-identified ATG13 dots in FLAG transfected cells. Scale bar 10 μm. **, p < 0.01, (n=3) ANOVA. (G,H) HC analysis of effect of cross-complementation of TBK1KO cells with FLAG-Stx17WT, FLAG-Stx17S202A and FLAG-Stx17S202D on formation of FIP200 dots in response to autophagy induction by incubation with EBSS for 1h. White masks, computer-identified FLAG positive cells (primary objects); red masks, computer-identified ATG13 dots in FLAG transfected cells. Scale bar 10 μm. **, p < 0.01, (n=3) ANOVA. (I) A model depicting the effect of Stx17 on formation of mammalian pre-autophagosomal structures and omegasomes. In HC experiments (A-H), Images are details from a large database of machine-collected and computer-processed images; data are from 3–5 independent experiments (>500 primary object examined per well; minimum number of wells, 12). See also Figure S4.
Figure 5.
Figure 5.. Stx17pS202 interacts with ATG13 and FIP200.
(A, B) Co-IP showing interactions of endogenous ATG13 (A) or FIP200 (B) with Stx17pS202 in 293 T cells. (C) Co-IP analysis of interactions between FLAG tagged Stx17 WT, Stx17 S202A or Stx17 S202D and ATG13 in 293T cells. (D) Graph showing quantifications of interactions between ATG13 and FLAG-Stx17 variants. **, p < 0.01, (n=3) ANOVA. (E) Co-IP analysis of interactions between FLAG tagged Stx17 WT, Stx17 S202A or Stx17 S202D with endogenous FIP200 in 293T cells. (F) Graph showing quantifications between FIP200 and FLAG-Stx17 variants. **, p < 0.01, (n=3) ANOVA. (G) Confocal microscopy analysis of colocalization between endogenous ATG13 and Stx17pS202 in BMMs incubated with EBSS for 1h. Scale bar 5 μm. (H,I) HC microscopy analysis and quantifications of colocalization between ATG13 and Stx17pS202 in BMMs incubated in full media or induced for autophagy by incubation with EBSS for 1h. Blue masks, algorithm-defined cell boundaries (primary objects); yellow masks, computer-identified overlap between Stx17pS202 and ATG13 dots. **, p < 0.01, (n=3) t-test. (J) Confocal microscopy analysis of colocalization between GFP-FIP200 and Stx17pS202 in HeLa cells incubated with EBSS for 1h. (K, L) HC microscopy analysis and quantifications showing colocalization between GFP-FIP200 and Stx17pS202 in HeLa cells transfected with GFP-FIP200 and incubated in full media or induced for autophagy by incubation with EBSS for 1h. Blue masks, computer-identified GFP-FIP200 positive cells (primary objects); yellow masks, computer-identified overlap between Stx17pS202 and GFP-FIP200 dots in GFP positive cells. **, p < 0.01, (n=3) t-test. (M) Confocal microscopy analysis of colocalization between GFP-ULK1 and Stx17pS202 in HeLa cells incubated with EBSS for 1h. (N, O) High content microscopy and quantifications showing colocalization between GFPULK1 and Stx17pS202 in HeLa cells transfected with GFP-ULKL1 and incubated in full media or induced for autophagy by incubation with EBSS for 1h. White masks, computer-identified GFP-ULK1 positive cells (primary objects); yellow masks, computer-identified overlap between Stx17pS202 and GFP-ULK1 dots in GFP positive cells. **, p < 0.01, (n=3) t-test. Masks; white: GFP-ULK1 positive objects cells; yellow: number of Stx17pS202 dots also positive for GFP-ULK1 dots. (P) A model showing Stx17pS202 as an interacting partner of mPAS complex. In HC experiments (H,I,K,L,M,O), images are details from a large database of machine-collected and computer-processed images; data are from 3 independent experiments (>500 primary object examined per well; minimum number of wells, 20). See also Figure S4.
Figure 6.
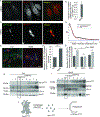
Figure 6.. Stx17pS202 is on LC3-positive autophagosomes upon induction of autophagy.
(A) Confocal microscopy showing colocalization between GFP-LC3B and Stx17pS202 in HeLa cells incubated with EBSS for 2h. Scale bar 5 μm. (B) Pearson’s correlation coefficient (>20 cells) of colocalization between GFP-LC3B and Stx17pS202. (C, D) Super-resolution microscopy to analyze colocalization between GFP-LC3B and Stx17pS202 in HeLa cells incubated with EBSS for 2h. Scale bar 500nm. (E,F) HC microscopy and quantifications showing colocalization between GFP-LC3B and Stx17pS202 in HeLa cells incubated in full media or in EBSS for 2h. Scale bar 10 μm. **, p < 0.01, (n=3) t-test. Blue masks, algorithm-defined GFP-LC3B positive cells (primary objects); yellow masks, computer-identified overlap between Stx17pS202 and GFP-LC3B dots. Images are details form a large database of machine-collected and computer-processed images, (G) HC quantifications showing colocalization between FLAG-Stx17 WT, FLAG-Stx17 S202A and FLAG-Stx17 S202D with LC3 in HeLa cells incubated in full media or in EBSS for 2h. **, p < 0.01, (n=3) ANOVA; data are from 3 independent experiments (>500 primary object examined per well; minimum number of wells, 12). (H, I) Membrane fractions using OptiPrep gradients to test redistribution of Stx17pS202 from Golgi (H) in full media to LC3-II fraction in EBSS (I). (J) A model depicting translocation of Stx17pS202 to LC3+ phagophore upon induction of autophagy. See also Figure S5.
Figure 7:
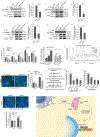
Figure 7:. Stx17 is required for autophagy initiation.
(A) Co-IP analysis of interactions between ATG13 and ULK1 in HeLaWT or Stx17KO cells. (B) Graph showing quantification of IP/input ratio of ULK1 in Co-IP with ATG13 in HeLa wild type vs Stx17 knockouts. p < 0.01, (n=3) t-test. (C) Co-IP analysis of interactions between ATG13 and FIP200 in HeLaWT or Stx17KO cells. (D) Graph showing quantification of IP/input ratio of ATG13 in Co-IP with FIP200 in HeLa wild type vs Stx17 knockouts. p < 0.01, (n=3) t-test. (E,F) Co-IP analysis of interactions between ATG13 and ULK1 in HeLaWT or TBK1KO cells. (F) Quantifications from three independent experiments showing ULK1 IP/input ratio. p < 0.01, (n=3) t-test. (G,H) Co-IP analysis of interactions between FIP200 and ATG13 in HeLaWT or TBK1KO cells. (H) Quantifications from three independent experiments showing ULK1 IP/input ratio. p < 0.01, (n=3) t-test. (I) HC quantification showing the effect of Stx17 and TBK1 knockouts on formation of LC3 dots in time dependent starvation response. *, p<0.05; **, p < 0.01, (n=3) ANOVA. data are from 4 independent experiments (>500 primary object examined per well; minimum number of wells, 12). (J) HC analysis to test the effect of Stx17KO on GFP-LC3 puncta formation after 30 min or 1h of starvation. *, p<0.05; **, p < 0.01, (n=3) ANOVA, data are from 3 independent experiments (>500 primary object examined per well; minimum number of wells per plate per time point, 16). (K) Screen shot of HC-scanned 96 well plate of HeLa cells transfected with mCherry-GFP-LC3B and incubated with EBSS for 0 min, 30 min or 60 min; HeLaWT (left half of the plate) or in Stx17KO (right half of the plate). For each experimental well, a minimum of 500 valid object/cells per well were counted for GFP-LC3 puncta. (L, M) HC microscopy analysis and quantification of Keima-LC3 fluorescence at 440nm in HeLaWT or Stx17KO cells incubated in full media or in EBSS for 6h. White masks, algorithm-defined Keima-LC3 positive cells (primary objects); purple masks, computer-identified Keima-LC3 dots. *, p<0.05; **, p < 0.01, (n=3) ANOVA. (N) Schematics showing different steps in LDH sequestration assay. (O) )LDH sequestration assay showing the effect of Stx17 and ATG13 knockouts on LDH sequestration in cell induced for autophagy by incubation with EBSS for 2h in presence of bafilomycin A1. 3 methyladenine (10 mM) was used as a positive control. (P) LDH sequestration assay showing the effect of mATG8s knockouts on LDH sequestration in cells induced for autophagy by incubation with EBSS for 2h in presence of bafilomycin A1. (Q, R) HC analysis and quantification of LDH-keima fluorescence at 440nm in HeLa wt or Stx17KO cells incubated in full media or with EBSS for 2h.*, p<0.05; **, p < 0.01, (n=3) ANOVA. White masks, algorithm-defined LDH-Keima positive cells (primary objects); purple masks, computer-identified LDH-Keima dots. (S) Model showing Stx17 in ER membranes and moves to Golgi after its phosphorylation by TBK1. After induction of autophagy Stx17pS202 translocates from Golgi to peripheral puncta and is associated with the FIP200/ATG13/ULK1 complex, which with additional components form mPAS. In HC experiments (L,M,Q,R), images are details form a large database of machinecollected and computer-processed images, and data are from 3 independent experiments (>500 primary object examined per well; minimum number of wells, 30). See also Figure S6.

Similar articles

Cited by

References

    1. Ahmad L, Zhang SY, Casanova JL, and Sancho-Shimizu V (2016). Human TBK1: A Gatekeeper of Neuroinflammation. Trends Mol Med 22, 511–527. - PMC - PubMed
    1. Alers S, Wesselborg S, and Stork B (2014). ATG13: just a companion, or an executor of the autophagic program? Autophagy 10, 944–956. - PMC - PubMed
    1. An H, and Harper JW (2018). Systematic analysis of ribophagy in human cells reveals bystander flux during selective autophagy. Nat Cell Biol 20, 135–143. - PMC - PubMed
    1. Anonsen JH, Egge-Jacobsen W, Aas FE, Borud B, Koomey M, and Vik A (2012). Novel protein substrates of the phospho-form modification system in Neisseria gonorrhoeae and their connection to O-linked protein glycosylation. Infect Immun 80, 22–30. - PMC - PubMed
    1. Arasaki K, Nagashima H, Kurosawa Y, Kimura H, Nishida N, Dohmae N, Yamamoto A, Yanagi S, Wakana Y, Inoue H, et al. (2018). MAP1B-LC1 prevents autophagosome formation by linking syntaxin 17 to microtubules. EMBO Rep. - PMC - PubMed

Publication types

MeSH terms

LinkOut - more resources