

Antarctic blackfin icefish genome reveals adaptations to extreme environments
- PMID: 30804520
- PMCID: PMC7307600
- DOI: 10.1038/s41559-019-0812-7
Antarctic blackfin icefish genome reveals adaptations to extreme environments
Abstract
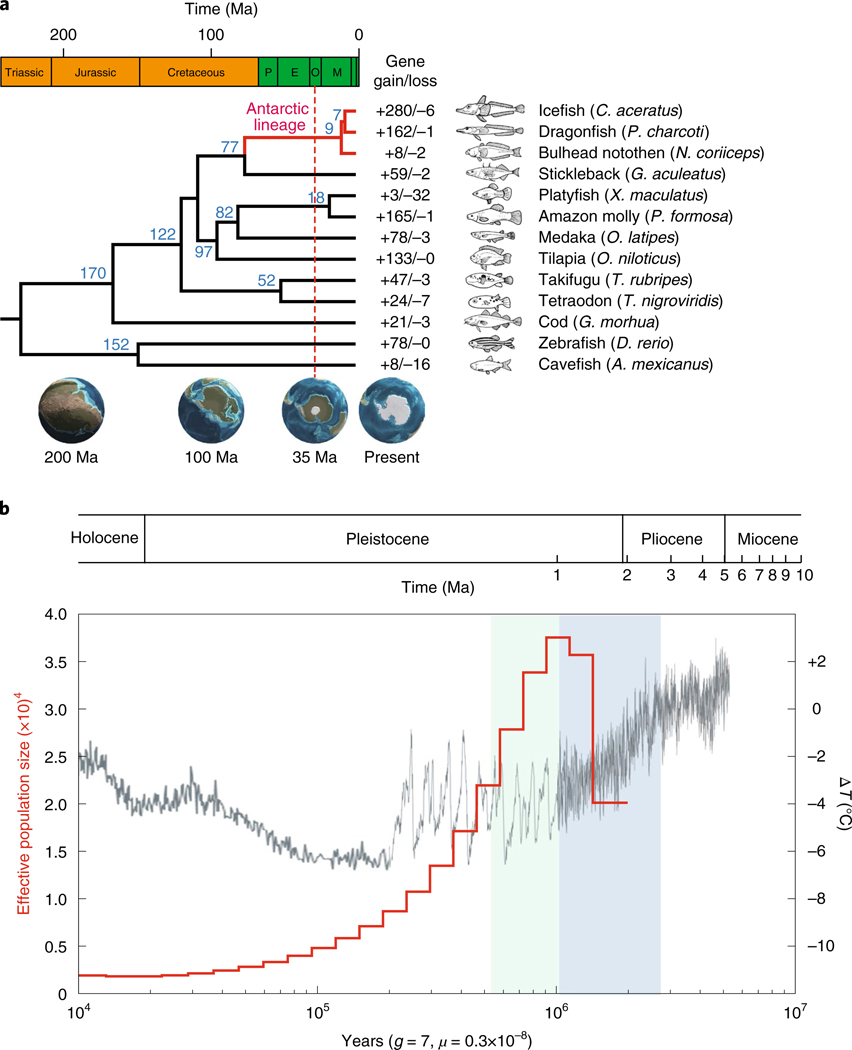
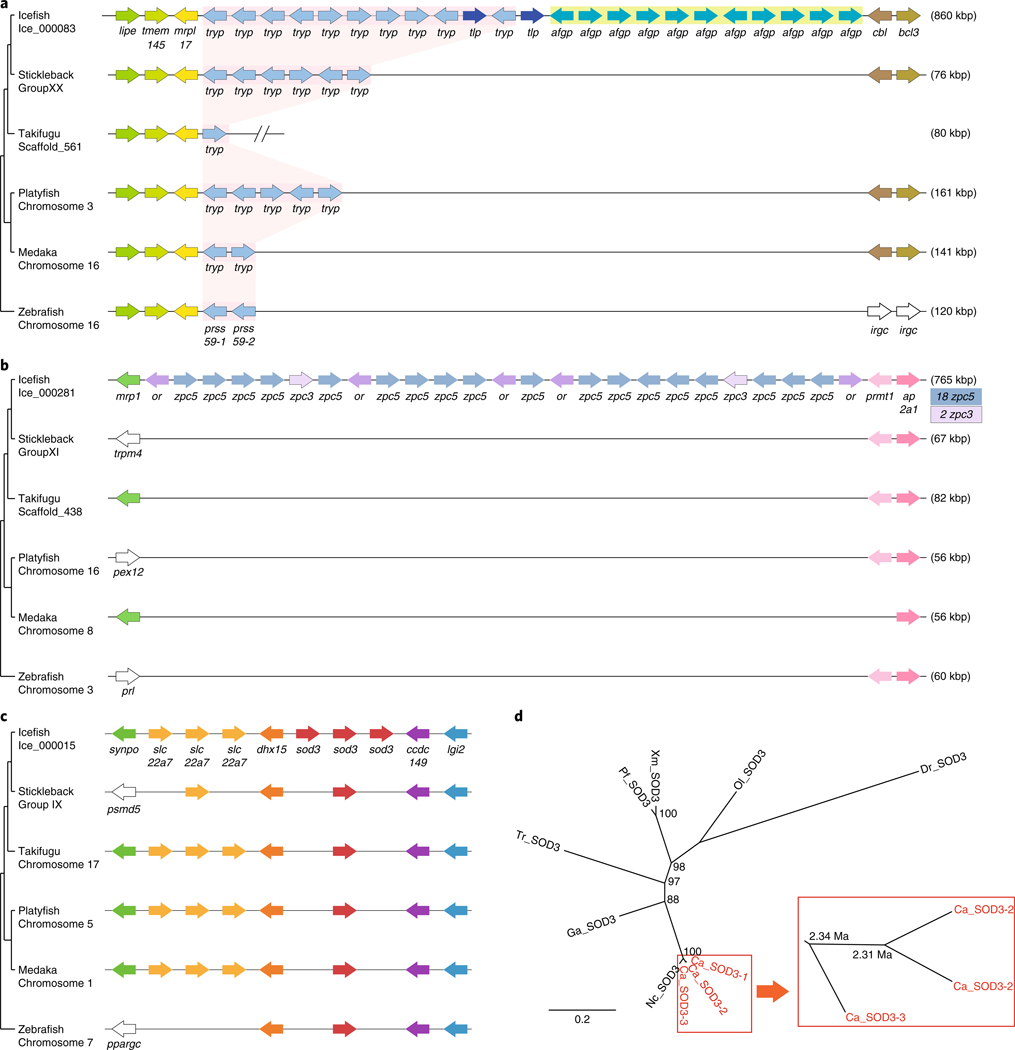
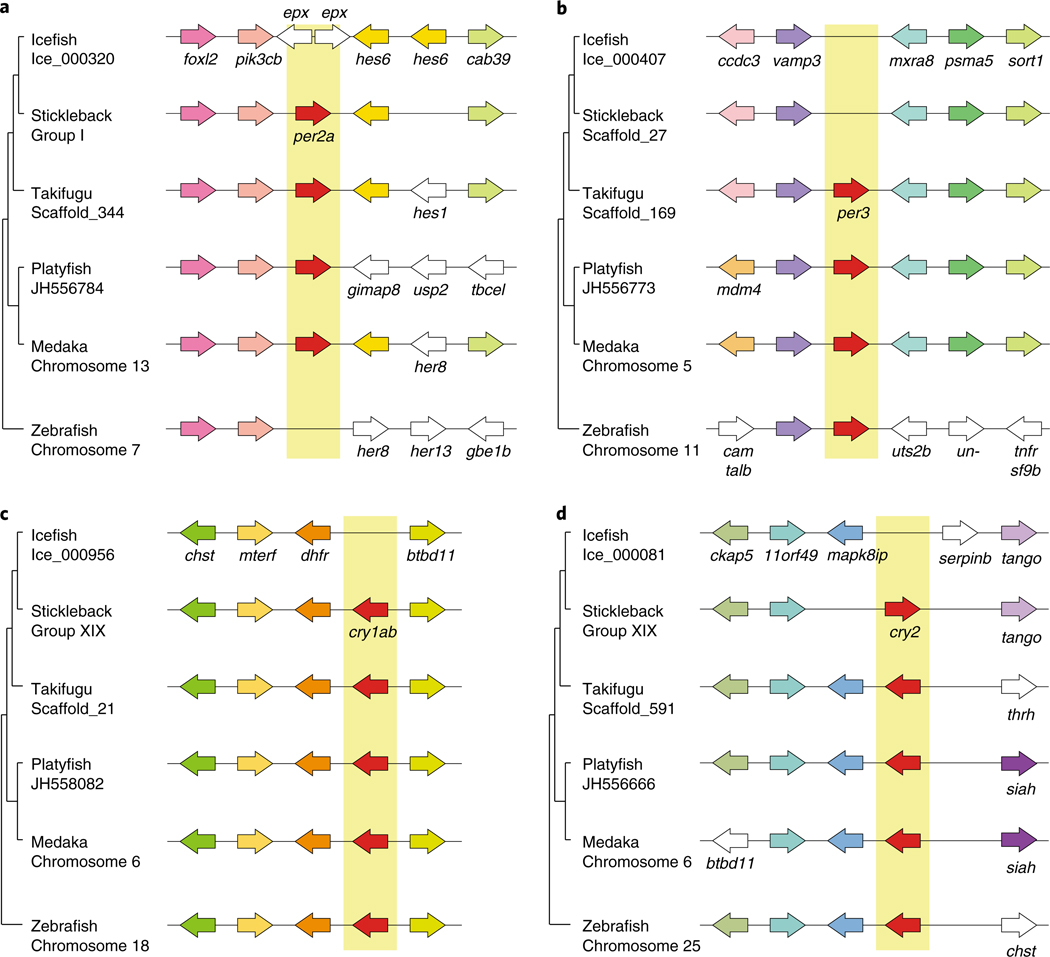
Icefishes (suborder Notothenioidei; family Channichthyidae) are the only vertebrates that lack functional haemoglobin genes and red blood cells. Here, we report a high-quality genome assembly and linkage map for the Antarctic blackfin icefish Chaenocephalus aceratus, highlighting evolved genomic features for its unique physiology. Phylogenomic analysis revealed that Antarctic fish of the teleost suborder Notothenioidei, including icefishes, diverged from the stickleback lineage about 77 million years ago and subsequently evolved cold-adapted phenotypes as the Southern Ocean cooled to sub-zero temperatures. Our results show that genes involved in protection from ice damage, including genes encoding antifreeze glycoprotein and zona pellucida proteins, are highly expanded in the icefish genome. Furthermore, genes that encode enzymes that help to control cellular redox state, including members of the sod3 and nqo1 gene families, are expanded, probably as evolutionary adaptations to the relatively high concentration of oxygen dissolved in cold Antarctic waters. In contrast, some crucial regulators of circadian homeostasis (cry and per genes) are absent from the icefish genome, suggesting compromised control of biological rhythms in the polar light environment. The availability of the icefish genome sequence will accelerate our understanding of adaptation to extreme Antarctic environments.
Figures

Similar articles
-
A chromosome-level reference genome of the Antarctic blackfin icefish Chaenocephalus aceratus.Sci Data. 2023 Sep 26;10(1):657. doi: 10.1038/s41597-023-02561-w. Sci Data. 2023. PMID: 37752129 Free PMC article.
-
Genomic conservation of erythropoietic microRNAs (erythromiRs) in white-blooded Antarctic icefish.Mar Genomics. 2016 Dec;30:27-34. doi: 10.1016/j.margen.2016.04.013. Epub 2016 May 14. Mar Genomics. 2016. PMID: 27189439 Free PMC article.
-
Complete mitochondrial genome of the Antarctic icefish, Chaenocephalus aceratus (Perciforms, Channichthyidae).Mitochondrial DNA. 2015;26(6):887-8. doi: 10.3109/19401736.2013.861444. Epub 2014 Jan 10. Mitochondrial DNA. 2015. PMID: 24409864
-
Molecular ecophysiology of Antarctic notothenioid fishes.Philos Trans R Soc Lond B Biol Sci. 2007 Dec 29;362(1488):2215-32. doi: 10.1098/rstb.2006.1946. Philos Trans R Soc Lond B Biol Sci. 2007. PMID: 17553777 Free PMC article. Review.
-
Tracking the evolutionary loss of hemoglobin expression by the white-blooded Antarctic icefishes.Gene. 2002 Aug 7;295(2):185-91. doi: 10.1016/s0378-1119(02)00691-1. Gene. 2002. PMID: 12354652 Review.
Cited by
-
Population genomics of an icefish reveals mechanisms of glacier-driven adaptive radiation in Antarctic notothenioids.BMC Biol. 2022 Oct 13;20(1):231. doi: 10.1186/s12915-022-01432-x. BMC Biol. 2022. PMID: 36224580 Free PMC article.
-
Cold Adaptation in Antarctic Notothenioids: Comparative Transcriptomics Reveals Novel Insights in the Peculiar Role of Gills and Highlights Signatures of Cobalamin Deficiency.Int J Mol Sci. 2021 Feb 11;22(4):1812. doi: 10.3390/ijms22041812. Int J Mol Sci. 2021. PMID: 33670421 Free PMC article.
-
Intergeneric hybrids inform reproductive isolating barriers in the Antarctic icefish radiation.Sci Rep. 2019 Apr 12;9(1):5989. doi: 10.1038/s41598-019-42354-z. Sci Rep. 2019. PMID: 30979924 Free PMC article.
-
Warm acclimation alters antioxidant defences but not metabolic capacities in the Antarctic fish, Notothenia coriiceps.Conserv Physiol. 2022 Aug 2;10(1):coac054. doi: 10.1093/conphys/coac054. eCollection 2022. Conserv Physiol. 2022. PMID: 35935168 Free PMC article.
-
Quantitative Proteomics and Network Analysis of Differentially Expressed Proteins in Proteomes of Icefish Muscle Mitochondria Compared with Closely Related Red-Blooded Species.Biology (Basel). 2022 Jul 26;11(8):1118. doi: 10.3390/biology11081118. Biology (Basel). 2022. PMID: 35892974 Free PMC article.
References
-
- Ruud JT Vertebrates without erythrocytes and blood pigment. Nature 173, 848–850 (1954). - PubMed
-
- Near TJ, Parker SK & Detrich HW III A genomic fossil reveals key steps in hemoglobin loss by the Antarctic icefishes. Mol. Biol. Evol. 23, 2008–2016 (2006). - PubMed
-
- Holeton GF Oxygen uptake and circulation by a hemoglobinless Antarctic fish (Chaenocephalus aceratus Lonnberg) compared with three red-blooded Antartic fish. Comp. Biochem. Physiol. 34, 457–471 (1970). - PubMed
-
- Sidell BD & O’Brien KM When bad things happen to good fish: the loss of hemoglobin and myoglobin expression in Antarctic icefishes. J. Exp. Biol. 209, 1791–1802 (2006). - PubMed
-
- Moylan TJ & Sidell BD Concentrations of myoglobin and myoglobin mRNA in heart ventricles from Antarctic fishes. J. Exp. Biol. 203, 1277–1286 (2000). - PubMed
Publication types
MeSH terms
Grants and funding
LinkOut - more resources
Full Text Sources
Miscellaneous
