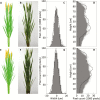
A three-dimensional canopy photosynthesis model in rice with a complete description of the canopy architecture, leaf physiology, and mechanical properties
- PMID: 30801123
- PMCID: PMC6487591
- DOI: 10.1093/jxb/ery430
A three-dimensional canopy photosynthesis model in rice with a complete description of the canopy architecture, leaf physiology, and mechanical properties
Abstract
In current rice breeding programs, morphological parameters such as plant height, leaf length and width, leaf angle, panicle architecture, and tiller number during the grain filling stage are used as major selection targets. However, so far, there is no robust approach to quantitatively define the optimal combinations of parameters that can lead to increased canopy radiation use efficiency (RUE). Here we report the development of a three-dimensional canopy photosynthesis model (3dCAP), which effectively combines three-dimensional canopy architecture, canopy vertical nitrogen distribution, a ray-tracing algorithm, and a leaf photosynthesis model. Concurrently, we developed an efficient workflow for the parameterization of 3dCAP. 3dCAP predicted daily canopy RUE for different nitrogen treatments of a given rice cultivar under different weather conditions. Using 3dCAP, we explored the influence of three canopy architectural parameters-tiller number, tiller angle and leaf angle-on canopy RUE. Under different weather conditions and different nitrogen treatments, canopy architecture optimized by manipulating these parameters can increase daily net canopy photosynthetic CO2 uptake by 10-52%. Generally, a smaller tiller angle was predicted for most elite rice canopy architectures, especially under scattered light conditions. Results further show that similar canopy RUE can be obtained by multiple different parameter combinations; these combinations share two common features of high light absorption by leaves in the canopy and a high level of coordination between the nitrogen concentration and the light absorbed by each leaf within the canopy. Overall, this new model has potential to be used in rice ideotype design for improved canopy RUE.
Keywords: 3D canopy; Canopy photosynthesis; ideotype; leaf nitrogen concentration; rice; systems model.
© The Author(s) 2019. Published by Oxford University Press on behalf of the Society for Experimental Biology.
Figures


Similar articles
-
Morphological acclimation to agronomic manipulation in leaf dispersion and orientation to promote "Ideotype" breeding: Evidence from 3D visual modeling of "super" rice (Oryza sativa L.).Plant Physiol Biochem. 2019 Feb;135:499-510. doi: 10.1016/j.plaphy.2018.11.010. Epub 2018 Nov 12. Plant Physiol Biochem. 2019. PMID: 30459081
-
How plant architecture affects light absorption and photosynthesis in tomato: towards an ideotype for plant architecture using a functional-structural plant model.Ann Bot. 2011 Oct;108(6):1065-73. doi: 10.1093/aob/mcr221. Epub 2011 Aug 23. Ann Bot. 2011. PMID: 21865217 Free PMC article.
-
Enhancement of rice canopy carbon gain by elevated CO(2) is sensitive to growth stage and leaf nitrogen concentration.New Phytol. 2006;170(2):321-32. doi: 10.1111/j.1469-8137.2006.01688.x. New Phytol. 2006. PMID: 16608457
-
Leaf canopy as a dynamic system: ecophysiology and optimality in leaf turnover.Ann Bot. 2005 Feb;95(3):521-33. doi: 10.1093/aob/mci050. Epub 2004 Dec 7. Ann Bot. 2005. PMID: 15585542 Free PMC article. Review.
-
Avenues for genetic modification of radiation use efficiency in wheat.J Exp Bot. 2000 Feb;51 Spec No:459-73. doi: 10.1093/jexbot/51.suppl_1.459. J Exp Bot. 2000. PMID: 10938854 Review.
Cited by
-
Contrasting phenotypes emerging from stable rules: A model based on self-regulated control loops captures the dynamics of shoot extension in contrasting maize phenotypes.Ann Bot. 2020 Sep 14;126(4):615-633. doi: 10.1093/aob/mcz168. Ann Bot. 2020. PMID: 31630162 Free PMC article.
-
Quantifying Contributions of Different Factors to Canopy Photosynthesis in 2 Maize Varieties: Development of a Novel 3D Canopy Modeling Pipeline.Plant Phenomics. 2023 Jul 26;5:0075. doi: 10.34133/plantphenomics.0075. eCollection 2023. Plant Phenomics. 2023. PMID: 37502446 Free PMC article.
-
Perspectives on improving light distribution and light use efficiency in crop canopies.Plant Physiol. 2021 Feb 25;185(1):34-48. doi: 10.1093/plphys/kiaa006. Plant Physiol. 2021. PMID: 33631812 Free PMC article.
-
Potential metabolic mechanisms for inhibited chloroplast nitrogen assimilation under high CO2.Plant Physiol. 2021 Nov 3;187(3):1812-1833. doi: 10.1093/plphys/kiab345. Plant Physiol. 2021. PMID: 34618071 Free PMC article.
-
A process-based coupled model of stomatal conductance-photosynthesis-transpiration during leaf ontogeny for water-saving irrigated rice.Photosynth Res. 2021 Feb;147(2):145-160. doi: 10.1007/s11120-020-00797-w. Epub 2021 Jan 3. Photosynth Res. 2021. PMID: 33389443
References
-
- Amthor JS. 1994. Scaling CO2-photosynthesis relationships from the leaf to the canopy. Photosynthesis Research 39, 321–350. - PubMed
-
- Chang TG, Xin CP, Qu MN, Zhao HL, Song QF, Zhu XG. 2017. Evaluation of protocols for measuring leaf photosynthetic properties of field-grown rice. Rice Science 24, 1–9.
-
- Chang TG, Zhu XG, Raines C. 2017. Source–sink interaction: a century old concept under the light of modern molecular systems biology. Journal of Experimental Botany 68, 4417–4431. - PubMed
-
- Chen W, Xu Z, Zhang W, Zhang L, Yang S. 2000. Creation of new plant type and breeding rice for super high yield. Acta Agronomica Sinica 27, 665–672.
-
- Chen W, Xu Z, Zhong L. 1991. Studies on canopy properties and its relation to dry matter production in japonica rice varieties with different plant types. Chinese Journal of Rice Science 5, 67–71.
Publication types
MeSH terms
Substances
LinkOut - more resources
Full Text Sources

