. 2019 Feb 21;176(5):1098-1112.e18.
doi: 10.1016/j.cell.2019.01.036.

FXR Regulates Intestinal Cancer Stem Cell Proliferation

Affiliations

FXR Regulates Intestinal Cancer Stem Cell Proliferation

Ting Fu et al. Cell. .

Abstract

Increased levels of intestinal bile acids (BAs) are a risk factor for colorectal cancer (CRC). Here, we show that the convergence of dietary factors (high-fat diet) and dysregulated WNT signaling (APC mutation) alters BA profiles to drive malignant transformations in Lgr5-expressing (Lgr5+) cancer stem cells and promote an adenoma-to-adenocarcinoma progression. Mechanistically, we show that BAs that antagonize intestinal farnesoid X receptor (FXR) function, including tauro-β-muricholic acid (T-βMCA) and deoxycholic acid (DCA), induce proliferation and DNA damage in Lgr5+ cells. Conversely, selective activation of intestinal FXR can restrict abnormal Lgr5+ cell growth and curtail CRC progression. This unexpected role for FXR in coordinating intestinal self-renewal with BA levels implicates FXR as a potential therapeutic target for CRC.

Keywords: BA-FXR axis; Lgr5(+) intestinal stem cells; colon cancer progression; genetic and dietary risk factors.


Conflict of interest statement

DECLARATION OF INTERESTS

S.F., C.L., R.T.Y., A.R.A., M.D. and R.M.E. are co-inventors of inventions related to certain FXR agonists.

Figures
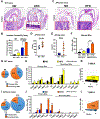
Figure 1.
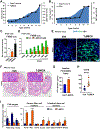
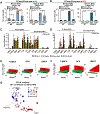
Figure 1.. HFD drives adenoma-adenocarcinoma progression in APCmin/+ mice
Wild-type (WT) and APCmin/+ mice were maintained on normal-chow diet (ND) or high-fat diet (HFD) from 4 weeks of age. (A, C) H&E staining of colons, with inset magnification of the epithelium. Large tumors are demarcated by dashed lines. Scale bar 1mm. (B) Intestinal permeability, measured by oral FITC-Dextran leakage into blood, in WT and APCmin/+ mice (16 week old) maintained on ND or HFD for 12 weeks. (D-E) Prognostic tumor marks of colon cancer, serum cancer antigen 19–9 (CA19) and carcinoembryonic antigen (CEA) in APCmin/+ mice. (F) Total serum BA levels. (G) Serum BA composition and (H) individual BAs levels in WT mice maintained on ND and HFD for 8 weeks. (I) Serum BA composition and (J) individual BA levels of APCmin/+ mice maintained on ND and HFD for 10 weeks. (K-L) Temporal changes in serum T-βMCA levels in WT and APCmin/+ mice on ND and HFD. Data represent the mean ± SEM. *p<0.05; **p<0.01; ***p<0.005, Student’s unpaired t-test.
Figure 2.
Figure 2.. T-βMCA promotes CRC progression
(A-B) Temporal changes in intestinal tumor burden and serum T-βMCA and DCA levels. (C) Luciferase activity in HT29 cells expressing a luciferase reporter gene functionally linked to an FXR-responsive element (FXRE-Luc) upon exposure to T-βMCA or the FXR agonist GW4064, and (D) T-βMCA (10μM) in combination with CDCA (10nM to 50μM). (E) Ileal proliferation in ND-fed APCmin/+ mice 12 hours after T-βMCA (400mg/kg p.o.) or vehicle (corn oil) administration (EdU incorporation, green; DAPI, blue. Scale bar 50μm). (F) H&E staining of colons and magnifications of the epithelium of APCmin/+ mice on ND treated with T-βMCA (400mg/kg p.o.) or Vehicle (corn oil) twice a week from 8 weeks of age. Tumors are outlined. Scale bar 1mm. (G-H) Intestinal permeability and serum CA19 levels in APCmin/+ mice treated with T-βMCA or Vehicle. (I) Relative expression of FXR target genes, and cancer and intestinal stem cell marker genes in tumors from APCmin/+ mice treated with Vehicle or T-βMCA (400 mg/kg twice a week for 6 weeks). Data represent the mean ± SEM. *p<0.05; **p<0.01; ***p<0.005. Student’s unpaired t-test.
Figure 3.
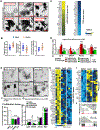
Figure 3.. FXR regulates Lgr5+ cancer stem cell expansion
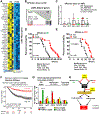
(A) Brightfield images of organoids generated from APCmin/+ mice on ND, treated from days 3–6 with vehicle (DMSO), T-βMCA, FexD, and T-βMCA+ FexD. Scale bar 50μm. (B) Quantification of organoid budding in (A). (C) Heatmap of stem cell marker gene expression in DMSO vs T-βMCA-treated organoids from (A). (D) Expression of intestinal stem cell (Lgr5-Ascl2) and p53 pathway marker genes in APCmin/+ organoids treated with T-βMCA with and without concurrent FexD treatment (* statistically different from vehicle; # statistically different from equivalent T-βMCA treatment). (E-G) Organoids generated from APCmin/+ mice on HFD, treated with FXR agonists (FexD, OCA and GW4064) or 5-Fluorouracil (5-FU) from days 2–5. (E) Brightfield images, scale bar 100μm. (F) Proliferation of organoids measured by EdU incorporation. (G) Stem cell marker gene expression after indicated treatments. (H-I) Heatmaps of changes in (H) stem cell gene signature (Lgr5-Ascl2) and (I) P53 pathway genes in APCmin/+ organoids after indicated treatments. Three representative replicates are shown. (J) GSEA of FexD-induced changes in the stem cell signature (Lgr5-Ascl2) and P53 pathway genes.
Figure 4.
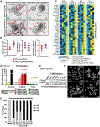
Figure 4.. FXR guards stem cell proliferation and chromosome stability
(A) Brightfield images of primary and secondary organoids generated from APCmin/+/Lgr5-GFP and APCmin/+/Lgr5-GFP/FXRflox mice. Arrows indicate crypt domains. Scale bar 20μm. (B) Quantification of crypts and secondary organoid formation in organoids from (A). (C) Heatmap showing relative gene expression in ISCs isolated from intestinal segments from APCmin/+/Lgr5-GFP, APCmin/+/Lgr5-GFP/FXRflox, WT/Lgr5-GFP, and WT/Lgr5-GFP/FXRflox mice (Lgr5-GFP+high cells -ISCs, were isolated were pooled from 6 mice 1 week after tamoxifen treatment). (D) Luciferase activity in HT29 cells expressing a WNT signaling luciferase reporter upon treatment with FexD and T-βMCA. (E) Western blot of phosphorylated H2AX (pH2AX), a marker of DNA damage, in APCmin/+ organoids at indicated times after exposure to T-βMCA. Relative pH2AX levels measured by Image J are indicated. (F) Representative images of chromosomes in organoids (from APCmin/+ mice) treated with DCA (10μm) or DMSO (control) for 7 passages. (G) Quantification of chromosome numbers from passages 5 to 10 of organoids in (F). Data represent the mean ± SEM. *, # p<0.05; **, # # p<0.01; ***, # # # p<0.005. Student’s unpaired t-test.
Figure 5.
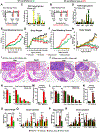
Figure 5.. Intestinally-restricted FXR agonism slows tumor progression
(A, B) Schematics of FexD treatment (50mg/kg/day p.o.) of WT and APCmin/+ mice on ND and HFD. Mice were fed HFD from 4 weeks. (C, D) Relative expression of FXR target genes (Shp, Fgf15 and Ibabp) in vehicle-treated WT (black), FexD-treated WT (yellow), vehicle-treated APCmin/+ (red), and FexD-treated APCmin/+ (green) mice. (E, F) Progressive changes in fecal bleeding scores measured by fecal occult blood test, and (G, H) body weights in above treatment groups. (I, J) Representative H&E staining of colons from 20 week old ND and 18 week old HFD fed mice as described above, with large tumors outlined. Enlarged images show the detailed structure. Scale bar 1mm. (K, L) Average tumor burden and tumor size distribution of mice in above treatment groups. (M, N) Intestinal permeability measured by FITC-Dextran of mice in above treatment groups. (O-R) Spleen weight and serum cytokine levels in mice in above treatment groups. Data represent the mean ± SEM. * statistically different from WT mice on ND; # statistically different from APCmin/+ on ND. *, # p<0.05; **, # # p<0.01; ***, # # # p<0.005. Student’s unpaired t-test.
Figure 6.
Figure 6.. Activation of intestinal FXR improves BA homeostasis
WT and APCmin/+ mice on ND and HFD were treated as described in Figure 5A and B. Experimental schemes of Vehicle (black) and FexD-treated (50mg/kg/day p.o., yellow) WT and Vehicle (red) and FexD-treated (green) APCmin/+ mice as described in Figure 5A, C. (A, B) Total primary and secondary serum BA levels during disease progression in mice described above. (C, D) Individual serum BA levels in 16 week old ND-fed and 14 week old HFD-fed mice after indicated treatments. (E, F) Temporal changes in serum T-βMCA, DCA and βMCA levels. (G) Principal coordinates analysis (PCoA) of the effects of genotype, diet, and FexD treatment on BA compositions. Data represent the mean ± SEM. * statistically different from WT mice on ND; # statistically different from APCmin/+ on ND. *, # p<0.05; **, # # p<0.01; ***, # # # p<0.005. Student’s unpaired t-test.
Figure 7.
Figure 7.. Intestinal FXR agonism improves CRC survival
(A) Heatmap of expression changes in stem cell signature (Lgr5-Ascl2) genes in APCmin/+ mice on ND. Data from 3 representative mice are shown. (B) GSEA of FexD-affected stem cell signature (Lgr5-Ascl2) genes. (C) Histological scores of tumors in APCmin/+ mice on HFD after FexD or vehicle treatment. (D-E) Survival curves for APCmin/+ mice on ND (D, n=18) and HFD (E, n=14) with FexD or vehicle treatment. (F) Parsing of human colon cancer survival curves (797 patients in GEO database) based on a FexD expression signature called from data (A). (G) Relative expression of intestinal stem cell genes in organoids generated from polyps collected from human colon cancer patients after treatment with FexD, OCA, T-βMCA and DCA for 1 week. (H) Schematic model depicting the convergence of genetic and dietary risk factors for colon cancer on FXR in intestinal stem cells indicating beneficial effects of FXR agonists.

Similar articles

Cited by

References

    1. Aguirre-Gamboa R, Gomez-Rueda H, Martinez-Ledesma E, Martinez-Torteya A, Chacolla-Huaringa R, Rodriguez-Barrientos A, Tamez-Pena JG, and Trevino V (2013). SurvExpress: an online biomarker validation tool and database for cancer gene expression data using survival analysis. PLoS One 8, e74250. - PMC - PubMed
    1. Anakk S, Watanabe M, Ochsner SA, McKenna NJ, Finegold MJ, and Moore DD (2011). Combined deletion of Fxr and Shp in mice induces Cyp17a1 and results in juvenile onset cholestasis. J Clin Invest 121, 86–95. - PMC - PubMed
    1. Barker N, Ridgway RA, van Es JH, van de Wetering M, Begthel H, van den Born M, Danenberg E, Clarke AR, Sansom OJ, and Clevers H (2009). Crypt stem cells as the cells-of-origin of intestinal cancer. Nature 457, 608–611. - PubMed
    1. Bayerdorffer E, Mannes GA, Ochsenkuhn T, Dirschedl P, Wiebecke B, and Paumgartner G (1995). Unconjugated secondary bile acids in the serum of patients with colorectal adenomas. Gut 36, 268–273. - PMC - PubMed
    1. Beyaz S, Mana MD, Roper J, Kedrin D, Saadatpour A, Hong SJ, Bauer-Rowe KE, Xifaras ME, Akkad A, Arias E, et al. (2016). High-fat diet enhances stemness and tumorigenicity of intestinal progenitors. Nature 531, 53–58. - PMC - PubMed

Publication types

MeSH terms

LinkOut - more resources