Structural basis of transcriptional regulation by the HigA antitoxin
- PMID: 30793388
- PMCID: PMC6561789
- DOI: 10.1111/mmi.14229
Structural basis of transcriptional regulation by the HigA antitoxin
Abstract
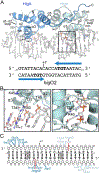
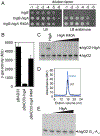
Bacterial toxin-antitoxin systems are important factors implicated in growth inhibition and plasmid maintenance. Type II toxin-antitoxin pairs are regulated at the transcriptional level by the antitoxin itself. Here, we examined how the HigA antitoxin regulates the expression of the Proteus vulgaris higBA toxin-antitoxin operon from the Rts1 plasmid. The HigBA complex adopts a unique architecture suggesting differences in its regulation as compared to classical type II toxin-antitoxin systems. We find that the C-terminus of the HigA antitoxin is required for dimerization and transcriptional repression. Further, the HigA structure reveals that the C terminus is ordered and does not transition between disorder-to-order states upon toxin binding. HigA residue Arg40 recognizes a TpG dinucleotide in higO2, an evolutionary conserved mode of recognition among prokaryotic and eukaryotic transcription factors. Comparison of the HigBA and HigA-higO2 structures reveals the distance between helix-turn-helix motifs of each HigA monomer increases by ~4 Å in order to bind to higO2. Consistent with these data, HigBA binding to each operator is twofold less tight than HigA alone. Together, these data show the HigB toxin does not act as a co-repressor suggesting potential novel regulation in this toxin-antitoxin system.
© 2019 John Wiley & Sons Ltd.
Figures


Similar articles
-
Structure of the Proteus vulgaris HigB-(HigA)2-HigB toxin-antitoxin complex.J Biol Chem. 2014 Jan 10;289(2):1060-70. doi: 10.1074/jbc.M113.512095. Epub 2013 Nov 20. J Biol Chem. 2014. PMID: 24257752 Free PMC article.
-
Antitoxin HigA inhibits virulence gene mvfR expression in Pseudomonas aeruginosa.Environ Microbiol. 2019 Aug;21(8):2707-2723. doi: 10.1111/1462-2920.14595. Epub 2019 Apr 24. Environ Microbiol. 2019. PMID: 30882983
-
2.09 Å Resolution structure of E. coli HigBA toxin-antitoxin complex reveals an ordered DNA-binding domain and intrinsic dynamics in antitoxin.Biochem J. 2020 Oct 30;477(20):4001-4019. doi: 10.1042/BCJ20200363. Biochem J. 2020. PMID: 33000860
-
Keeping the Wolves at Bay: Antitoxins of Prokaryotic Type II Toxin-Antitoxin Systems.Front Mol Biosci. 2016 Mar 22;3:9. doi: 10.3389/fmolb.2016.00009. eCollection 2016. Front Mol Biosci. 2016. PMID: 27047942 Free PMC article. Review.
-
Higher-Order Structure in Bacterial VapBC Toxin-Antitoxin Complexes.Subcell Biochem. 2017;83:381-412. doi: 10.1007/978-3-319-46503-6_14. Subcell Biochem. 2017. PMID: 28271484 Review.
Cited by
-
A minimal model for gene expression dynamics of bacterial type II toxin-antitoxin systems.Sci Rep. 2021 Sep 30;11(1):19516. doi: 10.1038/s41598-021-98570-z. Sci Rep. 2021. PMID: 34593858 Free PMC article.
-
Structure-based design of peptides that trigger Streptococcus pneumoniae cell death.FEBS J. 2021 Mar;288(5):1546-1564. doi: 10.1111/febs.15514. Epub 2020 Aug 31. FEBS J. 2021. PMID: 32770723 Free PMC article.
-
The Putative Virulence Plasmid pYR4 of the Fish Pathogen Yersinia ruckeri Is Conjugative and Stabilized by a HigBA Toxin-Antitoxin System.Biology (Basel). 2024 Aug 23;13(9):652. doi: 10.3390/biology13090652. Biology (Basel). 2024. PMID: 39336081 Free PMC article.
-
Type II Toxin-Antitoxin Systems: Evolution and Revolutions.J Bacteriol. 2020 Mar 11;202(7):e00763-19. doi: 10.1128/JB.00763-19. Print 2020 Mar 11. J Bacteriol. 2020. PMID: 31932311 Free PMC article. Review.
-
Distinctive microbial community and genome structure in coastal seawater from a human-made port and nearby offshore island in northern Taiwan facing the Northwestern Pacific Ocean.PLoS One. 2023 Jun 9;18(6):e0284022. doi: 10.1371/journal.pone.0284022. eCollection 2023. PLoS One. 2023. PMID: 37294811 Free PMC article.
References
-
- Afif H, Allali N, Couturier M, Van Melderen L. 2001. The ratio between CcdA and CcdB modulates the transcriptional repression of the ccd poison-antidote system. Mol Microbiol 41: 73–82. - PubMed
Publication types
MeSH terms
Substances
Grants and funding
LinkOut - more resources
Full Text Sources

