

Position-, disorder-, and salt-dependent diffusion in binding-coupled-folding of intrinsically disordered proteins
- PMID: 30793144
- PMCID: PMC6589441
- DOI: 10.1039/c8cp06803h
Position-, disorder-, and salt-dependent diffusion in binding-coupled-folding of intrinsically disordered proteins
Abstract
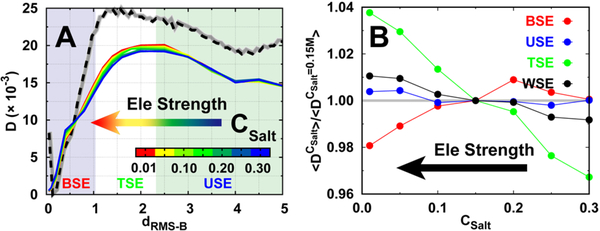
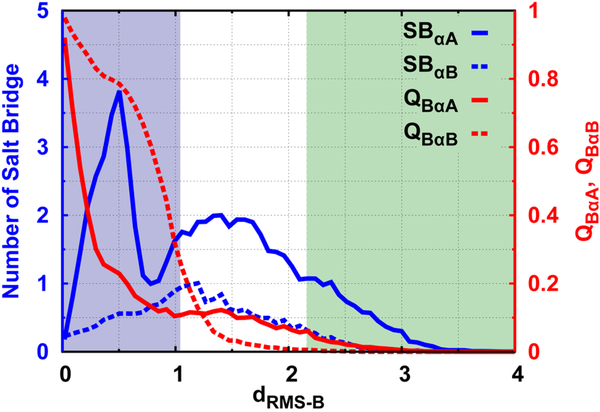
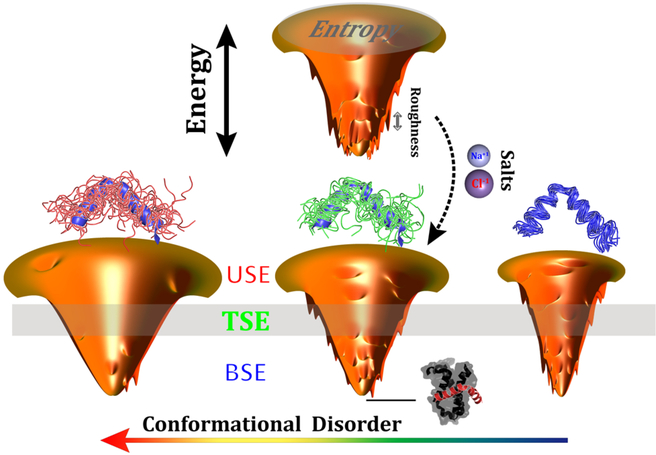
Successful extensions of protein-folding energy landscape theory to intrinsically disordered proteins' (IDPs') binding-coupled-folding transition can enormously simplify this biomolecular process into diffusion along a limited number of reaction coordinates, and the dynamics subsequently is described by Kramers' rate theory. As the critical pre-factor, the diffusion coefficient D has direct implications on the binding kinetics. Here, we employ a structure-based model (SBM) to calculate D in the binding-folding of an IDP prototype. We identify a strong position-dependent D during binding by applying a reaction coordinate that directly measures the fluctuations in a Cartesian configuration space. Using the malleability of the SBM, we modulate the degree of conformational disorder in an isolated IDP and determine complex effects of intrinsic disorder on D varying for different binding stages. Here, D tends to increase with disorder during initial binding but shows a non-monotonic relationship with disorder in terms of a decrease-followed-by-increase in D during the late binding stage. The salt concentration, which correlates with electrostatic interactions via Debye-Hückel theory in our SBM, also modulates D in a stepwise way. The speeding up of diffusion by electrostatic interactions is observed during the formation of the encounter complex at the beginning of binding, while the last diffusive binding dynamics is hindered by non-native salt bridges. Because D describes the diffusive speed locally, which implicitly reflects the roughness of the energy landscape, we are eventually able to portray the binding energy landscape, including that from IDPs' binding, then to binding with partial folding, and finally to rigid docking, as well as that under different environmental salt concentrations. Our theoretical results provide key mechanistic insights into IDPs' binding-folding, which is internally conformation- and externally salt-controlled with respect to diffusion.
Conflict of interest statement
Conflicts of interest
There are no conflicts to declare.
Figures
Similar articles
-
Electrostatically accelerated encounter and folding for facile recognition of intrinsically disordered proteins.PLoS Comput Biol. 2013;9(11):e1003363. doi: 10.1371/journal.pcbi.1003363. Epub 2013 Nov 21. PLoS Comput Biol. 2013. PMID: 24278008 Free PMC article.
-
Features of molecular recognition of intrinsically disordered proteins via coupled folding and binding.Protein Sci. 2019 Nov;28(11):1952-1965. doi: 10.1002/pro.3718. Epub 2019 Sep 4. Protein Sci. 2019. PMID: 31441158 Free PMC article. Review.
-
Diffusion-limited association of disordered protein by non-native electrostatic interactions.Nat Commun. 2018 Nov 9;9(1):4707. doi: 10.1038/s41467-018-06866-y. Nat Commun. 2018. PMID: 30413699 Free PMC article.
-
A structurally heterogeneous transition state underlies coupled binding and folding of disordered proteins.J Biol Chem. 2019 Jan 25;294(4):1230-1239. doi: 10.1074/jbc.RA118.005854. Epub 2018 Dec 4. J Biol Chem. 2019. PMID: 30514761 Free PMC article.
-
Understanding the Binding Induced Folding of Intrinsically Disordered Proteins by Protein Engineering: Caveats and Pitfalls.Int J Mol Sci. 2020 May 15;21(10):3484. doi: 10.3390/ijms21103484. Int J Mol Sci. 2020. PMID: 32429036 Free PMC article. Review.
Cited by
-
Myofilament-associated proteins with intrinsic disorder (MAPIDs) and their resolution by computational modeling.Q Rev Biophys. 2023 Jan 11;56:e2. doi: 10.1017/S003358352300001X. Q Rev Biophys. 2023. PMID: 36628457 Free PMC article. Review.
-
Investigating the Conformational Dynamics of a Y-Family DNA Polymerase during Its Folding and Binding to DNA and a Nucleotide.JACS Au. 2021 Dec 16;2(2):341-356. doi: 10.1021/jacsau.1c00368. eCollection 2022 Feb 28. JACS Au. 2021. PMID: 35252985 Free PMC article.
-
Confinement and Crowding Effects on Folding of a Multidomain Y-Family DNA Polymerase.J Chem Theory Comput. 2020 Feb 11;16(2):1319-1332. doi: 10.1021/acs.jctc.9b01146. Epub 2020 Jan 30. J Chem Theory Comput. 2020. PMID: 31972079 Free PMC article.
-
New insights into disordered proteins and regions according to the FOD-M model.PLoS One. 2022 Oct 10;17(10):e0275300. doi: 10.1371/journal.pone.0275300. eCollection 2022. PLoS One. 2022. PMID: 36215254 Free PMC article.
-
Advanced Sampling Methods for Multiscale Simulation of Disordered Proteins and Dynamic Interactions.Biomolecules. 2021 Sep 28;11(10):1416. doi: 10.3390/biom11101416. Biomolecules. 2021. PMID: 34680048 Free PMC article. Review.
References
-
- Bryngelson JD and Wolynes PG, J. Phys. Chem, 1989, 93, 6902–6915.
-
- Socci N, Onuchic JN and Wolynes PG, J. Chem. Phys, 1996, 104, 5860–5868.
-
- Bryngelson JD, Onuchic JN, Socci ND and Wolynes PG, Proteins: Struct., Funct., Bioinf, 1995, 21, 167–195. - PubMed
-
- Shakhnovich E, Karplus M et al., nature, 1994, 369, 248. - PubMed
MeSH terms
Substances
Grants and funding
LinkOut - more resources
Full Text Sources
Research Materials